. 2020 Aug 17:11:1848.
doi: 10.3389/fmicb.2020.01848. eCollection 2020.

Ancestral Absence of Electron Transport Chains in Patescibacteria and DPANN

Affiliations

Ancestral Absence of Electron Transport Chains in Patescibacteria and DPANN

Jacob P Beam et al. Front Microbiol. .

Abstract

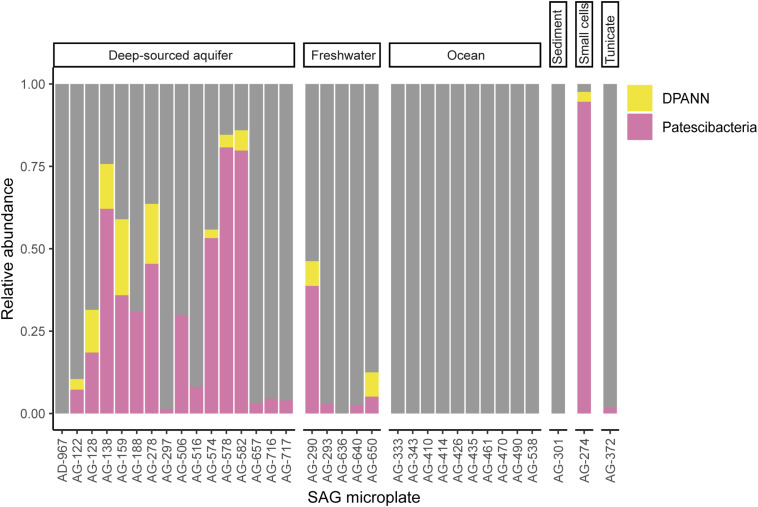
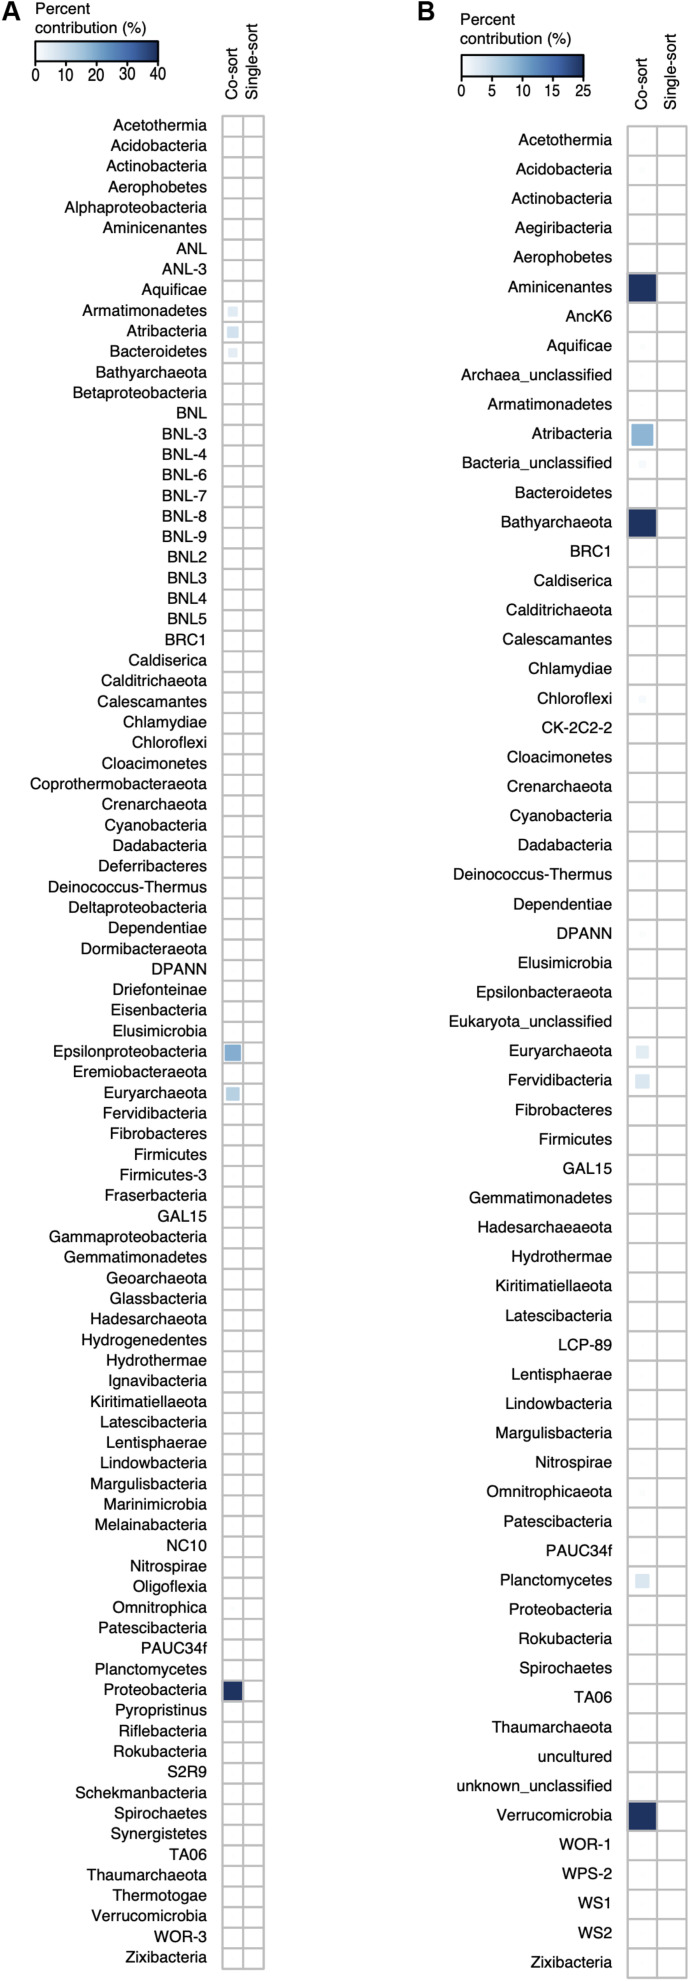
Recent discoveries suggest that the candidate superphyla Patescibacteria and DPANN constitute a large fraction of the phylogenetic diversity of Bacteria and Archaea. Their small genomes and limited coding potential have been hypothesized to be ancestral adaptations to obligate symbiotic lifestyles. To test this hypothesis, we performed cell-cell association, genomic, and phylogenetic analyses on 4,829 individual cells of Bacteria and Archaea from 46 globally distributed surface and subsurface field samples. This confirmed the ubiquity and abundance of Patescibacteria and DPANN in subsurface environments, the small size of their genomes and cells, and the divergence of their gene content from other Bacteria and Archaea. Our analyses suggest that most Patescibacteria and DPANN in the studied subsurface environments do not form specific physical associations with other microorganisms. These data also suggest that their unusual genomic features and prevalent auxotrophies may be a result of ancestral, minimal cellular energy transduction mechanisms that lack respiration, thus relying solely on fermentation for energy conservation.

Keywords: Archaea; Bacteria; evolution; genomics fermentation; oxidoreductases; respiration.


Figures

FIGURE 1
FIGURE 1
Geographic locations of sample collection sites.
FIGURE 2
FIGURE 2
Maximum likelihood phylogenetic trees of concatenated single copy proteins from Bacteria (A) and Archaea (B). All SAGs from this study are highlighted red. Patescibacteria and DPANN are highlighted with gray shading and labeled by individual proposed phyla within the superphyla (Rinke et al., 2013; Brown et al., 2015). Tree source files are available as Supplementary Data S1.
FIGURE 3
FIGURE 3
Relative abundance of Patescibacteria and DPANN in randomized SAG sets from 34 geographically diverse field samples. To avoid potential biases of the deeper sequencing of selected SAGs, only LoCoS results were used in this analysis. SAG microplate identifiers can be cross-referenced with specific SAGs and geographic sites in Supplementary Table S1. The AG-274 SAG microplate was generated from small cells from a water-filled rock fracture at 1,340 m depth below surface in the Beatrix gold mine in South Africa.
FIGURE 4
FIGURE 4
Contribution of individual phyla to the Chi-square statistic from cell co-sorting analyses based on checkM (A) and 16S rRNA genes (B). Phylum assignments are based on concatenated-alignment based phylogenomic tree (Figure 2) in (A) and from 16S rRNA classification in (B).
FIGURE 5
FIGURE 5
Phylum-resolved cell diameters. Solid black bars indicate medians; boxes represent the interquartile ranges (IQR) of the 1st (Q1) and 3rd (Q3) quartiles; whiskers denote the minimum (Q1 – 1.5IQR) and maximum (Q3 + 1.5IQR) values; outliers outside of the whiskers are marked by black dots. Orange indicates Bacteria and green indicates Archaea. A pairwise ranked-sum Wilcoxon test confirmed that the median diameter of Patescibacteria (highlighted in magenta) was smaller than most other phyla (27/36 phyla with p-values < 0.05; Supplementary Table S5). The median diameter of DPANN (highlighted in yellow) was not significantly different from other archaea (1/36 phyla with p-values < 0.05; Supplementary Table S5), likely due to the large variability in DPANN cell diameters. Individual cell diameters are available in Supplementary Table S1 and pairwise p-values are located in Supplementary Table S5.
FIGURE 6
FIGURE 6
Principal coordinates analysis (PCA) of the relative abundance of clusters of orthologous groups (COG) categories as the input variables. Included are genomes from this (Supplementary Table S1) and other studies (Supplementary Table S2) with >30% completeness and near-full-length 16S rRNA genes. The vector plot in the upper left corner shows the COG categories that contributed the most to the separation of the genomes: Translation, ribosomal structure and biogenesis (J), RNA processing and modification (A), transcription (K), replication, recombination and repair (L), chromatin structure and dynamics (B), cell cycle control, cell division, chromosome partitioning (D), nuclear structure (Y), defense mechanisms (V), signal transduction mechanisms (T), cell wall/membrane/envelope biogenesis (M), cell motility (N), cytoskeleton (Z), extracellular structures (W), intracellular trafficking, secretion, and vesicular transport (U), posttranslational modification, protein turnover, chaperones (O), energy production and conversion (C), carbohydrate transport and metabolism (G), amino acid transport and metabolism (E), nucleotide transport and metabolism (F), coenzyme transport and metabolism (H), lipid transport and metabolism (I), inorganic ion transport and metabolism (P), secondary metabolites biosynthesis, transport and catabolism (Q), general function prediction only (R), function unknown (S). SAG, single amplified genome; MAG, metagenome assembled genome. Symbiont genomes are listed in Supplementary Table S4. Note position of Nanoarchaeum equitans with black arrow.
FIGURE 7
FIGURE 7
(A–F) Relationships between estimated genome size, coding density, oxidoreductase count, and cell diameter among SAGs (Supplementary Table S1) and other genome sequences (Supplementary Table S2) that were ≥30% complete and contained the 16S rRNA gene. Symbiont genomes are listed in Supplementary Table S4.
FIGURE 8
FIGURE 8
Maximum likelihood phylogeny of near full-length (>1,200 bp) 16S rRNA genes of Bacteria and Archaea annotated with the abundance of electron transport chain complexes, oxygen reductases, and oxidoreductases (Enzyme Commission 1; EC1). Included are SAGs from this study (Supplementary Table S1) and previously reported genome sequences (Supplementary Table S2). The four innermost rings depict the counts of the electron transport chain complexes: I (NADH dehydrogenase subunits), II (succinate dehydrogenase subunits), III (cytochrome c reductase subunits), and IV (oxygen, nitrate, sulfate, iron, arsenate, and selenate reductase subunits). The outermost ring shows the relative abundance of oxidoreductases (Ox) for each genome assembly as a gradient from low (blue) to high (yellow). The peripheral stacked bar charts show the counts of oxygen reductases from both the heme copper oxidase and bd-ubiquinol oxidase oxygen reductase (O2red) families grouped as high (orange) or low (sky blue) affinity for oxygen (note scale bar differences between bacterial and archaeal trees). Patescibacteria are highlighted in magenta and DPANN are highlighted in yellow. Other bacterial and archaeal phyla are highlighted in alternating white and gray. Tree source files are available as Supplementary Data S2.
FIGURE 9
FIGURE 9
Maximum likelihood phylogenetic trees of the oxygen-binding subunit I from the heme copper oxidase (HCO) type A (A) and the A subunit from the bd-ubiquinol (B) oxygen reductase families. Patescibacteria and DPANN sequences are marked with magenta and yellow stars, respectively. The Patescibacteria HCO type A sequences (A) are nested within a larger clade containing mostly Proteobacteria (orange), and the Patescibacteria and DPANN bd-ubiquinol sequences (B) are nested within Proteobacteria (orange) and Firmicutes (blue) dominated clades. The scale bar represents the estimated number of substitutions per site.
FIGURE 10
FIGURE 10
Oxidoreductase activity in subsurface (∼300 m below surface) microbial cells from Homestake Mine (Lead, SD, United States) probed by RedoxSensor Green (RSG; Thermo Fisher).

References

    1. Altschul S. F., Gish W., Miller W., Myers E. W., Lipman D. J. (1990). Basic local alignment search tool. J. Mol. Biol. 215 403–410. 10.1016/S0022-2836(05)80360-2 - DOI - PubMed
    1. Altschul S. F., Madden T. L., Schäffer A. A., Zhang J., Zhang Z., Miller W., et al. (1997). Gapped BLAST and PSI-BLAST: a new generation of protein database search programs. Nucleic Acids Res. 25 3389–3402. 10.1093/nar/25.17.3389 - DOI - PMC - PubMed
    1. Aramaki T., Blanc-Mathieu R., Endo H., Ohkubo K., Kanehisa M., Goto S., et al. (2019). KofamKOALA: KEGG ortholog assignment based on profile HMM and adaptive score threshold. bioRxiv [Preprint]. 10.1101/602110 - DOI - PMC - PubMed
    1. Bankevich A., Nurk S., Antipov D., Gurevich A. A., Dvorkin M., Kulikov A. S., et al. (2012). SPAdes: a new genome assembly algorithm and its applications to single-cell sequencing. J. Comput. Biol. 19 455–477. 10.1089/cmb.2012.0021 - DOI - PMC - PubMed
    1. Bateman A., Martin M. J., O’Donovan C., Magrane M., Alpi E., Antunes R., et al. (2017). UniProt: the universal protein knowledgebase. Nucleic Acids Res. 45 D158–D169. 10.1093/nar/gkw1099 - DOI - PMC - PubMed