. 2020 Aug 18:11:1929.
doi: 10.3389/fmicb.2020.01929. eCollection 2020.

Bioorthogonal Non-canonical Amino Acid Tagging Combined With Flow Cytometry for Determination of Activity in Aquatic Microorganisms

Affiliations

Bioorthogonal Non-canonical Amino Acid Tagging Combined With Flow Cytometry for Determination of Activity in Aquatic Microorganisms

Mathilde Lindivat et al. Front Microbiol. .

Abstract

In this study, we have combined bioorthogonal non-canonical amino acid tagging (BONCAT) and flow cytometry (FCM) analysis, and we demonstrate the applicability of the method for marine prokaryotes. Enumeration of active marine bacteria was performed by combining the DNA stain SYBR Green with detection of protein production with BONCAT. After optimization of incubation condition and substrate concentration on monoculture of Escherichia coli, we applied and modified the method to natural marine samples. We found that between 10 and 30% of prokaryotes in natural communities were active. The method is replicable, fast, and allow high sample throughput when using FCM. We conclude that the combination of BONCAT and FCM is an alternative to current methods for quantifying active populations in aquatic environments.

Keywords: bioorthogonal non-canonical amino acid tagging; flow cytometry; marine microbes; protein synthesis; single cell activity.


Figures

Figure 1
Figure 1
Study of newly synthetized proteins with l-homopropargylglycine (HPG) incorporation into new bacterial proteins. After labeling by click chemistry and Alexa Fluor®, azide 488, 405, and 647, samples are analyzed with flow cytometry (Blue, Violet, and Red lasers).
Figure 2
Figure 2
Experimental set up for natural sea water analysis with bioorthogonal non-canonical amino acid tagging. l-homopropargylglycine was used as analogous amino acid. Samples were incubated with HPG, without HPG (negative control), and with HPG and antibiotics (Chloramphenicol control) under the same conditions. After fixation with formaldehyde to stop the HPG incorporation process, samples were permeabilized. The click chemistry reaction labeled active cells with protein synthesis and detection was carried out with flow cytometry (FCM).
Figure 3
Figure 3
HPG incorporation in Escherichia coli over time with 1 μM (black) and 5 μM (gray) and control (dark gray). HPG samples were collected every hour and then at 24 h after the incubation start and analyzed with FCM and LDS 751/AF488 azide. Percentages of positive cells were determined comparing to total cell enumeration (2,000 cells analyzed per samples in triplicates). Activity increased in the first 3–4 h to decrease in the following hours. After, new produced cells do not incorporate HPG combined with a continuous increase in cell concentration leading to a diminution of detected activity.
Figure 4
Figure 4
Chloramphenicol action on protein production of E. coli. Chloramphenicol was added after 30 min of incubation with HPG and samples were collected every hour. Cells were analyzed with SYBR Green/AF647 azide and FCM (10,000 cells analyzed). Dot plot of E. coli cells incubated for: 30 min with HPG (A), 1 h with HPG and 30 min with chloramphenicol (B), 2 h with HPG and 1.5 h with chloramphenicol (C), 3 h with HPG and 2.5 h with chloramphenicol (D) Negative control without HPG (E). Respective positive control incubation of E. coli with HPG for 30 min (F), 1 h (G), 2 h (H), and 3 h (I). Q1 contain negative BONCAT cells; Q2 contain positive BONCAT cells (active). Positive BONCAT cells (=active cells) increased to 6 ± 0.7% during the first 30 min of incubation with HGP (A). After adding chloramphenicol, activity stabilized to 8.8 ± 1.7% (B) and started to decrease at 2 h (D) whereas the positive control increased from 3 ± 0.4% (F) to 18.6 ± 2% (G), 71.2 ± 0.3% (H) and 79.6 ± 0.1% (I).
Figure 5
Figure 5
FCM dot plots of E. coli stained with (A) DNA stain LDS 751, one population and (B) DNA stain SYBR Green revealing two bacterial populations, high (HNA) and low DNA (LNA) content. Sea water microorganisms stained with (C) LDS 751 and (D) SYBR Green. In addition to bacteria, small particles that are consistent with the size of viruses are detected with SYBR Green (Gates V1, V2, and V3). Gates were determined for each dye and size-standardized beads of 2, 1, and 0.5 μm were used for size identification (Thermofisher Scientific, USA).
Figure 6
Figure 6
Dot plots and histograms of E. coli cells positives for click chemistry with Alexa Fluor® azide dyes. Cultures are incubated with HPG, permeabilized with ethanol, and detected with click chemistry, analysis with Attune NxT flow cytometer. Positive cells were determined by gating on dot plots (gray circle), the population can be found in the corresponding histogram (gray box). (A) Dot plot of click positive cell with AF488 azide. (B) Histogram of click positive cell with AF488 azide (C) Dot plot of click positive cell with AF405 azide. (D) Histogram of click positive cell with AF405 azide. (E) Dot plot of click positive cell with AF647 azide. (F) Histogram of click positive cell with AF647 azide.
Figure 7
Figure 7
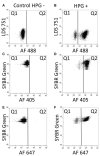
Dot plots of BONCAT/DNA staining with LDS 571/AF488 azide, SYBR Green/AF405 azide and SYBR Green/AF647 azide. Gates were positioned according to unstained samples and instrument settings. (A) Control negative HPG with LDS 751/AF488: LDS 751 stained cells in Q1. (B) Positive control HPG: LDS 751 positive cells in Q1 and Q2, positive BONCAT cells in Q2. (C) Control negative HPG with SYBR Green/AF405: SYBR Green stained cells in Q1. (D) Positive control HPG with SYBR Green/AF405: SYBR Green positive cells in Q1 and Q2, positive BONCAT cells in Q2. (E) Control negative HPG with SYBR Green/AF647. (F) Positive control HPG with SYBR Green/AF647: SYBR Green positive cells in Q1 and Q2 (AF647), positive BONCAT cells in Q2.
Figure 8
Figure 8
Dot plots and histogram from FCM show marine bacterial metabolic activity with BONCAT using double staining with SYBR Green and AF647 azide. Bacterial population was gated from SYBR Green/SSC. When analyzing both click and SYBR Green, all events outside the SYBR Green/SSC gate are excluded from click analysis. (A) DNA stained cells gated from SYBR Green fluorescence (R1). (B) Combination of DNA stain and BONCAT, Q1 are DNA stained bacteria, negative BONCAT; Q2: BONCAT positive specifically selected bacteria; Q3: small fluorescent particles and background; and Q4: background and unspecific BONCAT staining. (C) Gated bacteria from (A) are further analyzed with comparison with BONCAT fluorescence to select bacteria specifically (2,324 bacteria analyzed). (D) Histogram of Q2 cells, the distribution of positive cells depending on their fluorescence activity. (E) Negative control without HPG following click reaction (1,422 bacteria analyzed).
Figure 9
Figure 9
Sea water microorganisms BONCAT analysis with FCM (SYBR Green and AF647 azide) over 8 h. Protein synthesis activity was monitored every hour (in triplicates biological samples and analyzed three times). Activity increased in the first three hours to reach a stable state.

References

    1. Alonso-Sáez L., Gasol J. M. (2007). Seasonal variations in the contributions of different bacterial groups to the uptake of low-molecular-weight compounds in Northwestern Mediterranean coastal waters. Appl. Environ. Microbiol. 73, 3528–3535. 10.1128/AEM.02627-06, PMID: - DOI - PMC - PubMed
    1. Bell R. T. (1993). “Estimating production of heterotrophic bacterioplankton via incorporation of tritiated thymidine” in Handbook of methods in aquatic microbial ecology. 1st Edn. ed. Kemp P. F. (New York: Taylor and Francis; ), 495–504.
    1. Brakstad O. G., Lødeng A. G. G. (2005). Microbial diversity during biodegradation of crude oil in seawater from the North Sea. Microb. Ecol. 49, 94–103. 10.1007/s00248-003-0225-6, PMID: - DOI - PubMed
    1. Brussaard C. P. (2004). Optimization of procedures for counting viruses by flow cytometry. Appl. Environ. Microbiol. 70, 1506–1513. 10.1128/AEM.70.3.1506-1513.2004, PMID: - DOI - PMC - PubMed
    1. Cottrell M. T., Kirchman D. L. (2004). Single-cell analysis of bacterial growth, cell size, and community structure in the Delaware estuary. Aquat. Microb. Ecol. 34, 139–149. 10.3354/ame034139 - DOI

LinkOut - more resources