

Cross-Stress Adaptation in a Piezophilic and Hyperthermophilic Archaeon From Deep Sea Hydrothermal Vent
- PMID: 33013758
- PMCID: PMC7511516
- DOI: 10.3389/fmicb.2020.02081
Cross-Stress Adaptation in a Piezophilic and Hyperthermophilic Archaeon From Deep Sea Hydrothermal Vent
Abstract
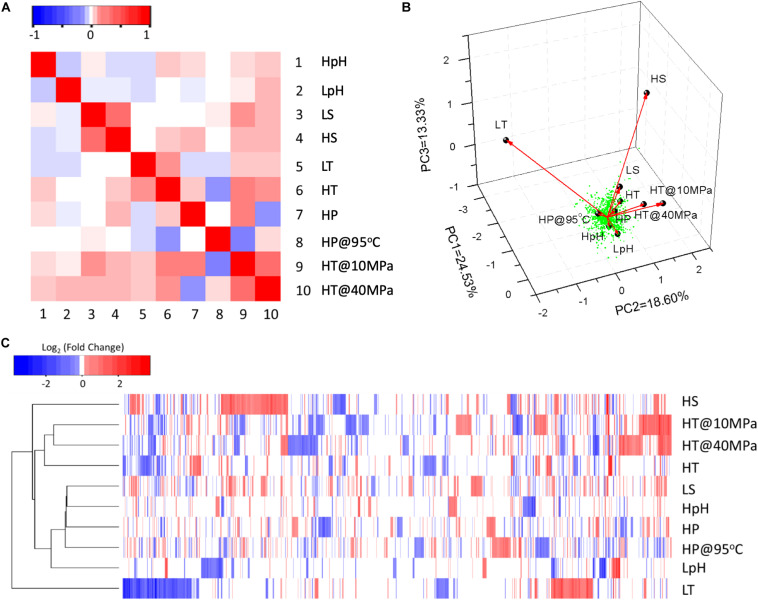
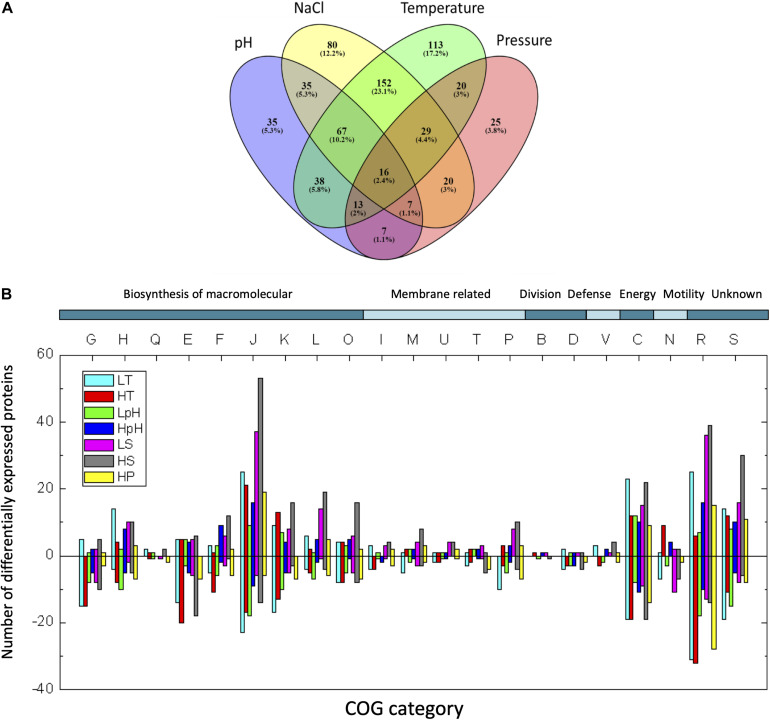
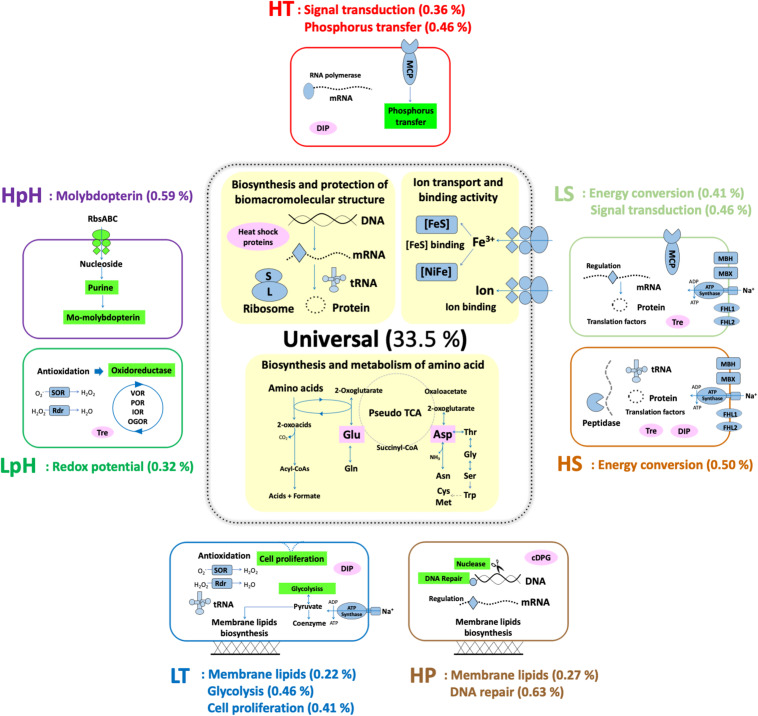
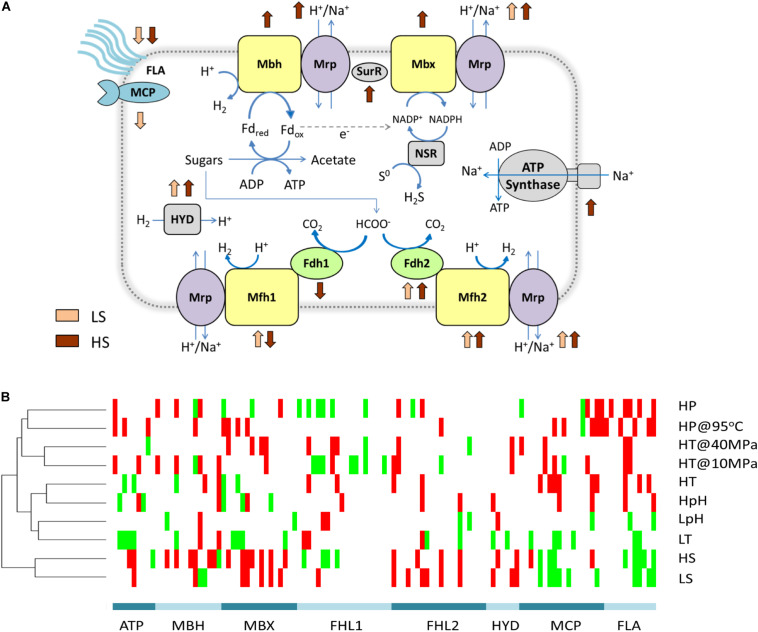
Hyperthermophiles, living in environments above 80°C and usually coupling with multi-extreme environmental stresses, have drawn great attention due to their application potential in biotechnology and being the primitive extant forms of life. Studies on their survival and adaptation mechanisms have extended our understanding on how lives thrive under extreme conditions. During these studies, the "cross-stress" behavior in various organisms has been observed between the extreme high temperature and other environmental stresses. Despite the broad observation, the global view of the cross-stress behavior remains unclear in hyperthermophiles, leaving a knowledge gap in our understanding of extreme adaptation. In this study, we performed a global quantitative proteomic analysis under extreme temperatures, pH, hydrostatic pressure (HP), and salinity on an archaeal strain, Thermococcus eurythermalis A501, which has outstanding growth capability on a wide range of temperatures (50-100°C), pH (4-9), and HPs (0.1-70 MPa), but a narrow range of NaCl (1.0-5.0 %, w/v). The proteomic analysis (79.8% genome coverage) demonstrated that approximately 61.5% of the significant differentially expressed proteins (DEPs) responded to multiple stresses. The responses to most of the tested stresses were closely correlated, except the responses to high salinity and low temperature. The top three enriched universal responding processes include the biosynthesis and protection of macromolecules, biosynthesis and metabolism of amino acids, ion transport, and binding activities. In addition, this study also revealed that the specific dual-stress responding processes, such as the membrane lipids for both cold and HP stresses and the signal transduction for both hyperosmotic and heat stresses, as well as the sodium-dependent energetic processes might be the limiting factor of the growth range in salinity. The present study is the first to examine the global cross-stress responses in a piezophilic hyperthermophile at the proteomic level. Our findings provide direct evidences of the cross-stress adaptation strategy (33.5% of coding-genes) to multiple stresses and highlight the specific and unique responding processes (0.22-0.63% of coding genes for each) to extreme temperature, pH, salinity, and pressure, which are highly relevant to the fields of evolutionary biology as well as next generation industrial biotechnology (NGIB).
Keywords: archaea; cross-stress adaptation; extreme adaptation; extremophile; hyperthermophile; piezophile; proteomic analysis.
Copyright © 2020 Zhao, Ma, Liu, Jian, Zhang and Xiao.
Figures
Similar articles
-
Complete genome sequence of Thermococcus eurythermalis A501, a conditional piezophilic hyperthermophilic archaeon with a wide temperature range, isolated from an oil-immersed deep-sea hydrothermal chimney on Guaymas Basin.J Biotechnol. 2015 Jan 10;193:14-5. doi: 10.1016/j.jbiotec.2014.11.006. Epub 2014 Nov 14. J Biotechnol. 2015. PMID: 25444877
-
Induction of a Toxin-Antitoxin Gene Cassette under High Hydrostatic Pressure Enables Markerless Gene Disruption in the Hyperthermophilic Archaeon Pyrococcus yayanosii.Appl Environ Microbiol. 2019 Feb 6;85(4):e02662-18. doi: 10.1128/AEM.02662-18. Print 2019 Feb 15. Appl Environ Microbiol. 2019. PMID: 30504216 Free PMC article.
-
Thermococcus eurythermalis sp. nov., a conditional piezophilic, hyperthermophilic archaeon with a wide temperature range for growth, isolated from an oil-immersed chimney in the Guaymas Basin.Int J Syst Evol Microbiol. 2015 Jan;65(Pt 1):30-35. doi: 10.1099/ijs.0.067942-0. Epub 2014 Oct 6. Int J Syst Evol Microbiol. 2015. PMID: 25288278
-
Stress genes and proteins in the archaea.Microbiol Mol Biol Rev. 1999 Dec;63(4):923-67, table of contents. doi: 10.1128/MMBR.63.4.923-967.1999. Microbiol Mol Biol Rev. 1999. PMID: 10585970 Free PMC article. Review.
-
Proteins from hyperthermophiles: stability and enzymatic catalysis close to the boiling point of water.Adv Biochem Eng Biotechnol. 1998;61:37-85. doi: 10.1007/BFb0102289. Adv Biochem Eng Biotechnol. 1998. PMID: 9670797 Review.
Cited by
-
Unexpectedly high mutation rate of a deep-sea hyperthermophilic anaerobic archaeon.ISME J. 2021 Jun;15(6):1862-1869. doi: 10.1038/s41396-020-00888-5. Epub 2021 Jan 15. ISME J. 2021. PMID: 33452477 Free PMC article.
References
-
- Amend J. P., McCollom T. M. (2010). Energetics of biomolecule synthesis on early earth. ACS Symp. Ser. 1025 63–94. 10.1021/bk-2009-1025.ch004 - DOI
LinkOut - more resources
Full Text Sources
Molecular Biology Databases
Research Materials
Miscellaneous