. 2020 Sep 8:11:564579.
doi: 10.3389/fmicb.2020.564579. eCollection 2020.

Differential Gut Microbiota and Fecal Metabolites Related With the Clinical Subtypes of Myasthenia Gravis

Affiliations

Differential Gut Microbiota and Fecal Metabolites Related With the Clinical Subtypes of Myasthenia Gravis

Xunmin Tan et al. Front Microbiol. .

Abstract

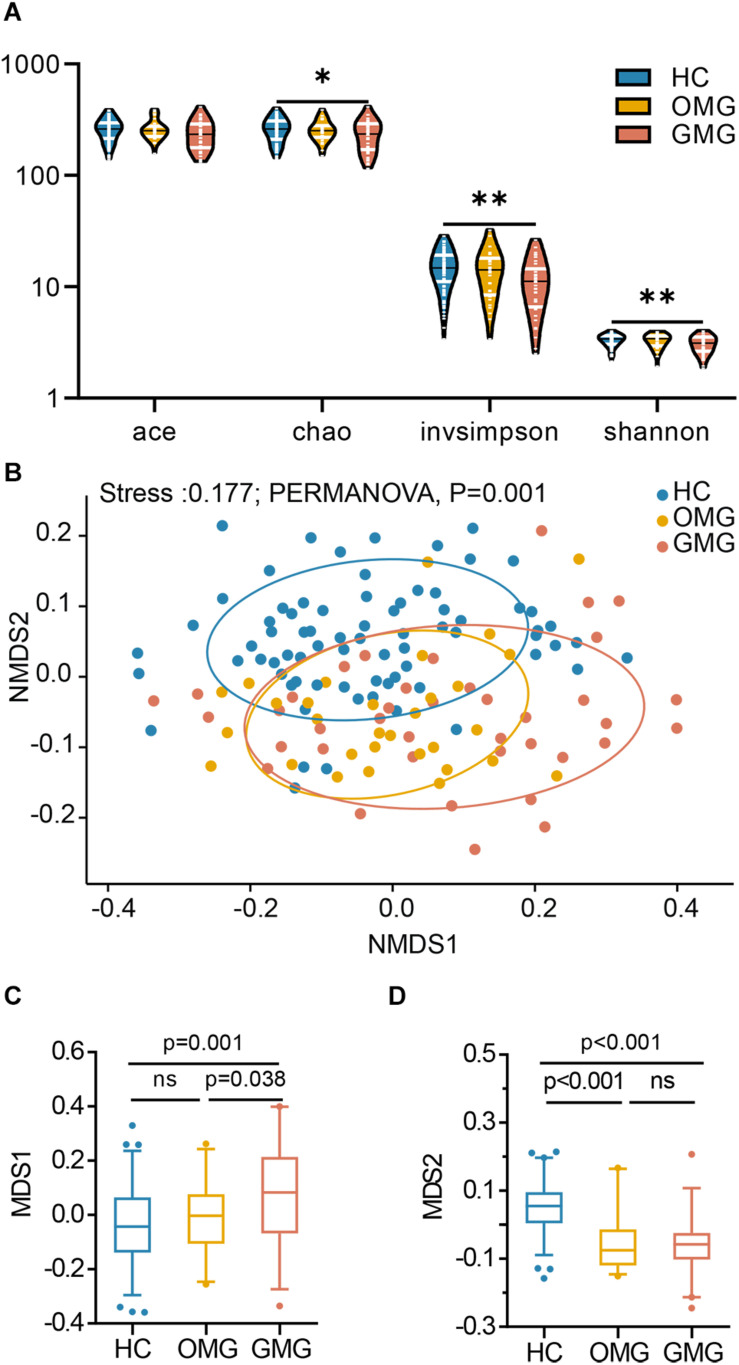
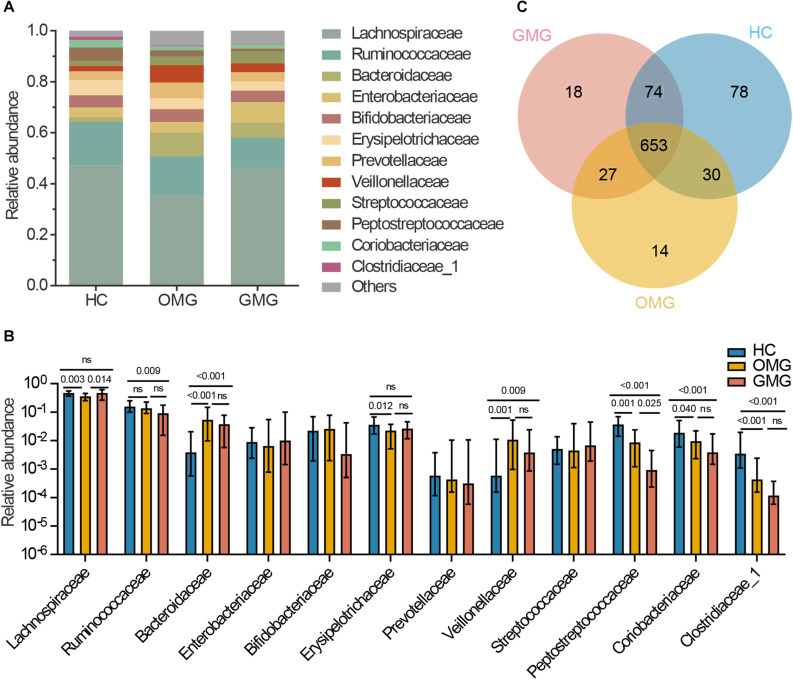
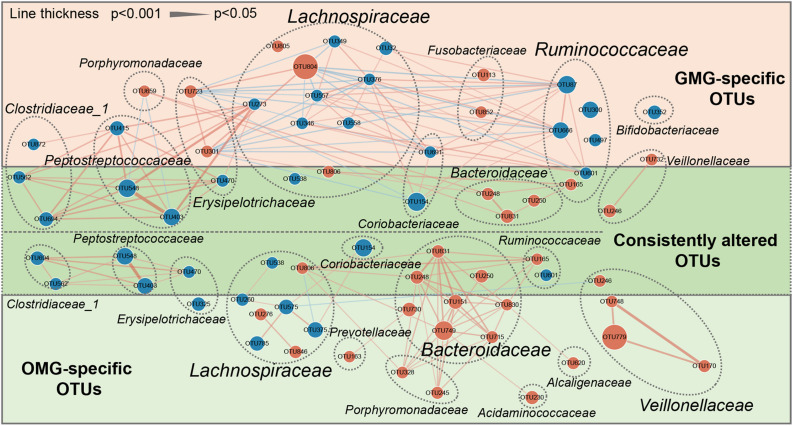
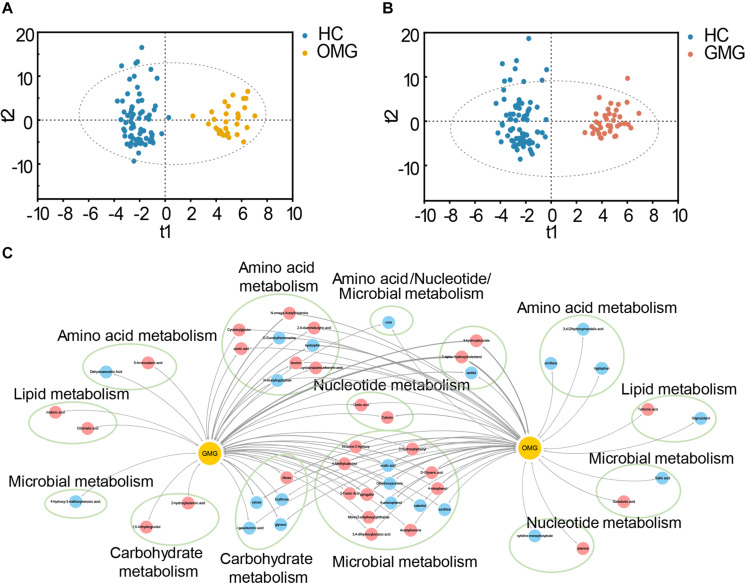
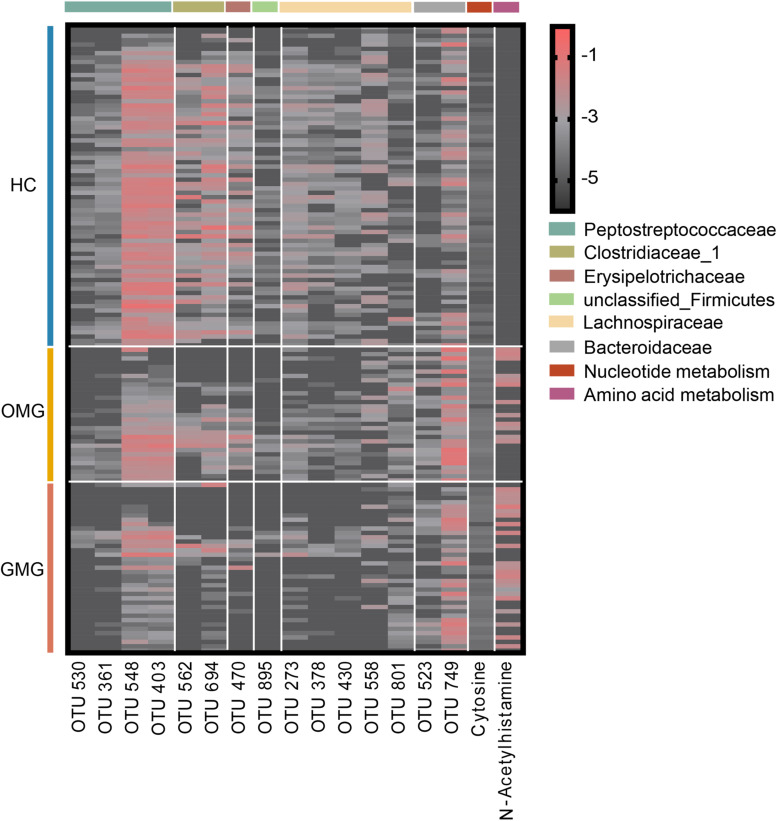
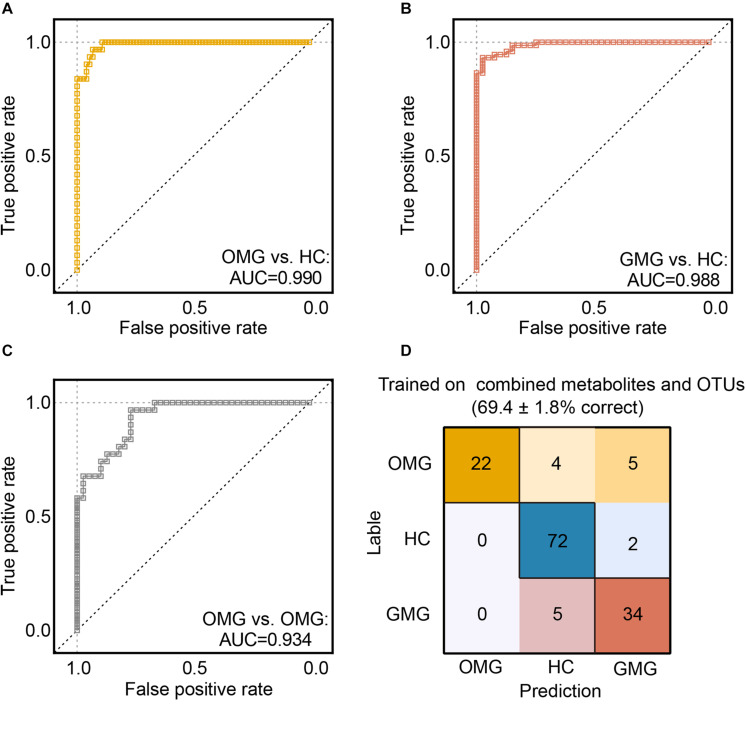
Myasthenia gravis (MG) is a devastating acquired autoimmune disease. Previous studies have observed that disturbances of gut microbiome may attribute to the development of MG through fecal metabolomic signatures in humans. However, whether there were differential gut microbial and fecal metabolomic phenotypes in different subtypes of MG remains unclear. Here, our objective was to explore whether the microbial and metabolic signatures of ocular (OMG) and generalized myasthenia gravis (GMG) were different, and further identify the shared and distinct markers for patients with OMG and GMG. In this study, 16S ribosomal RNA (rRNA) gene sequencing and gas chromatography-mass spectrometry (GC/MS) were performed to capture the microbial and metabolic signatures of OMG and GMG, respectively. Random forest (RF) classifiers was used to identify the discriminative markers for OMG and GMG. Compared with healthy control (HC) group, GMG group, but not OMG group, showed a significant decrease in α-phylogenetic diversity. Both OMG and GMG groups, however, displayed significant gut microbial and metabolic disorders. Totally, we identified 20 OTUs and 9 metabolites specific to OMG group, and 23 OTUs and 7 metabolites specific to GMG group. Moreover, combinatorial biomarkers containing 15 discriminative OTUs and 2 differential metabolites were capable of discriminating OMG and GMG from each other, as well as from HCs, with AUC values ranging from 0.934 to 0.990. In conclusion, different subtypes of MG harbored differential gut microbiota, which generated discriminative fecal metabolism.

Keywords: biomarker panels; clinical subtypes; gut microbiota; metabolome; myasthenia gravis.


Figures

FIGURE 1
FIGURE 1
Differential gut microbial characteristics among the GMG, OMG, and HC groups. (A) α-phylogenetic analysis revealed that the generalized myasthenia gravis group (GMG, n = 39), but not the ocular myasthenia gravis group (OMG, n = 31), was characterized by lower bacterial richness (chao, p = 0.011 by one way ANOVA) and diversity (invsimpson, p = 0.003 by one way ANOVA and Shannon, p = 0.007 by the Kruskal–Wallis test) than the healthy control group (HC, n = 74). (B) NMDS analysis displayed a striking segregation among OMG, GMG and HCs at OUT level (Stress, 0.177; PERMANOVA, p = 0.001). (C) In the NMDS1, GMG subjects were statistically distinguished from OMG subjects and HCs. (D) In the NMDS2, both OMG and GMG were statistically distinguished from HCs (multiple comparisons, one-way ANOVA). Abbreviation: NMDS, non-metric multidimensional scaling.
FIGURE 2
FIGURE 2
Comparison of the gut microbial composition among the three groups at family and OTU levels. (A) The community bar plot illustrated that the gut microbiome was mainly composed of 12 families. (B) Families Lachnospiraceae and Erysipelotrichaceae were significantly decreased in OMG group versus HCs, and the relative abundance of Lachnospiraceae in OMG group was also lower than that in GMG group. In addition, Ruminococcaceae was significantly depleted in GMG group versus HCs. Compared to HC group, Peptostreptococcaceae, Coriobacteriaceae and Clostridiaceae_1 were depleted, while Bacteroidaceae and Veillonellaceae were enriched in both OMG and GMG subjects. Moreover, the relative abundance of Peptostreptococcaceae in GMG was lower than that in OMG group. (C) A venn diagram demonstrated that 653 of 894 OTUs were discovered among the three groups, whereas 14, 18 and 78 OTUs were specific to OMG (yellow circle), GMG (red circle) and HCs (blue circle), respectively. (Each value represents median with interquartile range, p-values were determined by the Kruskal–Wallis test).
FIGURE 3
FIGURE 3
A co-occurrence network inferred from the relative abundances of differential OTUs associated with OMG or GMG. The discriminative OTUs related to OMG or GMG were identified based on LDA ≥ 2.5 and fold change > 2.0. Totally, 71 discriminative OTUs were identified between OMG or GMG and HCs. Among them, 14 of 71 OTUs were identically changed in both OMG and GMG groups versus HC group (dark green area), whereas most of OTUs were specific to OMG (20/34) (light green area) or GMG alone (23/37) (pink area). Compared with HC, OMG-specific OTUs were mainly assigned to the families Lachnospiraceae (6 OTUs), Bacteroidaceae (5 OTUs) and Veillonellaceae (3 OTUs), while GMG-specific OTUs were mainly assigned to the families Lachnospiraceae (9 OTUs) and Ruminococcaceae (4 OTUs). Size of the dots indicates the relative abundance of the OTUs. Red dots represent enriched OTUs in OMG or GMG group relative to HC group; blue dots represent depleted OTUs in OMG or GMG group relative to HC group. OTUs annotated to family level were profiled. Edges between dots represent Spearman’s correlation <- 0.45 (light blue), or >0.45 (light red), edges thickness indicate p-value (p < 0.05).
FIGURE 4
FIGURE 4
Metabolic characteristics of two subtypes of MG. (A,B) The orthogonal partial least-squares discriminant analysis (OPLS-DA) scores plots exhibited a clear separation between the OMG (orange dots, A) or GMG (red dots, B) subjects and HCs (blue dots). (C) The shared and distinct fecal metabolites detected in OMG and GMG subjects versus HCs. These differential metabolites mainly belonged to microbial metabolism, amino acid metabolism, carbohydrate metabolism, lipid metabolism and nucleotide metabolism. Red nodes indicate upregulated metabolites, while blue nodes indicate downregulated metabolites in MG subjects related to HCs. The thickness represents p-value (p < 0.05).
FIGURE 5
FIGURE 5
Combinatorial microbiota and metabolite biomarkers for discriminating GMG, OMG, and HC groups. Via linear discriminant analysis (LEfSe), 15 discriminative OTUs responsible for discrimination among the three groups were identified based on LDA score > 2.5. These discriminative OTUs mainly belonged to the families Lachnospiraceae (5 OTUs), Peptostreptococcaceae (4 OTUs), Clostridiaceae_1 (2 OTUs) and Bacteroidaceae (2 OTUs). Meanwhile, based on VIP > 1.0, p < 0.05 and FDR < 0.1, cytosine and n-acetylhistamine were significantly different among OMG, GMG and HC.
FIGURE 6
FIGURE 6
Predicting MG subtypes based on gut microbial and metabolic markers. (A–C) We trained random forest (RF) classifiers on discriminative fecal metabolites and microbial OTUs to identify MG subtypes. Receiver operating characteristic (ROC) curves showed that this combinatorial biomarker panel including 15 discriminative OTUs and 2 discriminative fecal metabolites enabled discriminating OMG and GMG from each other, as well as from HCs, with high diagnostic accuracy (OMG vs HC, AUC = 0.990; GMG vs HC, AUC = 0.988; OMG vs GMG, AUC = 0.934). (D) “Confusion matrix” evaluations of MG subtype RF classifiers. The number in row i and column j indicated how many samples were labeled as subtype i but assigned to subtype j. A perfect subtype RF classifier (100% accuracy) would have 0 counts for all non-diagonal entries (that is, no misclassified samples). Matrix cells were shaded within-row in proportion to their value (yellow, OMG; red, GMG; blue, HCs). Accuracy values indicated the fraction of correctly classified instances; error values reflect the s.e.m of a proportion. Consequently, the plot also showed that this combinatorial biomarker panel was capable of predicting OMG, GMG or HCs correctly 69.4 ± 1.8% of the time.

References

    1. Apinyawasisuk S., Chongpison Y., Jariyakosol S., Thitisaksakul C. (2019). Factors affecting generalization of ocular myasthenia gravis in patients with positive acetylcholine receptor antibody. Am. J. Ophthalmol. 209 10–17. 10.1016/j.ajo.2019.10.020 - DOI - PubMed
    1. Benatar M. (2006). A systematic review of diagnostic studies in myasthenia gravis. Neuromuscul. Disord. 16 459–467. 10.1016/j.nmd.2006.05.006 - DOI - PubMed
    1. Blackmore D., Li L., Wang N., Maksymowych W., Yacyshyn E., Siddiqi Z. A. (2020). Metabolomic profile overlap in prototypical autoimmune humoral disease: a comparison of myasthenia gravis and rheumatoid arthritis. Metabolomics 16:10. 10.1007/s11306-019-1625-z - DOI - PubMed
    1. Blankenberg D., Von Kuster G., Coraor N., Ananda G., Lazarus R., Mangan M., et al. (2010). Galaxy: a web-based genome analysis tool for experimentalists. Curr. Protoc. Mol. Biol. Chapter 19 Unit 19.10.1–19.10.21. 10.1002/0471142727.mb1910s89 - DOI - PMC - PubMed
    1. Blumberg R., Powrie F. (2012). Microbiota, disease, and back to health: a metastable journey. Sci. Transl. Med. 4:137rv137. 10.1126/scitranslmed.3004184 - DOI - PMC - PubMed