. 2020 Sep 2:11:1911.
doi: 10.3389/fimmu.2020.01911. eCollection 2020.

Quantification of Factor H Mediated Self vs. Non-self Discrimination by Mathematical Modeling

Affiliations

Quantification of Factor H Mediated Self vs. Non-self Discrimination by Mathematical Modeling

Alexander Tille et al. Front Immunol. .

Abstract

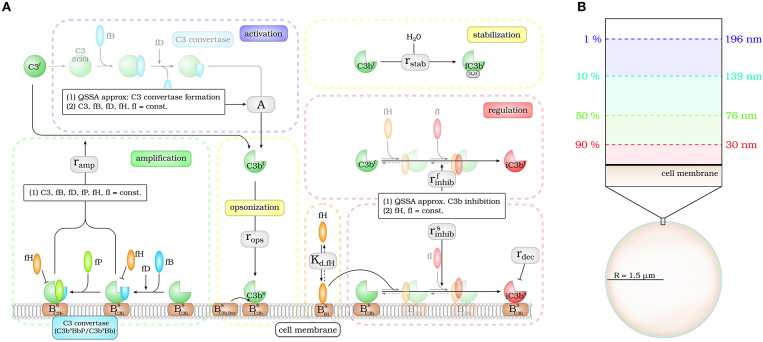
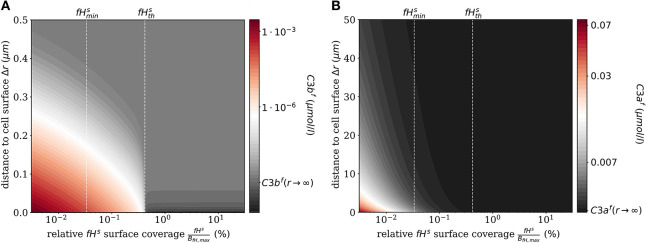
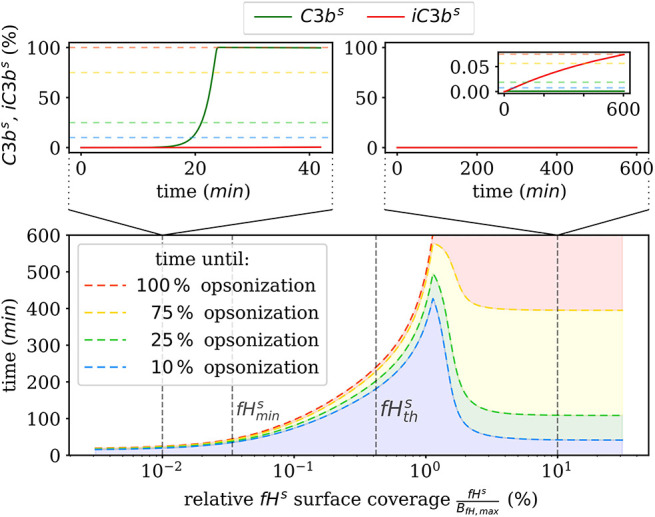
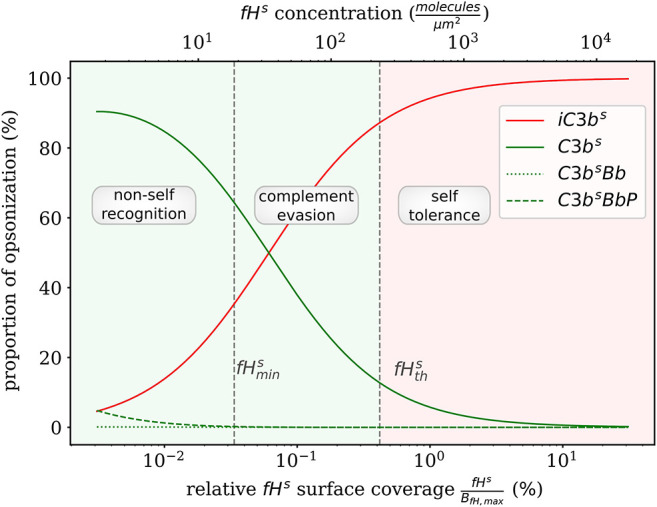
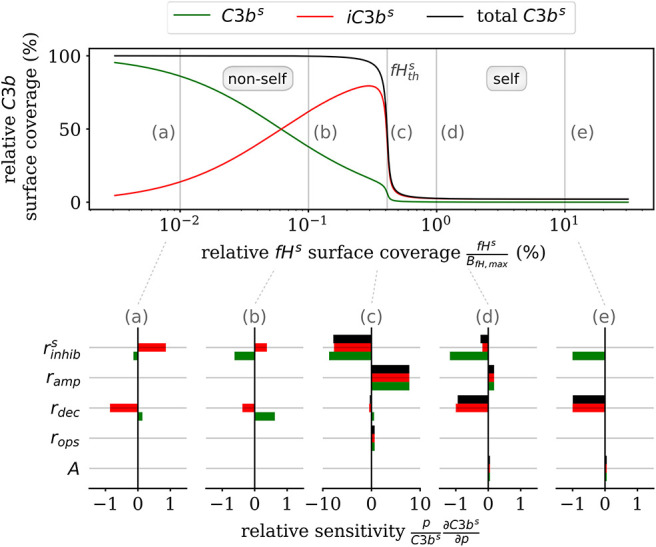
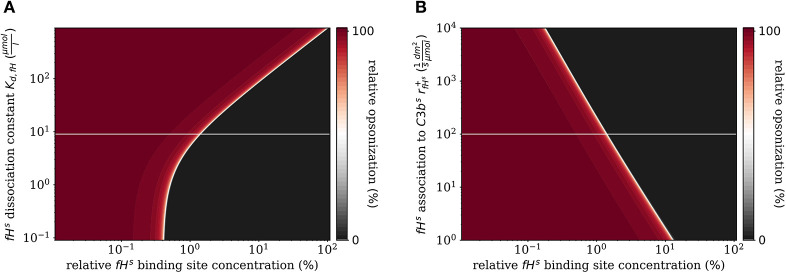
The complement system is part of the innate immune system and plays an important role in the host defense against infectious pathogens. One of the main effects is the opsonization of foreign invaders and subsequent uptake by phagocytosis. Due to the continuous default basal level of active complement molecules, a tight regulation is required to protect the body's own cells (self cells) from opsonization and from complement damage. A major complement regulator is Factor H, which is recruited from the fluid phase and attaches to cell surfaces where it effectively controls complement activation. Besides self cells, pathogens also have the ability to bind Factor H; they can thus escape opsonization and phagocytosis causing severe infections. In order to advance our understanding of the opsonization process at a quantitative level, we developed a mathematical model for the dynamics of the complement system-termed DynaCoSys model-that is based on ordinary differential equations for cell surface-bound molecules and on partial differential equations for concentration profiles of the fluid phase molecules in the environment of cells. This hybrid differential equation approach allows to model the complement cascade focusing on the role of active C3b in the fluid phase and on the cell surface as well as on its inactivation on the cell surface. The DynaCoSys model enables us to quantitatively predict the conditions under which Factor H mediated complement evasion occurs. Furthermore, investigating the quantitative impact of model parameters by a sensitivity analysis, we identify the driving processes of complement activation and regulation in both the self and non-self regime. The two regimes are defined by a critical Factor H concentration on the cell surface and we use the model to investigate the differential impact of complement model parameters on this threshold value. The dynamic modeling on the surface of pathogens are further relevant to understand pathophysiological situations where Factor H mutants and defective Factor H binding to target surfaces results in pathophysiology such as renal and retinal disease. In the future, this DynaCoSys model will be extended to also enable evaluating treatment strategies of complement-related diseases.

Keywords: complement regulator factor H; complement system; hybrid differential equation approach; immune evasion; mathematical modeling; non-self recognition; self-tolerance.


Figures

Figure 1
Figure 1
Hybrid differential equation model of the complement system. Complement activation can be divided into five parts: (i) activation, (ii) opsonization, (iii) stabilization, (iv) amplification, and (v) regulation. (A) The model focuses on the dynamics of the central component C3b: Active C3b in the fluid phase, C3bf, results from cleavage of precursor molecule C3f. The interaction of the fluid phase molecule C3bf with the cell surface is modeled by the interaction with free surface binding sites BC3b,frees and binding sites BC3bs that are occupied with molecules C3bs on the surface. C3bf that does not bind to the cell surface gets inactivated via a Factor H mediated inhibition process, or gets stabilized by water molecules and is no longer able to bind to the cell surface. Surface-bound C3bs can form C3-convertase molecules—C3bsBb and C3bsBbP–that cleave C3f molecules to C3bf molecules in the vicinity of the cell surface. C3bs can be inactivated via an inhibition process that is mediated by surface-bound Factor H, whose concentration depends on the concentration of binding sites on the cell surface BfH,maxs. (B) The lifetime of active C3bf is short such that, depending on the distance from the cell surface, the fraction of molecules that reach the cell surface is small; for example, only 1% at a distance of 196 nm within a simple decay model.
Figure 2
Figure 2
Steady states of the molecules C3bf and C3af in the fluid phase for varying surface-bound Factor H concentrations. (A) Radial steady state concentration profile of the fluid-phase C3bf concentration. (B) Radial steady state concentration profile of the fluid-phase C3af concentration. Mind the different scales in (A,B).
Figure 3
Figure 3
Summary of the numerical integration of 1,000 simulations for varied fHs concentrations. The time intervals indicate how much time passes until a certain amount of C3bs is attached to the cell surface. Two typical molecular concentration dynamics are shown for small fHs concentrations (top left) and high fHs concentrations (top right).
Figure 4
Figure 4
Proportion of C3b molecules at the cell surface. Based on the dominating types of C3b molecules, we distinguish the two extreme regimes for non-self recognition and self-tolerance that are separated by a transition regime where complement evasion takes place.
Figure 5
Figure 5
Sensitivity analysis of the model parameters for the steady state of surface-bound C3b molecules. The upper plot shows the relative concentration of complement molecules on the cell surface. The lower plots for selected Factor H concentrations give the relative local sensitivity of the complement molecules with respect to a parameter p that is individually varied. Positive sensitivities correlate with increasing molecule concentration. The non-self regime is sensitive to the rates rdec and rinhibs (see a,b). The transition region (c) is dominated by rinhibs and ramp and the self-regime is dominated by the parameters A, rdec, rinhibs, and ramp (see d,e).
Figure 6
Figure 6
Relative opsonization in the steady state for varied system parameters as a function of the relative Factor H binding site concentration. The white line indicates the DynaCoSys model for standard parameter values. (A) Variation of the spontaneous C3bf activation A, (B) variation of the fHf concentration, (C) variation of the fBf concentration, and (D) variation of the relative concentration of complement molecules in the fluid phase.
Figure 7
Figure 7
Relative opsonization in the steady state for varied system parameters as a function of the relative Factor H binding site concentration. The white line indicates the DynaCoSys model for standard parameter values. (A) Variation of the dissociation constant for Factor H and binding sites on the cell surface. (B) Variation of the reaction rate for fHs binding to C3bs molecules.

References

    1. Walport MJ. Complement. First of two parts. N Engl J Med. (2001) 344:1058–66. 10.1056/NEJM200104053441406 - DOI - PubMed
    1. Lachmann PJ. The amplification loop of the complement pathways. In: Alt FW, editor. Advances in Immunology. San Diego, CA: Elsevier; (2009) 4, 115–49. 10.1016/S0065-2776(08)04004-2 - DOI - PubMed
    1. Zipfel PF, Skerka C. Complement regulators and inhibitory proteins. Nat Rev Immunol. (2009) 9:729–40. 10.1038/nri2620 - DOI - PubMed
    1. Flaherty D. editor. Complement. In: Immunology for Pharmacy. Saint Louis, MO: Mosby; (2012). p. 87–96. 10.1016/B978-0-323-06947-2.10011-2 - DOI
    1. Merle NS, Church SE, Fremeaux-Bacchi V, Roumenina LT. Complement system part I - molecular mechanisms of activation and regulation. Front Immunol. (2015) 6:262. 10.3389/fimmu.2015.00262 - DOI - PMC - PubMed

Publication types