. 2020 Sep 4:11:1934.
doi: 10.3389/fimmu.2020.01934. eCollection 2020.

Mechanisms of M2 Macrophage-Derived Exosomal Long Non-coding RNA PVT1 in Regulating Th17 Cell Response in Experimental Autoimmune Encephalomyelitisa

Affiliations

Mechanisms of M2 Macrophage-Derived Exosomal Long Non-coding RNA PVT1 in Regulating Th17 Cell Response in Experimental Autoimmune Encephalomyelitisa

Lei Wu et al. Front Immunol. .

Retraction in

Abstract

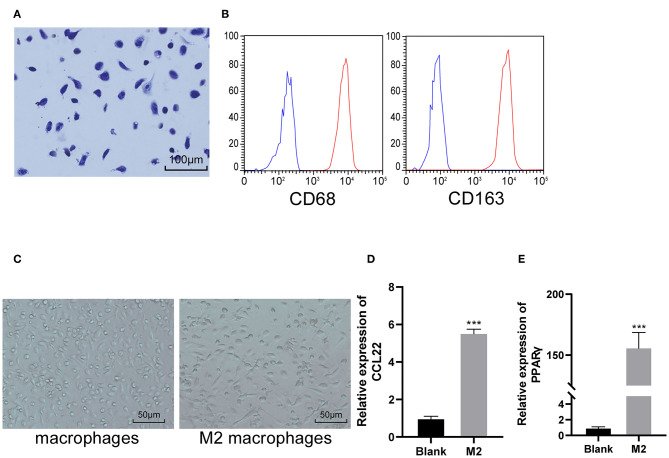
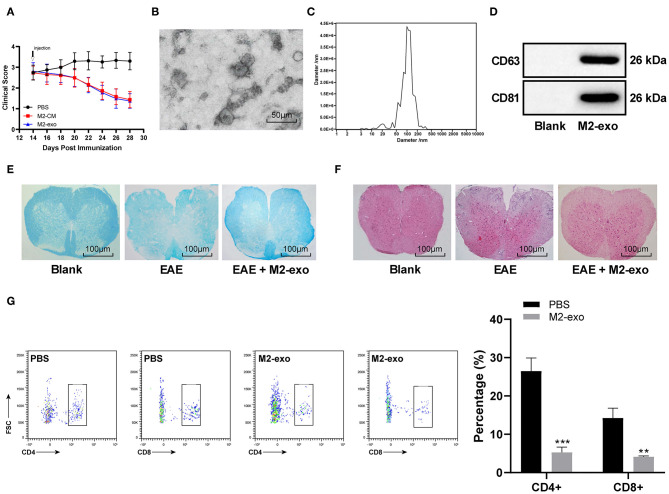
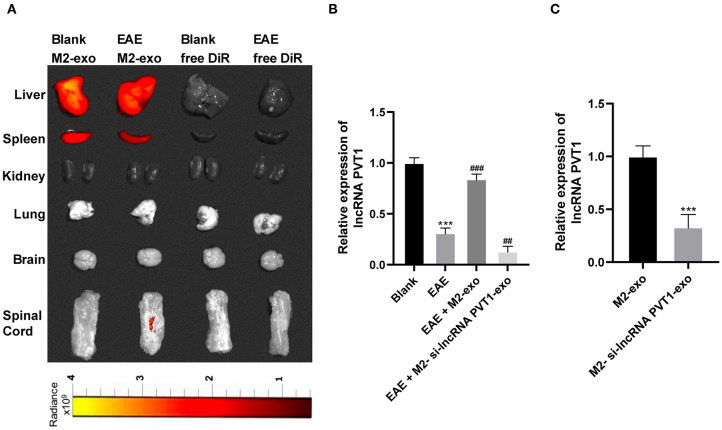
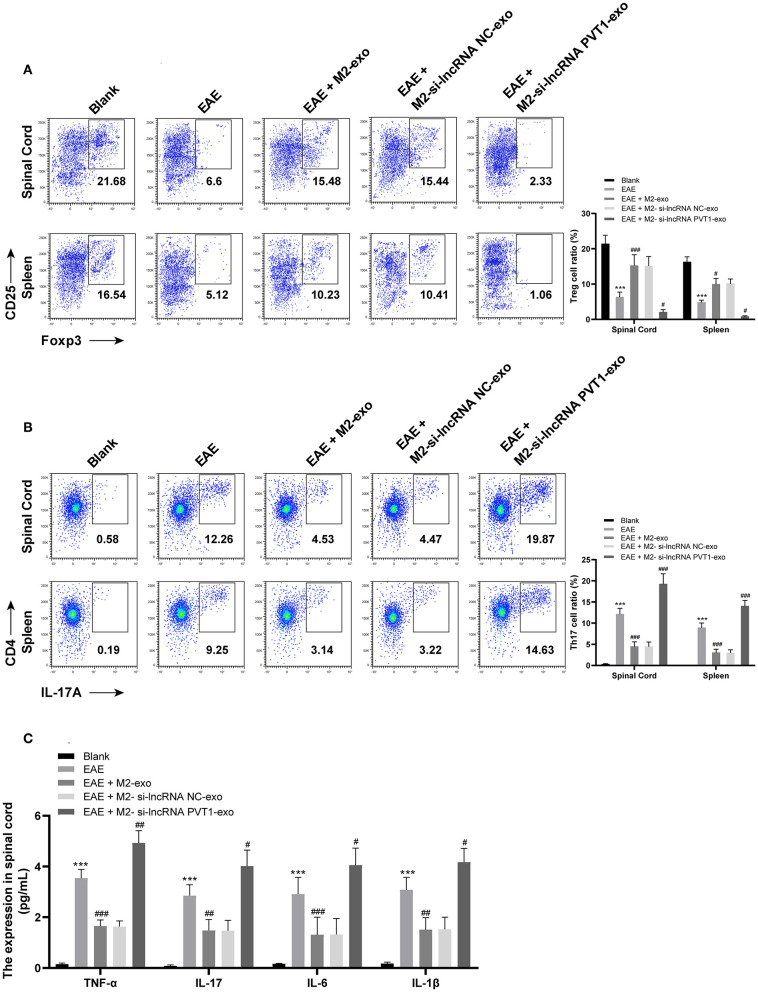
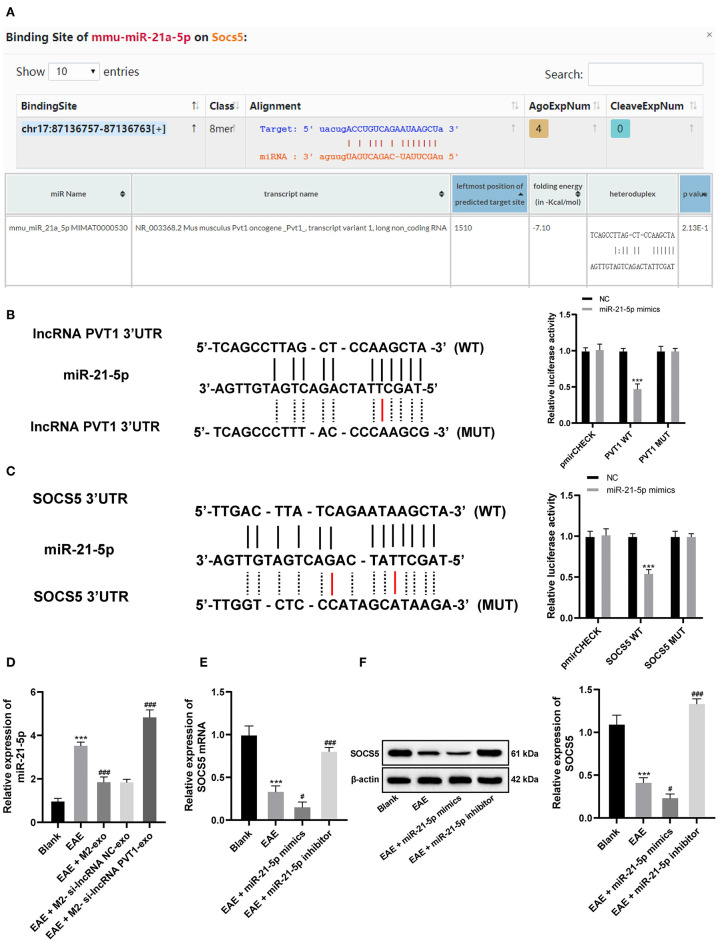
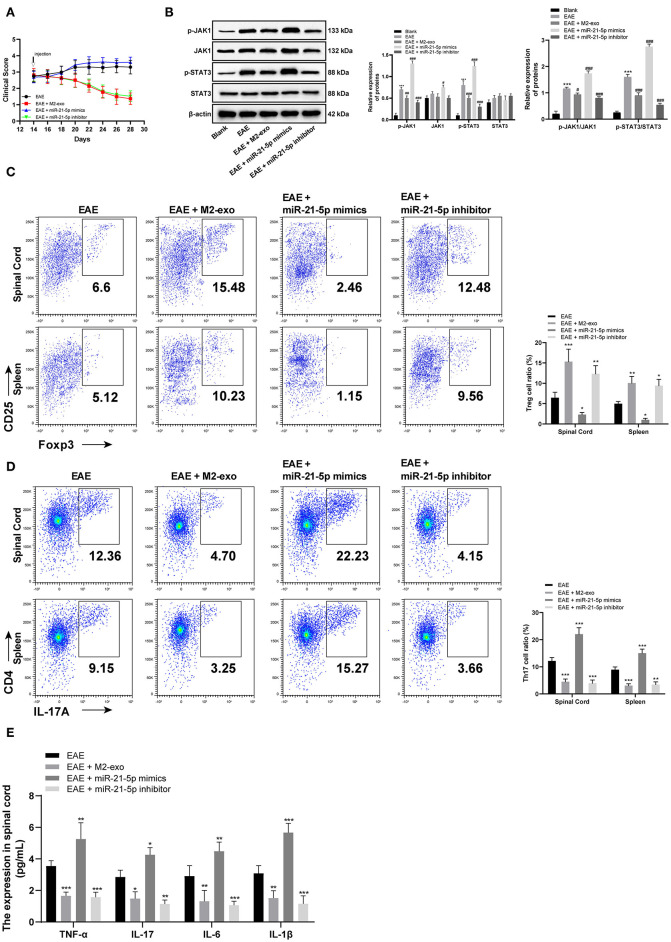
Long non-coding RNA (lncRNA) is pivotal for multiple sclerosis (MS), but the potential mechanism of lncRNA PVT1 in MS animal model, experimental autoimmune encephalomyelitis (EAE) still remains unclear. In this study, macrophages were firstly isolated and induced to polarize into M2 macrophages. M2 macrophage-derived exosomes (M2-exos) were extracted and identified, and EAE mouse model was established and treated with M2-exos. The effect of M2-exos on EAE mice was evaluated by clinical scores. The proportion of Treg and Th17 cells in spinal cord cells and splenocytes, and levels of inflammatory factors were measured. The targeting relationships among PVT1, miR-21-5p, and SOCS5 were verified. The expression of JAKs/STAT3 pathway-related proteins was measured. After M2-exo treatment, the clinical score of EAE mice decreased, and demyelination and inflammatory infiltration improved; Th17 cells decreased, Treg cells increased, and the levels of inflammatory factors decreased significantly. SOCS5 and PVT1 were downregulated and miR-21-5p was upregulated in EAE mice. PVT1 could sponge miR-21-5p to regulate SOCS5. SOCS5 alleviated EAE symptoms by repressing the JAKs/STAT3 pathway. Together, M2-exos-carried lncRNA PVT1 sponged miR-21-5p to upregulate SOCS5 and inactivate the JAKs/STAT3 pathway, thus reducing inflammation and protecting EAE mice. This study may offer novel treatments for MS.

Keywords: M2 macrophages; SOCS5; exosomes; experimental autoimmune encephalomyelitis; long non-coding RNA PVT1; microRNA-21-5p.


Figures

Figure 1
Figure 1
M2 macrophages are successfully induced and obtained. (A) Representative image of macrophage morphology detected by Wright's staining; (B) The macrophage specific molecular markers CD68 and CD163 were positive detected by flow cytometry; (C) Representative images of the morphology of macrophage and M2 macrophage under an optical microscope; (D,E) RT-qPCR was used to detect the typical polarization molecules CCL22 and PPARγ. vs. the blank group, ***p < 0.001. Data were analyzed with the t-test. Repetitions = 3.
Figure 2
Figure 2
M2-exos protect EAE mice. (A) Clinical score of EAE mice treated with PBS, M2-CM, or M2-exo; (B) Observation of the morphology and size of M2-exos by TEM; (C) Exosome concentration and particle size by Nanosight Tracking Analysis; (D) Detection of exosome markers CD63, CD81, and TSG101 by western blot analysis; (E) Detection of demyelination in spinal cord sections using LFB staining; (F) Pathological examination of spinal cord sections in mice detected by HE staining; (G) T cell infiltration into the spinal cord of EAE mice detected with flow cytometry. Compared with the PBS group, **p < 0.01, ***p < 0.001. Data are analyzed with two-way ANOVA, and Tukey's multiple comparisons test was utilized for post hoc test n = 6.
Figure 3
Figure 3
LncRNA PVT1 enters EAE mice from M2-exos. (A) DiR labeled exosomes were traced in mice. It showed that exosomes mainly existed in liver and spleen 24 h after they entered the mice. Fluorescence also appeared in spinal cord of EAE mice; (B,C) Relative PVT1 expression in spinal cord of EAE mice with different treatment detected by RT-qPCR. Compared with the blank group, ***p < 0.001; compared with the EAE group, ##p < 0.01, ###p < 0.001. Data in (B) are analyzed with one-way ANOVA, and Tukey's multiple comparisons test was utilized for post hoc test. Data in (C) were analyzed by the t-test n = 6.
Figure 4
Figure 4
LncRNA PVT1 inhibits the proinflammatory response induced by Th17 cells in EAE mice. (A,B) Detection of Treg and Th17 cells in spinal cord cells and splenocytes by flow cytometry; (C) Detection of inflammatory factors in spinal cord cells by ELISA. Compared with the blank group, ***p < 0.001; compared with the EAE group, #p < 0.05, ##p < 0.01, ###p < 0.001. Data are analyzed with two-way ANOVA, and Tukey's multiple comparisons test was utilized for post hoc test n = 6.
Figure 5
Figure 5
LncRNA PVT1 competitively binds to miR-21-5p and upregulates SOCS5 expression in EAE mice. (A) Database (http://starbase.sysu.edu.cn, https://cm.jefferson.edu/rna22/Interactive/) analysis of binding relationship between lncRNA PVT1 and miR-21-5p, together with miR-21-5p, and SOCS5; (B,C) Targeting relationship between lncRNA PVT1 and miR-21-5p, together with miR-21-5p, and SOCS5 detected by dual-luciferase reporter gene assay, compared with the NC group, ***p < 0.001; (D) Relative miR-21-5p expression in spinal cord of EAE mice with different treatment detected by RT-qPCR; (E,F) mRNA and protein levels of SOCS5 in spinal cord of EAE mice with different treatment detected by RT-qPCR and western blot analysis. Compared with the blank group, ***p < 0.001; compared with the EAE group, #p < 0.05, ###p < 0.001. Data in (D–F) are analyzed with one-way ANOVA, in (B,C) are and analyzed with two-way ANOVA, Tukey's multiple comparisons test was utilized for post hoc test n = 6.
Figure 6
Figure 6
SOCS5 alleviates EAE symptoms by inhibiting pro-inflammatory response of Th17 cells through the JAKs/STAT3 pathway. (A) Clinical scores of EAE mice with different treatment; (B) Levels of JAKs/STAT3 pathway-related proteins and their phosphorylation levels in EAE mice detected by western blot analysis; vs. the blank group, ***p < 0.001; compared with the EAE group, #p < 0.05, ##p < 0.01, ###p < 0.001; (C,D) Detection of Treg and Th17 cells in spinal cord cells and splenocytes by flow cytometry; compared with the EAE group, *p < 0.05, **p < 0.01, ***p < 0.001; (E) Detection of inflammatory factors in spinal cord cells by ELISA; compared with the EAE group, *p < 0.05, **p < 0.01, ***p < 0.001. Data are analyzed with two-way ANOVA, and Tukey's multiple comparisons test was utilized for post hoc test n = 6.

Similar articles

Cited by

References

    1. Murphy AC, Lalor SJ, Lynch MA, Mills KH. Infiltration of Th1 and Th17 cells and activation of microglia in the CNS during the course of experimental autoimmune encephalomyelitis. Brain Behav Immun. (2010) 24:641–51. 10.1016/j.bbi.2010.01.014 - DOI - PubMed
    1. Constantinescu CS, Farooqi N, O'Brien K, Gran B. Experimental autoimmune encephalomyelitis (EAE) as a model for multiple sclerosis (MS). Br J Pharmacol. (2011) 164:1079–106. 10.1111/j.1476-5381.2011.01302.x - DOI - PMC - PubMed
    1. Gu C. KIR4.1: K(+) Channel illusion or reality in the autoimmune pathogenesis of multiple sclerosis. Front Mol Neurosci. (2016) 9:90. 10.3389/fnmol.2016.00090 - DOI - PMC - PubMed
    1. Robinson AP, Harp CT, Noronha A, Miller SD. The experimental autoimmune encephalomyelitis (EAE) model of MS: utility for understanding disease pathophysiology and treatment. Handb Clin Neurol. (2014) 122:173–89. 10.1016/B978-0-444-52001-2.00008-X - DOI - PMC - PubMed
    1. McFarland HF, Martin R. Multiple sclerosis: a complicated picture of autoimmunity. Nat Immunol. (2007) 8:913–9. 10.1038/ni1507 - DOI - PubMed

Publication types

MeSH terms