. 2020 Aug 18:11:2063.
doi: 10.3389/fimmu.2020.02063. eCollection 2020.

Excessive Neutrophils and Neutrophil Extracellular Traps in COVID-19

Affiliations

Excessive Neutrophils and Neutrophil Extracellular Traps in COVID-19

Jun Wang et al. Front Immunol. .

Abstract

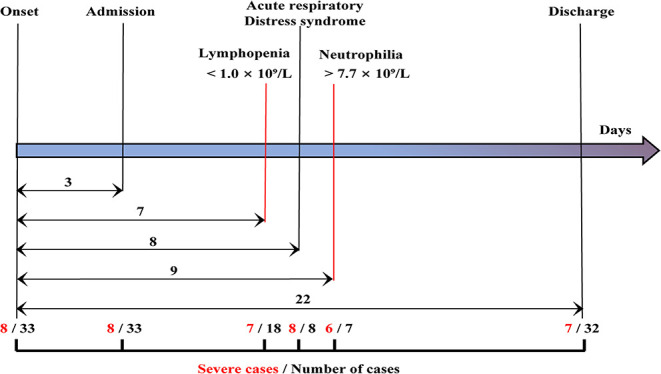
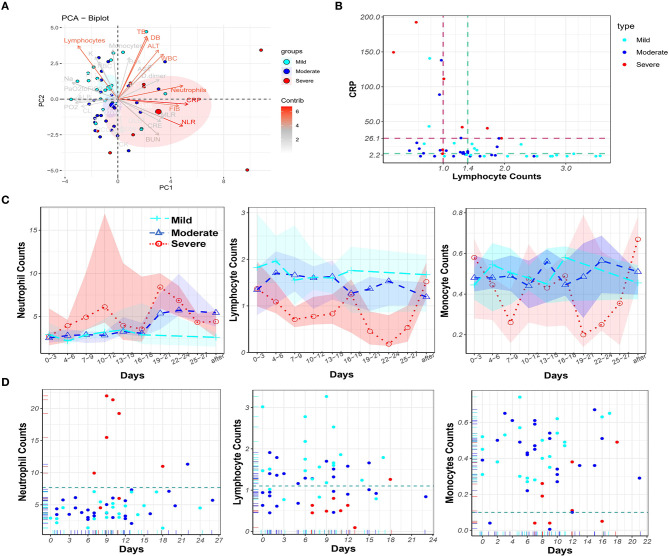
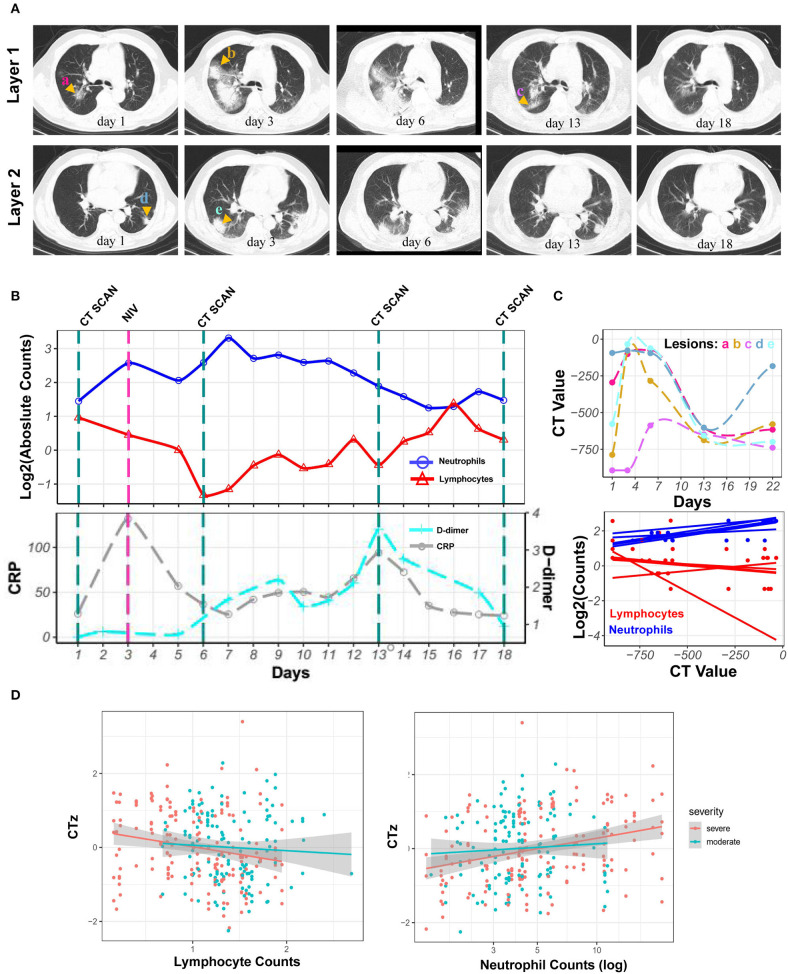
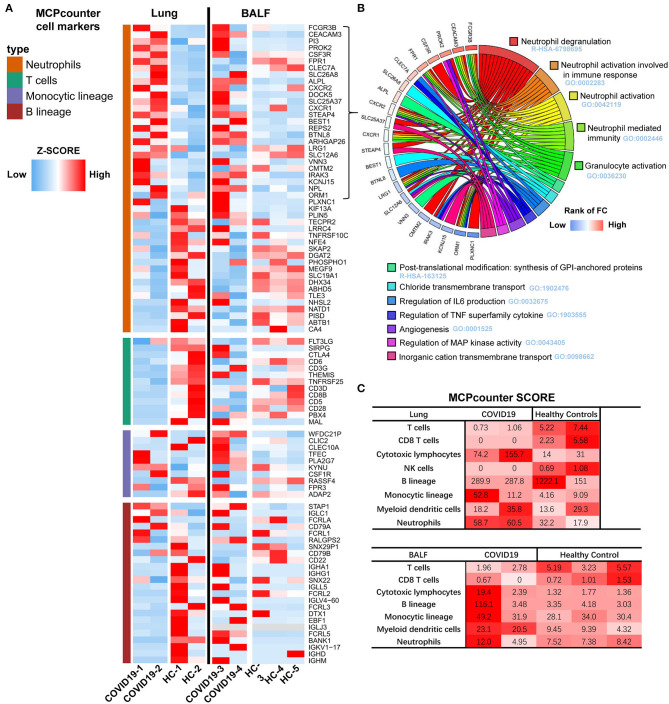
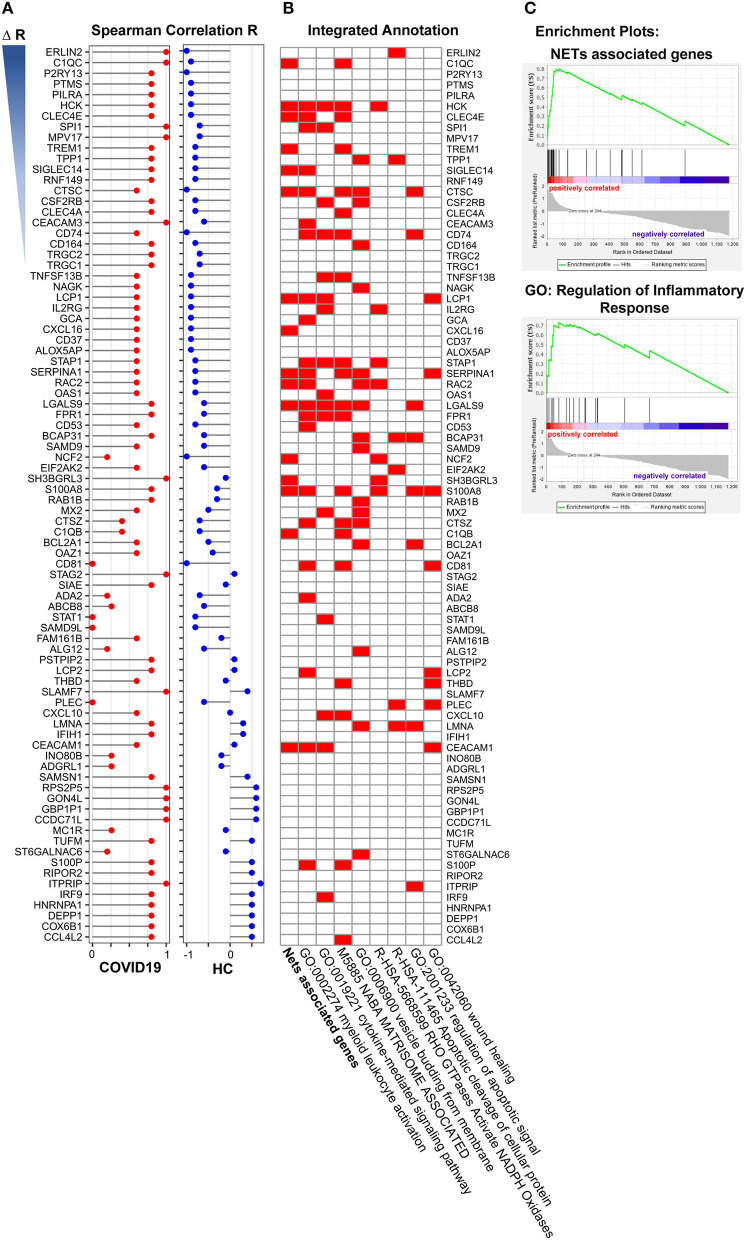
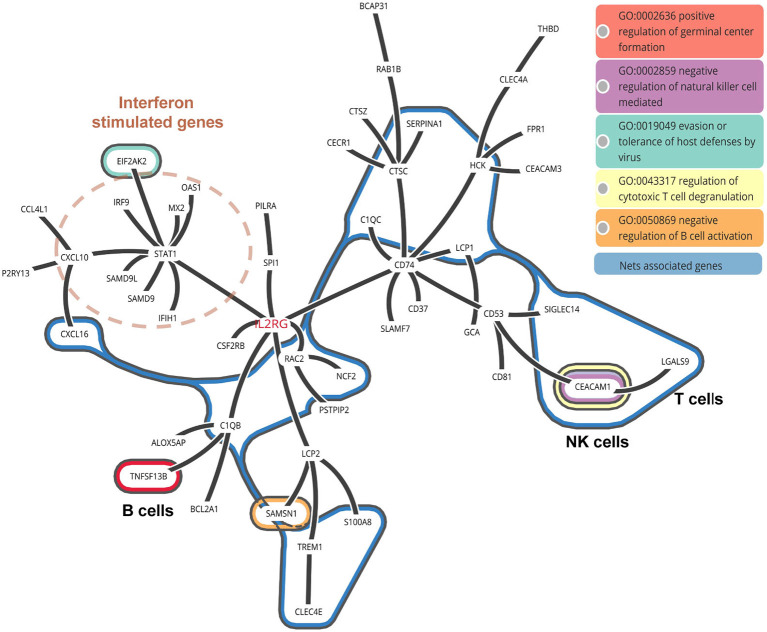
Background: Cases of excessive neutrophil counts in the blood in severe coronavirus disease (COVID-19) patients have drawn significant attention. Neutrophil infiltration was also noted on the pathological findings from autopsies. It is urgent to clarify the pathogenesis of neutrophils leading to severe pneumonia in COVID-19. Methods: A retrospective analysis was performed on 55 COVID-19 patients classified as mild (n = 22), moderate (n = 25), and severe (n = 8) according to the Guidelines released by the National Health Commission of China. Trends relating leukocyte counts and lungs examined by chest CT scan were quantified by Bayesian inference. Transcriptional signatures of host immune cells of four COVID19 patients were analyzed by RNA sequencing of lung specimens and BALF. Results: Neutrophilia occurred in 6 of 8 severe patients at 7-19 days after symptom onset, coinciding with lesion progression. Increasing neutrophil counts paralleled lesion CT values (slope: 0.8 and 0.3-1.2), reflecting neutrophilia-induced lung injury in severe patients. Transcriptome analysis revealed that neutrophil activation was correlated with 17 neutrophil extracellular trap (NET)-associated genes in COVID-19 patients, which was related to innate immunity and interacted with T/NK/B cells, as supported by a protein-protein interaction network analysis. Conclusion: Excessive neutrophils and associated NETs could explain the pathogenesis of lung injury in COVID-19 pneumonia.

Keywords: COVID-19; coronavirus; lymphopenia; neutrophil extracellular trap; neutrophilia; pneumonia.


Figures

Figure 1
Figure 1
Clinical courses of the study patients. The time lines showed the days of hospital admission, lymphopenia, acute respiratory distress syndrome, neutrophilia, and discharge from symptom onset for each case. The median time from onset of symptoms to hospital admission and discharge was 3, 22 days, respectively. Among the 33 patients (black), eight cases were severe cases (red). A total of 18 cases exhibited lymphopenia within 7 days, including seven severe patients. All eight patients presented with acute respiratory distress syndrome within 8 days. Seven cases presented with neutrophilia, including six severe cases within 9 days.
Figure 2
Figure 2
Principal component analysis of laboratory parameters and dynamic monitoring of blood cells in the peripheral blood of COVID-19 patients. (A) Principal component analysis to identify variables for distinguishing the disease severity of COVID-19 patients. The nine variables that contributed mostly to distinguishing the disease severity were white blood cell counts (WBC), neutrophil counts, neutrophil-to-lymphocyte ratio (NLR), C-reactive protein (CRP), FIB, ALT, Total Bilirubin (TB), Direct Bilirubin (DB), and lymphocyte counts. (B) CRP levels and lymphocyte counts in 55 cases with the cut-off values CRP = 26.1 and lymphocyte = 1.0 for eight severe cases (brown) and the cut-off values CRP = 4.3 and lymphocyte = 1.4 for 22 mild cases (green). (C) The dynamic change of neutrophil, lymphocyte and monocyte counts over time in COVID-19 patients in mild (cyan), moderate (blue), and severe (red) groups, circled dots: mean value; colored background area: IQR (interval quartile range). The (D) Time points of maximum neutrophil, minimum lymphocyte, and minimum monocyte counts, and the corresponding counts in mild (cyan), moderate (blue), and severe (red) COVID-19 patients during hospitalization.
Figure 3
Figure 3
Kinetics of laboratory parameters and serial chest CT images of severe COVID-19 patient with the development of neutrophilia. (A) Normal chest CT with axial planes at indicated time point. (B) The dynamics of neutrophil counts (blue line), lymphocyte counts (red line) with log2 scaling, and CRP (gray line) and D-dimer (cyan line) levels at indicated time point. (C) CT value of lesions and its correlation with log2 scaled neutrophil and lymphocyte counts at indicated time point. (D) Least-square fits of linear models to summarize the z-values of CT values as a function of log-transformed neutrophil counts for 23 patients. Points are pairs of CTz values (z-values of individual CT measurements) and log-neutrophil counts, colored according to severity of COVID-19. Colored lines are the corresponding least-square fits to the data form each severity group. Gray areas are 95% confidence intervals.
Figure 4
Figure 4
Transcriptome analysis of the lung and BALF in COVID-19 patient. (A) Marker genes from Microenvironment Cell Populations-counter (MCP-counter) were used to identify of Neutrophils, T cells, Monocytes, and B cells in both Lung and BALF samples of COVID-19 patients and healthy controls, respectively. The RNA-seq data TPM are shown in a scaled heatmap. (B) Circle plots for functional enrichment analysis of 29 marker genes of Neutrophils. (C) The absolute abundance of immune cell subpopulations as scores in COVID-19 patients and healthy cases.
Figure 5
Figure 5
Gene enrichment analysis of neutrophil activation related genes. (A) The 15 annotated genes of neutrophils activation were calculated the average expression of every single samples as neutrophils activation score, and the correlation of the score with overlapped 1,363 differently expressed genes both in COVID-19 and Healthy control were analyzed. The selected 84 genes were ranked based on ΔR (R1-R2, R1 from COVID-19 patients, R2 from healthy control). (B) Functional enrichment analysis of these 84 genes, of which 16 genes were NETs associated genes. (C) Nets associated genes set (Enrichment Score, 0.80) and the GO term of regulation of inflammatory (Enrichment Score, 0.72) by GSEA with DEGs from pre-ranked by ΔR.
Figure 6
Figure 6
PPI network of NETs associated genes in COVID-19 patients. The interaction between NETs associated genes with other neutrophil activated genes.

Similar articles

Cited by

References

    1. WHO . Coronavirus Disease (COVID-2019) Situation Reports. Available online at: https://www.who.int/emergencies/diseases/novel-coronavirus-2019/situatio... (accessed March 30, 2020).
    1. WHO Clinical Management of Severe Acute Respiratory Infection When Novel Coronavirus (nCoV) Infection Is Suspected. Geneva: World Health Organization; (2020). Available online at: https://apps.who.int/iris/handle/10665/330893 (accessed January 28, 2020).
    1. Wang D, Hu B, Hu C. Clinical characteristics of 138 hospitalized patients with 2019 novel coronavirus–infected pneumonia in Wuhan, China. JAMA. (2020) 323: 1061–9. 10.1001/jama.2020.1585 - DOI - PMC - PubMed
    1. Mehta P, McAuley DF, Brown M, Sanchez E, Tattersall RS, Manson JJ, et al. . COVID-19: consider cytokine storm syndromes and immunosuppression. Lancet. (2020) 395:1033–4. 10.1016/S0140-6736(20)30628-0 - DOI - PMC - PubMed
    1. Fox SE, Akmatbekov A, Harbert JL, Li G, Brown JQ, Vander Heide RS. Pulmonary and cardiac pathology in Covid-19: the first autopsy series from New Orleans. Lancet Respir Med. (2020) 8:681–6. 10.1016/S2213-2600(20)30243-5 - DOI - PMC - PubMed

Publication types

MeSH terms

LinkOut - more resources