Randomized Controlled Trial
. 2020 Sep 8:11:2085.
doi: 10.3389/fimmu.2020.02085. eCollection 2020.

The Immunologic Effect of Early Intravenous Two and Four Gram Bolus Dosing of Tranexamic Acid Compared to Placebo in Patients With Severe Traumatic Bleeding (TAMPITI): A Randomized, Double-Blind, Placebo-Controlled, Single-Center Trial

Collaborators, Affiliations
Randomized Controlled Trial

The Immunologic Effect of Early Intravenous Two and Four Gram Bolus Dosing of Tranexamic Acid Compared to Placebo in Patients With Severe Traumatic Bleeding (TAMPITI): A Randomized, Double-Blind, Placebo-Controlled, Single-Center Trial

Philip C Spinella et al. Front Immunol. .

Abstract

Background: The hemostatic properties of tranexamic acid (TXA) are well described, but the immunological effects of TXA administration after traumatic injury have not been thoroughly examined. We hypothesized TXA would reduce monocyte activation in bleeding trauma patients with severe injury.

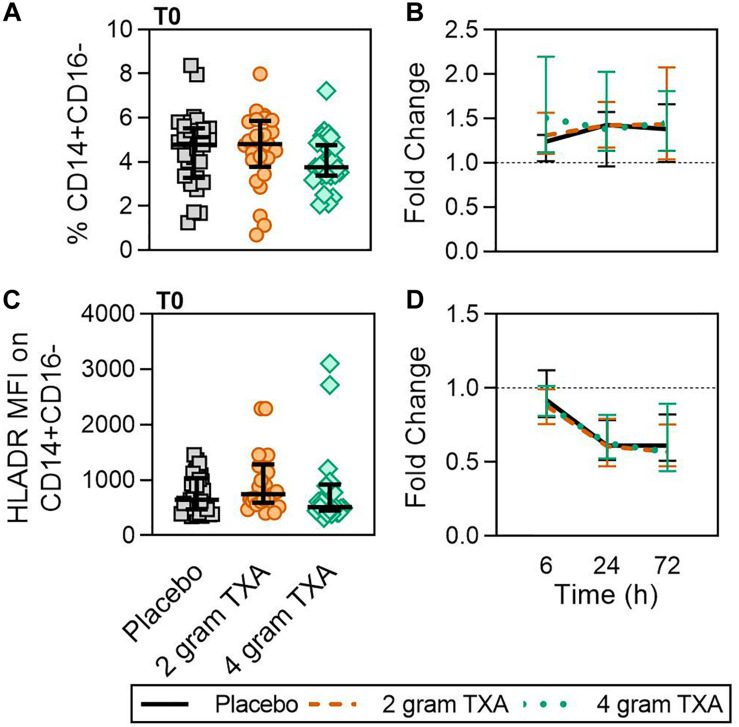
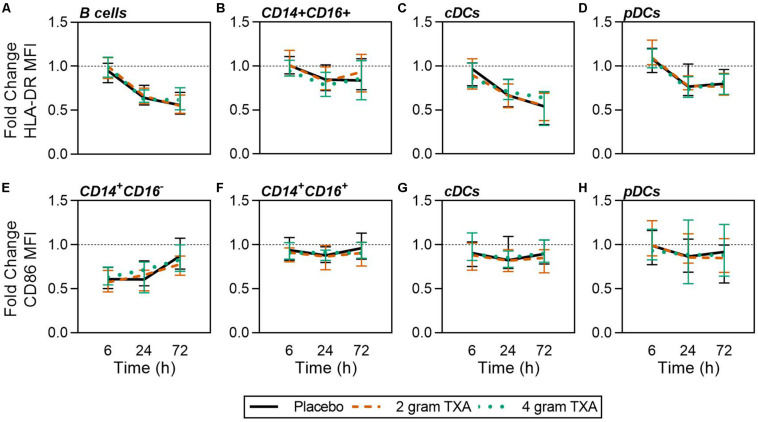
Methods: This was a single center, double-blinded, randomized controlled trial (RCT) comparing placebo to a 2 g or 4 g intravenous TXA bolus dose in trauma patients with severe injury. Fifty patients were randomized into each study group. The primary outcome was a reduction in monocyte activation as measured by human leukocyte antigen-DR isotype (HLA-DR) expression on monocytes 72 h after TXA administration. Secondary outcomes included kinetic assessment of immune and hemostatic phenotypes within the 72 h window post-TXA administration.

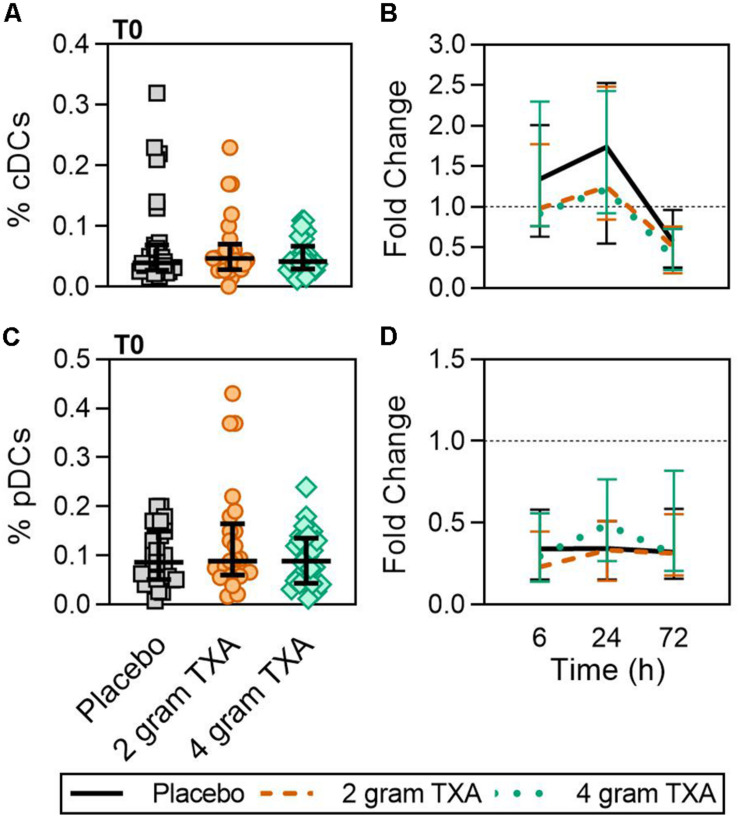
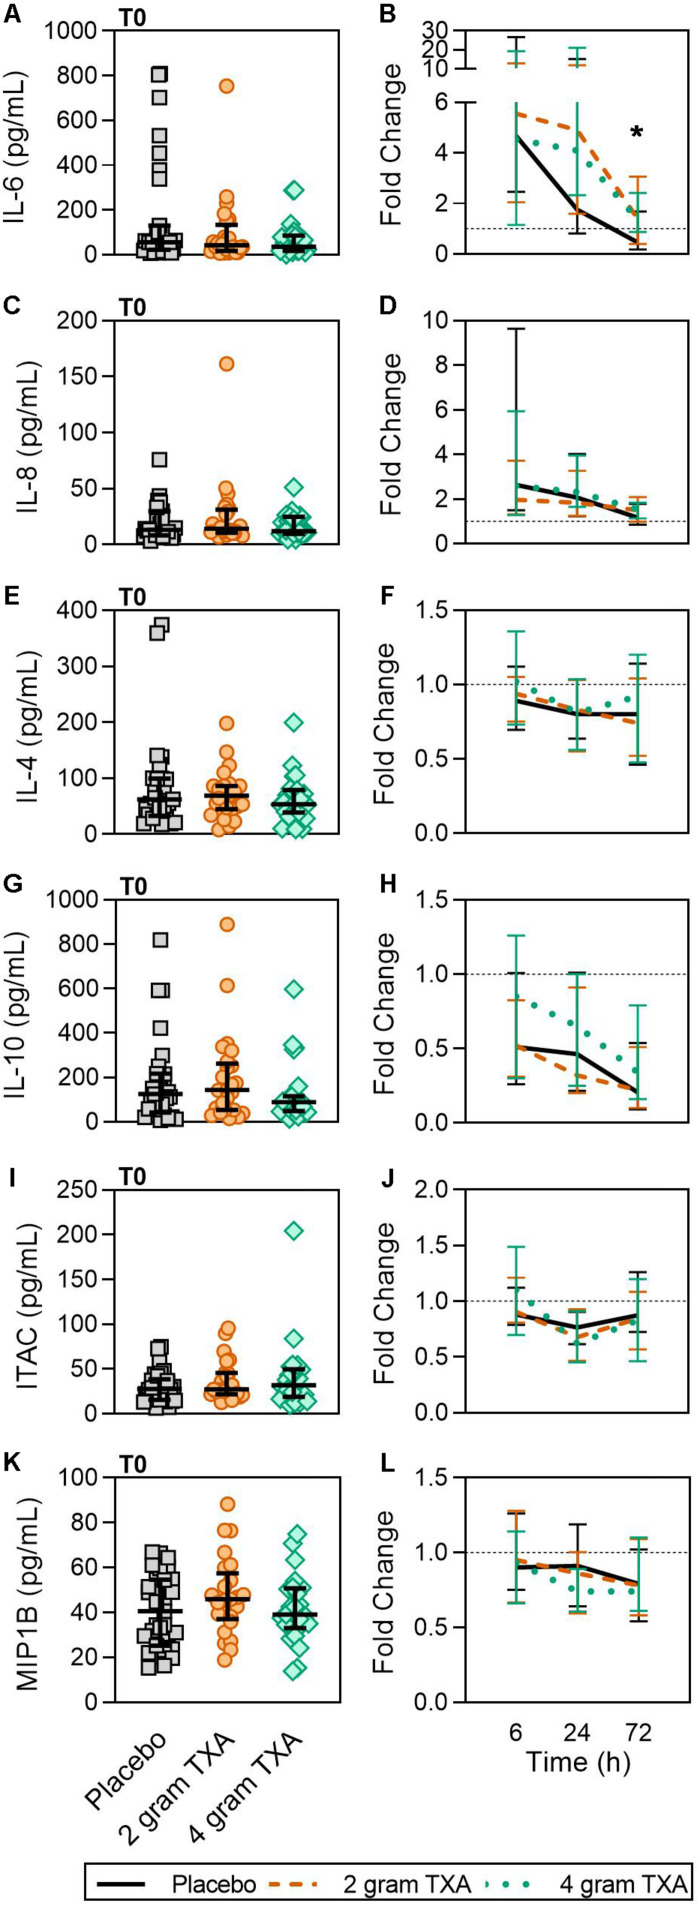
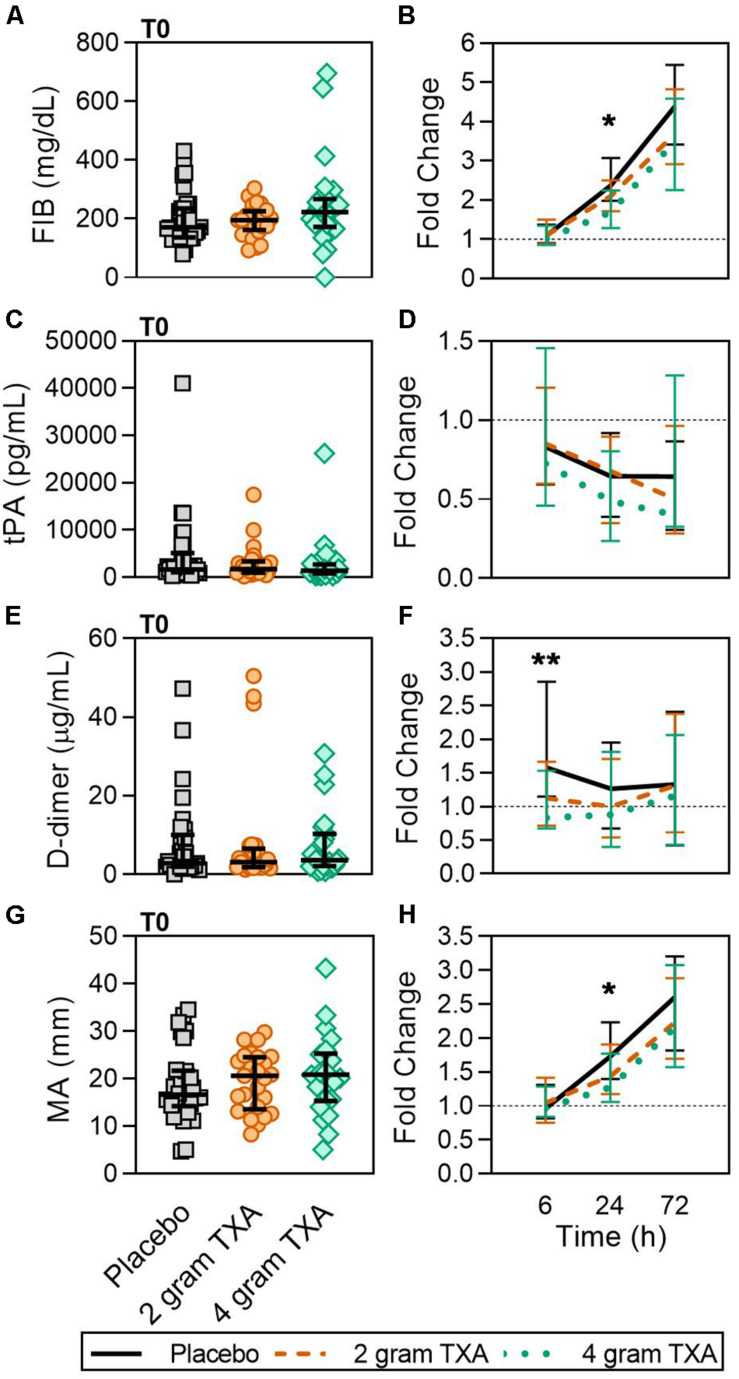
Results: The trial occurred between March 2016 and September 2017, when data collection ended. 149 patients were analyzed (placebo, n = 50; 2 g TXA, n = 49; 4 g TXA, n = 50). The fold change in HLA-DR expression on monocytes [reported as median (Q1-Q3)] from pre-TXA to 72 h post-TXA was similar between placebo [0.61 (0.51-0.82)], 2 g TXA [0.57 (0.47-0.75)], and 4 g TXA [0.57 (0.44-0.89)] study groups (p = 0.82). Neutrophil CD62L expression was reduced in the 4 g TXA group [fold change: 0.73 (0.63-0.97)] compared to the placebo group [0.97 (0.78-1.10)] at 24 h post-TXA (p = 0.034). The fold decrease in plasma IL-6 was significantly less in the 4 g TXA group [1.36 (0.87-2.42)] compared to the placebo group [0.46 (0.19-1.69)] at 72 h post-TXA (p = 0.028). There were no differences in frequencies of myeloid or lymphoid populations or in classical complement activation at any of the study time points.

Conclusion: In trauma patients with severe injury, 4 g intravenous bolus dosing of TXA has minimal immunomodulatory effects with respect to leukocyte phenotypes and circulating cytokine levels.

Clinical trial registration: www.ClinicalTrials.gov, identifier NCT02535949.

Keywords: hemostasis; immunology; monocyte activation; tranexamic acid; trauma.


Figures

FIGURE 1
FIGURE 1
TAMPITI Patient Screening, Enrollment, Randomization, and Analysis Diagram. This Consolidated Standards of Reporting Trials (CONSORT) diagram displays the number of patients screened for eligibility, excluded based on not meeting study inclusion criteria, patients enrolled and randomized, and the patients analyzed per study group.
FIGURE 2
FIGURE 2
TXA administration does not alter monocyte expression of HLA-DR. For all kinetic data, fold change was calculated as [(frequency/MFI/concentration of a given population/analyte at the given time | | T6,T24,T72| |) ÷ (frequency/MFI/concentration of the same population/analyte at T0)]. Data are displayed as line graphs (fold change, median + IQR). The dashed line placed at y = 1 represents T0, or baseline. Placebo, n = 29; 2 g TXA, n = 24; 4 g TXA, n = 25. Statistical differences between the 4 g TXA and placebo groups at each given time point, as calculated via Kruskal-Wallis, are noted as follows: p > 0.05, not significant and not denoted on the graphical representation. (A) The frequency of CD14+CD16 monocytes found in total peripheral blood leukocytes at T0 in all three treatment groups; data are represented as individual points with median + IQR for error bars. (B) Fold change in frequency of CD14+CD16 monocytes found in total peripheral blood leukocytes over the study period of 72 h. (C) HLA-DR MFI on CD14+CD16 monocytes in all three treatment groups at T0. (D) Fold change in HLA-DR MFI on CD14+CD16 monocytes over the study period of 72 h.
FIGURE 3
FIGURE 3
TXA administration does not alter neutrophil frequencies or phenotype. Placebo, n = 29; 2 g TXA, n = 24; 4 g TXA, n = 25. Statistical differences between the 4 g TXA and placebo groups at each given time point, as calculated via Kruskal-Wallis, are noted as follows: p < 0.05, *; p > 0.05, not significant and not denoted on the graphical representation. (A) The frequency of neutrophils found in total peripheral blood leukocytes at T0 in all three treatment groups; data are represented as individual points with median + IQR for error bars. (B) Fold change in neutrophil frequency over the study period of 72 h. (C) CD11B MFI on neutrophils in all three treatment groups at T0. (D) Fold change in CD11B MFI on neutrophils over the study period of 72 h. (E) CD11C MFI on neutrophils in all three treatment groups at T0. (F) Fold change in CD11C MFI on neutrophils over the study period of 72 h. (G) CD16 MFI on neutrophils in all three treatment groups at T0. (H) Fold change in CD16 MFI on neutrophils over the study period of 72 h. (I) CD66B MFI on neutrophils in all three treatment groups at T0. (J) Fold change in CD66B MFI on neutrophils over the study period of 72 h. (K) CD62L MFI on neutrophils in all three treatment groups at T0. (L) Fold change in CD62L MFI on neutrophils over the study period of 72 h.
FIGURE 4
FIGURE 4
Traumatic injury, not TXA, decreases circulating lymphoid populations. For T0, data are represented as individual points with median + IQR for error bars. For all kinetic data, fold change was calculated as [(frequency/MFI/concentration of a given population/analyte at the given time | | T6,T24,T72| |) ÷ (frequency/MFI/concentration of the same population/analyte at T0)]. Data are displayed as line graphs (fold change, median + IQR). The dashed line placed at y = 1 represents T0, or baseline. Placebo, n = 29; 2 g TXA, n = 24; 4 g TXA, n = 25. Statistical differences between the 4 g TXA and placebo groups at each given time point, as calculated via Kruskal–Wallis, are noted as follows: p > 0.05, not significant and not denoted on the graphical representation. (A) The frequency of CD4 + T cells found in total peripheral blood leukocytes at T0 in all three treatment groups. (B) Fold change in frequency of CD4 + T cells found in total peripheral blood leukocytes over the study period of 72 h. (C) The frequency of CD8 + T cells found in total peripheral blood leukocytes at T0 in all three treatment groups. (D) Fold change in frequency of CD8 + T cells found in total peripheral blood leukocytes over the study period of 72 h. (E) The frequency of NK cells found in total peripheral blood leukocytes at T0 in all three treatment groups. (F) Fold change in frequency of NK cells found in total peripheral blood leukocytes over the study period of 72 h. (G) The frequency of B cells found in total peripheral blood leukocytes at T0 in all three treatment groups. (H) Fold change in frequency of B cells found in total peripheral blood leukocytes over the study period of 72 h.
FIGURE 5
FIGURE 5
TXA administration does not alter conventional or plasmacytoid DC population changes in response to trauma. For T0, data are represented as individual points with median + IQR for error bars. For all kinetic data, fold change was calculated as [(frequency/MFI/concentration of a given population/analyte at the given time | | T6,T24,T72| |) ÷ (frequency/MFI/concentration of the same population/analyte at T0)]. Data are displayed as line graphs (fold change, median + IQR). The dashed line placed at y = 1 represents T0, or baseline. Placebo, n = 29; 2 g TXA, n = 24; 4 g TXA, n = 25. Statistical differences between the 4 g TXA and placebo groups at each given time point, as calculated via Kruskal-Wallis, are noted as follows: p > 0.05, not significant and not denoted on the graphical representation. (A) The frequency of conventional dendritic cells (cDCs) found in total peripheral blood leukocytes at T0 in all three treatment groups. (B) Fold change in frequency of cDCs found in total peripheral blood leukocytes over the study period of 72 h. (C) The frequency of plasmacytoid dendritic cells (pDCs) found in total peripheral blood leukocytes at T0 in all three treatment groups. (D) Fold change in frequency of pDCs found in total peripheral blood leukocytes over the study period of 72 h.
FIGURE 6
FIGURE 6
Global reduction in HLA-DR and not CD86 expression in response to traumatic injury. For all kinetic data, fold change was calculated as [(frequency/MFI/concentration of a given population/analyte at the given time | | T6,T24,T72| |) ÷ (frequency/MFI/concentration of the same population/analyte at T0)]. Data are displayed as line graphs (fold change, median + IQR). The dashed line placed at y = 1 represents T0, or baseline. Placebo, n = 29; 2 g TXA, n = 24; 4 g TXA, n = 25. Statistical differences between the 4 g TXA and placebo groups at each given time point, as calculated via Kruskal–Wallis, are noted as follows: p > 0.05, not significant and not denoted on the graphical representation. Fold change in HLA-DR MFI on (A) B cells, (B) CD14 + CD16 + non-classical monocytes, (C) cDCs, and (D) pDCs over the 72 h study period. Fold change in CD86 MFI on (E) CD14 + CD16- monocytes, (F) CD14 + CD16 + non-classical monocytes, (G) cDCs, and (H) pDCs over the 72 h study period.
FIGURE 7
FIGURE 7
TXA administration increases circulating levels of IL-6. For T0, data are represented as individual points with median + IQR for error bars. For all kinetic data, fold change was calculated as [(frequency/MFI/concentration of a given population/analyte at the given time | | T6,T24,T72| |) ÷ (frequency/MFI/concentration of the same population/analyte at T0)]. Data are displayed as line graphs (fold change, median + IQR). The dashed line placed at y = 1 represents T0, or baseline. Placebo, n = 29; 2 g TXA, n = 24; 4 g TXA, n = 25. Statistical differences between the 4 g TXA and placebo groups at each given time point, as calculated via Kruskal-Wallis, are noted as follows: p < 0.05, *; p > 0.05, not significant and not denoted on the graphical representation. (A) IL-6 levels at T0 in all three treatment groups. (B) Fold change in IL-6 levels over the study period of 72 h. (C) IL-8 levels at T0 in all three treatment groups. (D) Fold change in IL-8 levels over the study period of 72 h. (E) IL-4 levels at T0 in all three treatment groups. (F) Fold change in IL-4 levels over the study period of 72 h. (G) IL-10 levels at T0 in all three treatment groups. (H) Fold change in IL-10 levels over the study period of 72 h. (I) Interferon-inducible T-cell alpha chemoattractant (ITAC/CXCL11) levels at T0 in all three treatment groups. (J) Fold change in ITAC levels over the study period of 72 h. (K) MIP1B levels at T0 in all three treatment groups. (L) Fold change in MIP1B levels over the study period of 72 h.
FIGURE 8
FIGURE 8
A higher dose of TXA decreases circulating D-dimer levels early after administration. For T0, data are represented as individual points with median + IQR for error bars. For all kinetic data, fold change was calculated as [(frequency/MFI/concentration of a given population/analyte at the given time | | T6,T24,T72| |) ÷ (frequency/MFI/concentration of the same population/analyte at T0)]. Data are displayed as line graphs (fold change, median + IQR). The dashed line placed at y = 1 represents T0, or baseline. Placebo, n = 29; 2 g TXA, n = 24; 4 g TXA, n = 25. Statistical differences between the 4 g TXA and placebo groups at each given time point, as calculated via Kruskal-Wallis, are noted as follows: p < 0.01, **; p < 0.05, *; p > 0.05, not significant and not denoted on the graphical representation. (A) Fibrinogen (FIB, mg/dL) levels at T0 in all three treatment groups (placebo, n = 31; 2 g TXA, n = 25; 4 g TXA, n = 25). (B) Fold change in FIB levels over the study period of 72 h (placebo, n = 17; 2 g TXA, n = 13; 4 g TXA, n = 10). (C) Tissue plasminogen activator (tPA, pg/mL) levels at T0 in all three treatment groups (placebo, n = 31; 2 g TXA, n = 25; 4 g TXA, n = 25). (D) Fold change in tPA levels over the study period of 72 h (placebo, n = 28; 2 g TXA, n = 24; 4 g TXA, n = 20). (E) D-dimer (D-Di, μg/mL) levels at T0 in all three treatment groups (placebo, n = 31; 2 g TXA, n = 25; 4 g TXA, n = 25). (F) Fold change in D-Di levels over the study period of 72 h (placebo, n = 30; 2 g TXA, n = 25; 4 g TXA, n = 25). (G) Maximum amplitude (MA, mm) levels at T0 in all three treatment groups (placebo, n = 30; 2 g TXA, n = 25; 4 g TXA, n = 22). (H) Fold change in MA over the study period of 72 h (placebo, n = 30; 2 g TXA, n = 23; 4 g TXA, n = 19).
FIGURE 9
FIGURE 9
The effects of trauma, and not of TXA administration, impart the greatest impact on immune and hemostatic phenotypes in traumatically injured bleeding patients. (A) Correlation matrices at each time point for each study group were built using the variables listed in Supplementary Table S7. Positive correlation is denoted in blue, while a negative correlation is denoted in red. Principal component analysis (PCA) labeled by (B) sampling time point (“timepoint_event_type”; T0, T6, T24, and T72; n = 283), (C) treatment group (“txa_group”; Placebo, 2 g TXA, 4 g TXA; n = 283), or (D) at a given time point by treatment group. For PCA, confidence ellipses are set at 95%.

Similar articles

Cited by

References

    1. Rhee P, Joseph B, Pandit V, Aziz H, Vercruysse G, Kulvatunyou N, et al. Increasing trauma deaths in the United States. Ann Surg. (2014) 260:13–21. 10.1097/sla.0000000000000600 - DOI - PubMed
    1. Spinella PC, Cap AP. Prehospital hemostatic resuscitation to achieve zero preventable deaths after traumatic injury. Curr Opin Hematol. (2017) 24:529–35. - PubMed
    1. Brohi K, Singh J, Heron M, Coats T. Acute traumatic coagulopathy. J Trauma. (2003) 54:1127–30. - PubMed
    1. MacLeod JB, Lynn M, McKenney MG, Cohn SM, Murtha M. Early coagulopathy predicts mortality in trauma. J Trauma. (2003) 55:39–44. 10.1097/01.ta.0000075338.21177.ef - DOI - PubMed
    1. Maegele M, Lefering R, Yucel N, Tjardes T, Rixen D, Paffrath T, et al. Early coagulopathy in multiple injury: an analysis from the german trauma registry on 8724 patients. Injury. (2007) 38:298–304. 10.1016/j.injury.2006.10.003 - DOI - PubMed

Publication types

Associated data