. 2020 Sep 10:11:2117.
doi: 10.3389/fimmu.2020.02117. eCollection 2020.

Reconstituting NK Cells After Allogeneic Stem Cell Transplantation Show Impaired Response to the Fungal Pathogen Aspergillus fumigatus

Affiliations

Reconstituting NK Cells After Allogeneic Stem Cell Transplantation Show Impaired Response to the Fungal Pathogen Aspergillus fumigatus

Esther Weiss et al. Front Immunol. .

Abstract

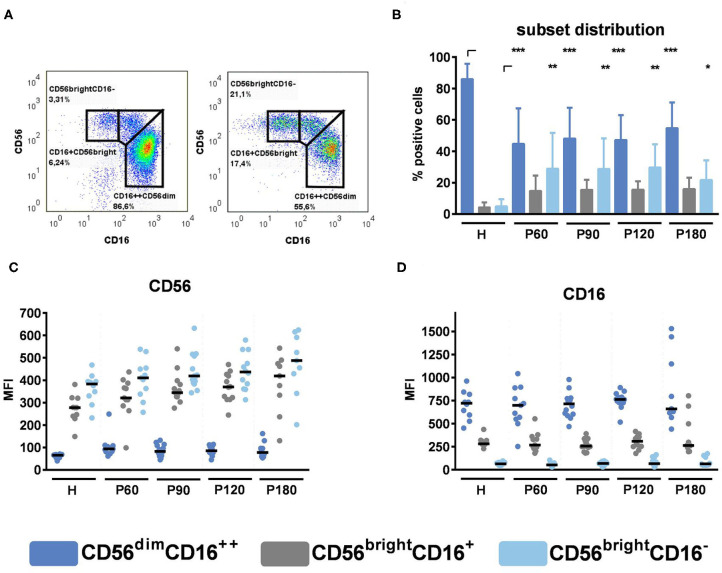
Delayed natural killer (NK) cell reconstitution after allogeneic stem cell transplantation (alloSCT) is associated with a higher risk of developing invasive aspergillosis. The interaction of NK cells with the human pathogen Aspergillus (A.) fumigatus is mediated by the fungal recognition receptor CD56, which is relocated to the fungal interface after contact. Blocking of CD56 signaling inhibits the fungal mediated chemokine secretion of MIP-1α, MIP-1β, and RANTES and reduces cell activation, indicating a functional role of CD56 in fungal recognition. We collected peripheral blood from recipients of an allograft at defined time points after alloSCT (day 60, 90, 120, 180). NK cells were isolated, directly challenged with live A. fumigatus germ tubes, and cell function was analyzed and compared to healthy age and gender-matched individuals. After alloSCT, NK cells displayed a higher percentage of CD56brightCD16dim cells throughout the time of blood collection. However, CD56 binding and relocalization to the fungal contact side were decreased. We were able to correlate this deficiency to the administration of corticosteroid therapy that further negatively influenced the secretion of MIP-1α, MIP-1β, and RANTES. As a consequence, the treatment of healthy NK cells ex vivo with corticosteroids abrogated chemokine secretion measured by multiplex immunoassay. Furthermore, we analyzed NK cells regarding their actin cytoskeleton by Structured Illumination Microscopy (SIM) and flow cytometry and demonstrate an actin dysfunction of NK cells shown by reduced F-actin content after fungal co-cultivation early after alloSCT. This dysfunction remains until 180 days post-alloSCT, concluding that further actin-dependent cellular processes may be negatively influenced after alloSCT. To investigate the molecular pathomechansism, we compared CD56 receptor mobility on the plasma membrane of healthy and alloSCT primary NK cells by single-molecule tracking. The results were very robust and reproducible between tested conditions which point to a different molecular mechanism and emphasize the importance of proper CD56 mobility.

Keywords: Aspergillus fumigatus; CCL3; CCL4; CCL5; corticosteroids; natural killer cell; stem cell transplantation.


Figures

Figure 1
Figure 1
NK and T cell composition in patients after alloSCT and healthy controls. (A) Total NK cell counts per μl, (B) NK cell percentages in PBMCs and (C) T cell percentages in PBMCs were measured in the peripheral blood from healthy individuals (H) or patients 60, 90, or 120 days post-alloSCT (P60, P90, P120). Statistics were analyzed by (A) Kruskal-Wallis test with FDR correction (Benjamini and Hochberg), (B,C) one-way ANOVA with FDR correction [Benjamini and Hochberg, *q < 0.05, FB(3, 70) = 2.248, Fc(3,70) = 1.964]. Data were acquired from (A–C) n = 10 (H), n = 22 (P_60), n = 23 (P_90), and n = 19 (P_120) independent experiments. (D) NK/ T cell ratios were calculated by Pearson correlation. Data were obtained from n = 60 different experiments including time points ranging from 60 to 120 days post-alloSCT patients (n = 26).
Figure 2
Figure 2
NK cell subsets in reconstituting NK cells. NK cells were pre-stimulated with 1,000 U/ml IL-2 overnight. (A) Representative gating strategies for healthy individuals (left) and recipients of an allograft (right). (B) NK cell subsets were compared between healthy individuals and recipients of an allograft. Data are displayed as mean + SD. (C) CD56 MFI and (D) CD16 MFI within NK cell subset were analyzed by flow cytometry. Data were acquired from n = 10 (H); n = 11 (P60); n = 14 (P90); n = 12 (P120); n = 9 (P180) different experiments. Medians are displayed. Statistical analysis was performed by (B) one-way ANOVA [CD16++CD56dim and CD16+CD56bright, F(14,156) = 25.87] and Kruskal-Wallis test (CD16CD56bright). Corrections for multiple testing were performed by the FDR method of Benjamini and Hochberg. Statistical significances are marked by asterisks (*p < 0.05, **p < 0.01, ***p < 0.001).
Figure 3
Figure 3
Corticosteroid treatment inhibits CD56 binding to the fungus. NK cells were pre-stimulated with 1,000 U/ml IL-2 overnight before NK cells were co-cultured with A. fumigatus germ tubes (AF, MOI 0.5) or plain medium at 37°C for 6 h. NK cells were gated into NKp46+/CD16+ or NKp46+/CD16 cells. CD56 mean fluorescence intensity (MFI) was evaluated by flow cytometry with and without fungal co-culture. Relative CD56 expression was calculated for alloSCT NK cells (P) and healthy controls (H). Values for relative CD56 expression were grouped regarding (A) the time after alloSCT and (B) corticosteroid treatment. Data were acquired from (A) n = 11 (H); n = 9 (P60), n = 13 (P90); n = 12 (P120); n = 9 (P180) and (B) n = 11 (healthy) n = 18 (alloSCT and alloSCT + cort) experiments. Medians are displayed. Significant differences were calculated by the Kruskal-Wallis test with correction for multiple testing by the FDR method of Benjamini and Hochberg and are marked by asterisks (*p < 0.05; ***p < 0.001).
Figure 4
Figure 4
Chemokine secretion is inhibited in CD16+ cells after alloSCT. NK cells were obtained from healthy individuals or 90 days after alloSCT and were pre-stimulated with 1,000 U/ml IL-2 overnight. (A) NK cell subsets were isolated with CD16 magnetic bead positive isolation, and subset purity was analyzed by flow cytometry. NK cell subsets were co-cultured with A. fumigatus germ tubes (AF, MOI 0.5) or plain medium for 6 h at 37°C. Supernatants were collected, and chemokine levels of (B) MIP-1α, (C) MIP-1β, and (D) RANTES were analyzed. Data are displayed as (A) medians + range, (B–D) medians and were acquired from n = 5 different experiments. Significant differences were calculated by the Kruskal-Wallis test with correction for multiple testing by the FDR method of Benjamini and Hochberg and marked by an asterisk (*p < 0.05).
Figure 5
Figure 5
Chemokine secretion by alloSCT NK cells and healthy controls. NK cells were pre-stimulated with 1,000 U/ml IL-2 overnight. NK cells obtained after alloSCT with and without corticosteroid treatment (alloSCT + cort) or from healthy controls (H) were co-cultured with A. fumigatus germ tubes (AF, MOI 0.5) or plain medium at 37°C for 6 h. Supernatants were collected, and cytokine and chemokine levels of (A) MIP-1α, (B) MIP-1β, and (C) RANTES were analyzed. Data were acquired from n = 11 (H), n = 6 (alloSCT 60), n = 7 (alloSCT 90), n = 6 (alloSCT 120), n = 3 (alloSCT 180), n = 3 (cort 60), n = 5 (cort 90), n = 120 (cort 120), and n = 5 (cort 180) experiments. Data are displayed as medians. Significant differences were calculated by Kruskal-Wallis test with correction for multiple testing by the FDR method of Benjamini and Hochberg. Statistical significances are marked by asterisks (*p < 0.05, **p < 0.01, ***p < 0.001).
Figure 6
Figure 6
Prednisolone treatment of healthy NK cells reduces CD56 mediated chemokine secretion of MIP-1α, MIP-1β, and RANTES. NK cells were cultured with 1,000 U/ml IL-2 in the presence of 25 μg/ml prednisolone for 40 h. (A) NK cell viability and cell counts were monitored by trypan blue staining using a cell viability analyzer (Beckman Coulter Vicell XR). NK cell-A. fumigatus (MOI 0.5) co-cultures were set for 6 h. (B) CD56 mean fluorescence intensity (MFI) was analyzed by flow cytometry. The secretion of (C) MIP-1α and (D) MIP-1β and (E) RANTES was analyzed by multiplex immunoassay. Data were acquired from (A) n = 5, (B–E) n = 8 different experiments. Data are displayed as (A) means + SD, (B,C) means, and (D,E) medians. Statistics were calculated by (A) paired t-test, (B,C) one-way ANOVA with FDR correction [FB(1.452,10.16) = 445.2, FC(1.198,8.385) = 21.46] and (D,E) Friedman test with FDR correction. Statistical significances are marked by asterisks (**p < 0.01, ***p < 0.001). (F,G) NK cells from n = 3 healthy individuals were treated with increasing concentrations of prednisolone (0, 6.25, 12.5, 18.75, or 25 μg/ml) and were challenged with A. fumigatus germ tubes for 6 h. Supernatants were analyzed by ELISA for (F) MIP-1α and (G) MIP-1β.
Figure 7
Figure 7
A. fumigatus stimulates F-Actin in NK cells. NK cells were pre-stimulated with 1,000 U/ml IL-2 overnight. NK cells were co-cultured with A. fumigatus germ tubes (AF, MOI 0.5) or without (ctrl) for 6 h. Cultures were fixed, and F-actin was stained with phalloidin staining solution for 24 h. Calcofluor was used to visualize the fungal cell wall. (A) Quantification of the actin signal per NK cell derived from n = 37 (H1), n = 48 (H2), and n = 62 (H3) SIM z-stacks. Data are displayed in medians and arbitrary units. Statistics were calculated by Wilcoxon test to compare the control samples and the fungal treated samples within each donor. Significant differences are displayed by asterisks (***p < 0.001). (B) Fluorescence intensities were compared between NK cells treated with A. fumigatus germ tubes (AF, left) or control cells (ctrl, middle). To better visualize the distribution of F-actin on control cells, we displayed the fluorescence signal of phalloidin with three times higher contrast (right). Increases in F-actin levels by fungal treatment are marked by an arrow. Fungal hyphae are displayed in magenta. Representative data from n = 3 different experiments are shown. Scale bar, 2 μm.
Figure 8
Figure 8
Actin induction following fungal stimulation recovers within 6 months after alloSCT. (A,B,D) NK cells were isolated from patients 60, 90, 120, and 180 days after alloSCT (P) or healthy controls (H). (C) NK cells were isolated from healthy controls and stimulated with 25 μg/ml prednisolone ex vivo for 40 h. (A–D) NK cells were cultured alone or with A. fumigatus germ tubes (MOI 0.5) for 6 h. Cells were stained for surface markers, treated with the F-Actin binding probe Sir647 for 50 min, and were analyzed by flow cytometry. Relative actin induction was calculated by the division of Sir647 MFI after fungal co-culture with Sir647 MFI of control cells. Data were acquired from (A) n = 44, (B) n = 14, (C) n = 8, and (D) n = 11 (H); n = 9 (P60), n = 13 (P90); n = 12 (P120); n = 8 (P180) different experiments. Data are displayed as (B–D) means. Significant differences were calculated by (A) two-tailed Spearman correlation, (B) unpaired t-test with Welch's correction, (C) Wilcoxon test, and (D) One-way ANOVA with FDR correction (F[4,48] = 3.112), and. Statistical significance is marked by an asterisk (*p < 0.05).
Figure 9
Figure 9
Single-molecule tracking of CD56 on primary NK cells of healthy and alloSCT patients isolated 120 days after alloSCT. (A) No significant differences in the ensemble diffusion coefficients derived from MSD analysis of individual trajectories between healthy (green) and alloSCT (magenta) NK cells. Median diffusion coefficients were between 0.028 and 0.042 μm2/sα. (B) Analysis of anomalous diffusion indicates subdiffusive behavior of CD56 on healthy (green) and alloSCT (magenta) NK cells with no significant differences between healthy and alloSCT trajectories. We analyzed at least 11 NK cells with numerous trajectories for each condition (healthy #1 n = 18, healthy #2 n = 11, healthy #3 n = 28, alloSCT #1 n = 11, alloSCT #2 n = 12, alloSCT #3 n = 12, alloSCT #4 n = 11).

Similar articles

Cited by

References

    1. Corre E, Carmagnat M, Busson M, De Latour RP, Robin M, Ribaud P, et al. . Long-term immune deficiency after allogeneic stem cell transplantation: B-cell deficiency is associated with late infections. Haematologica. (2010) 95:1025–9. 10.3324/haematol.2009.018853 - DOI - PMC - PubMed
    1. Steele C, Rapaka RR, Metz A, Pop SM, Williams DL, Gordon S, et al. . The beta-glucan receptor dectin-1 recognizes specific morphologies of Aspergillus fumigatus. PLoS Pathog. (2005) 1:e42. 10.1371/journal.ppat.0010042 - DOI - PMC - PubMed
    1. Kawai T, Akira S. The roles of TLRs, RLRs and NLRs in pathogen recognition. Int immunol. (2009) 21:313–37. 10.1093/intimm/dxp017 - DOI - PMC - PubMed
    1. Park BS, Lee J-O. Recognition of lipopolysaccharide pattern by TLR4 complexes. Exp Mol Med. (2013) 45:e66. 10.1038/emm.2013.97 - DOI - PMC - PubMed
    1. Bjorkstrom NK, Ljunggren HG, Michaelsson J. Emerging insights into natural killer cells in human peripheral tissues. Nat Rev Immunol. (2016) 16:310–20. 10.1038/nri.2016.34 - DOI - PubMed

Publication types