. 2020 Sep 10:11:572703.
doi: 10.3389/fpls.2020.572703. eCollection 2020.

Comparative Plastid Genomics of Non-Photosynthetic Chrysophytes: Genome Reduction and Compaction

Affiliations

Comparative Plastid Genomics of Non-Photosynthetic Chrysophytes: Genome Reduction and Compaction

Jong Im Kim et al. Front Plant Sci. .

Abstract

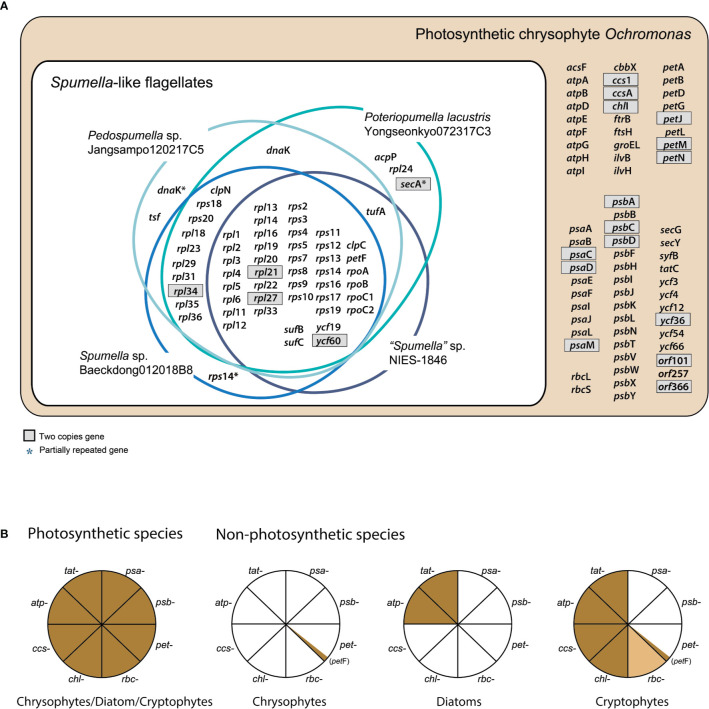
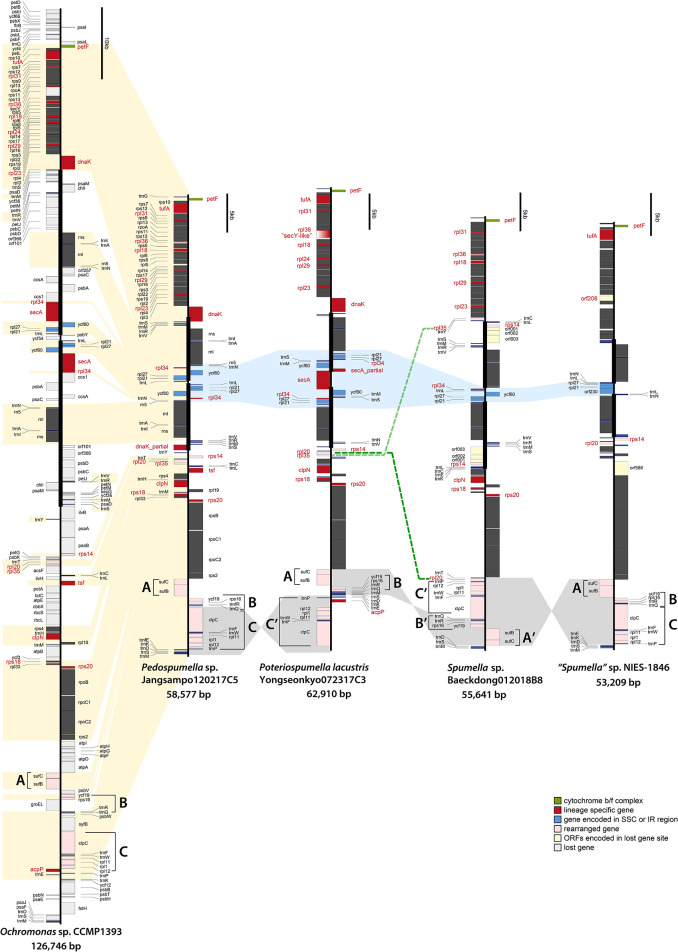
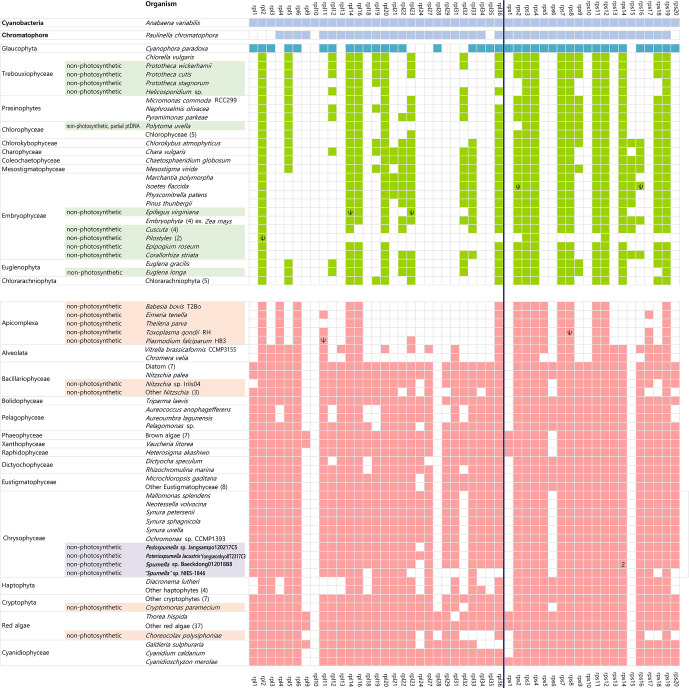
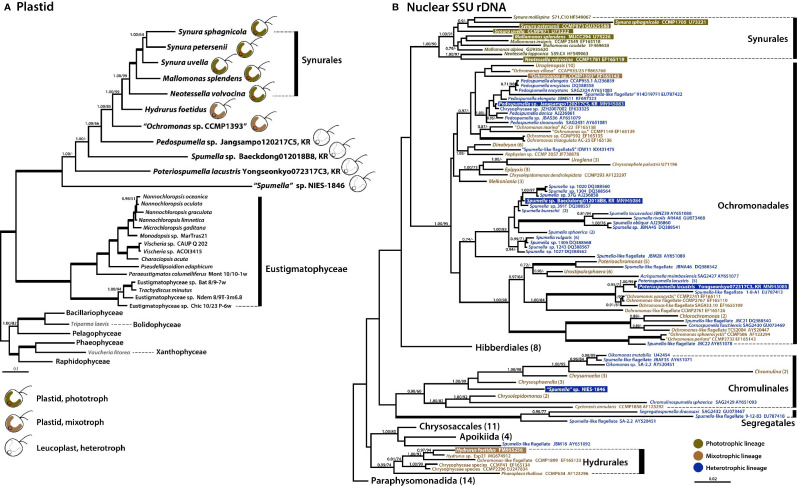
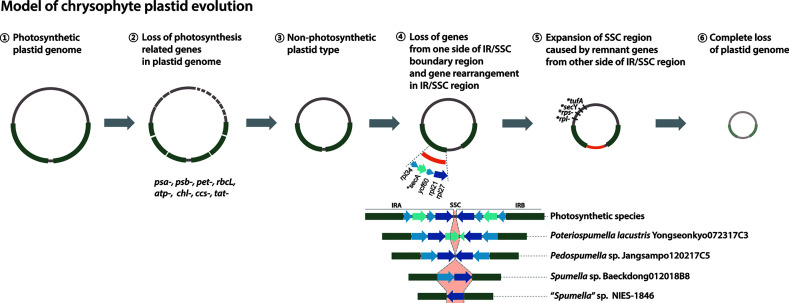
Spumella-like heterotrophic chrysophytes are important eukaryotic microorganisms that feed on bacteria in aquatic and soil environments. They are characterized by their lack of pigmentation, naked cell surface, and extremely small size. Although Spumella-like chrysophytes have lost their photosynthetic ability, they still possess a leucoplast and retain a plastid genome. We have sequenced the plastid genomes of three non-photosynthetic chrysophytes, Spumella sp. Baeckdong012018B8, Pedospumella sp. Jangsampo120217C5 and Poteriospumella lacustris Yongseonkyo072317C3, and compared them to the previously sequenced plastid genome of "Spumella" sp. NIES-1846 and photosynthetic chrysophytes. We found the plastid genomes of Spumella-like flagellates to be generally conserved with respect to genome structure and housekeeping gene content. We nevertheless also observed lineage-specific gene rearrangements and duplication of partial gene fragments at the boundary of the inverted repeat and single copy regions. Most gene losses correspond to genes for proteins involved in photosynthesis and carbon fixation, except in the case of petF. The newly sequenced plastid genomes range from ~55.7 kbp to ~62.9 kbp in size and share a core set of 45 protein-coding genes, 3 rRNAs, and 32 to 34 tRNAs. Our results provide insight into the evolutionary history of organelle genomes via genome reduction and gene loss related to loss of photosynthesis in chrysophyte evolution.

Keywords: chrysophytes; genome reduction; leucoplast; non-photosynthesis; plastid genome.


Figures

Figure 1
Figure 1
(A) Chrysophyte plastid genome content. Genes with two copies are shown in gray boxes. (B) Presence or absence of genes for photosystem I (PSI, psa-), photosystem II (PSII, psb-), the cytochrome b6/f complex (pet-), carbon fixation (rbc-), chlorophyll biosynthesis (chl-), cytochrome c biogenesis proteins (ccs-), the ATP synthase subunits (atp-), and the TAT system (tat-) are shown for three distantly related lineages, i.e., photosynthetic and non-photosynthetic chrysophytes, diatoms, and cryptophytes. Genes present/absent in plastid genomes are shown in brown or white, respectively. The rbc- gene present only in certain species is colored light brown. The data were derived from previously published studies (Donaher et al., 2009; Kamikawa et al., 2015; Kim et al., 2017; Dorrell et al., 2019; Kim et al., 2019; Tanifuji et al., 2020; this study).
Figure 2
Figure 2
Linearized maps of the plastid genomes of chrysophytes. The structures and coding capacities of the non-photosynthetic chrysophyte plastid genomes examined herein are almost identical to those of the photosynthetic chrysophyte Ochromonas sp. CCMP1393. The protein-coding, rRNA and tRNA genes are labeled left or right of the line (genes on the left are transcribed bottom to top, those on the right top to bottom). Inverted repeats are highlighted with thick vertical lines (single-copy regions have thin lines). The gene clusters (A–C) are related to gene rearrangement.
Figure 3
Figure 3
Presence/absence of plastid-encoded ribosomal protein genes in diverse algae and the cyanobacterium Anabaena variabilis. Taxa highlighted bold correspond to those specifically analyzed in this study. Filled boxes indicate the presence of ribosomal protein genes (green=green alga-derived secondary plastid lineage; red=red alga-derived plastid lineage). The missing ribosomal protein genes (i.e., rpl7, rpl8, rpl15, rpl17, rpl25, rpl26, rpl30, and rps21) were not detected in the plastid genomes of any of the lineages examined herein. Accession numbers and fully surveyed datasets are provided in Supplementary Table S1 , online Supplementary Material. 2 , multi-copy genes; Ψ, pseudogenes.
Figure 4
Figure 4
Phylogenies of phototrophic, mixotrophic, and heterotrophic chrysophytes. (A) Plastid genome-based Bayesian tree of chrysophytes and other stramenopile taxa. The topology of this tree (inferred from an alignment of 40 proteins and 8,267 amino acids) is consistent with a single acquisition of photosynthetic ability from a red alga-derived secondary plastid in a chrysophyte ancestor. The numbers on each node represent posterior probabilities (left) and ultrafast bootstrap approximation (UFBoot) values calculated using IQ-Tree (right). Thick branches indicate fully supported nodes (PP = 1.00/ML = 100). This tree shows the phylogenetic relationships of chrysophytes and other stramenopiles based on a subset of taxa; for phylogenies inferred using a fully expanded dataset, refer to Supplementary Figures S1 and S3 . (B) Nuclear SSU rDNA tree of chrysophytes showing the putative relationships of the phototrophic chrysophyte lineage in the context of non-photosynthetic lineages. Sequences from the strains whose plastid genomes were sequenced in this study are highlighted. Together, the plastid and nuclear gene tree topologies suggest parallel evolution of chrysophyte plastid genomes in response to shifts to heterotrophy. The numbers on each node represent posterior probabilities (left) and maximum-likelihood (ML) bootstrap support values calculated using RAxML (right). Support values (PP < 0.70/ML<70) are shown on each node. Bold branches indicates fully supported values (PP = 1.00/ML = 100). The numbers in () are indicate the number of taxa in the species, genus, or order. The species name with “ “ indicates uncertain taxonomic status. An expanded phylogeny based on a much larger dataset is provided in Supplementary Figure S2 . The scale bars indicate the number of substitutions/site.
Figure 5
Figure 5
Model of chrysophyte plastid evolution. Lineage-specific gene losses in step ⑤ are indicated by a star (*).

Similar articles

Cited by

References

    1. Andersen R. A., Berges J. A., Harrison P. J., Watanabe M. M. (2005). “Appendix A. Recipes for freshwater and seawater media” in Algal culturing techniques. Ed. Andersen R. A. (Elsevier Academic Press; ), 429–538. 10.1016/B978-012088426-1/50027-5 - DOI
    1. Andersen R. A., Graf L., Malakhov Y., Yoon H. S. (2017). Rediscovery of the Ochromonas type species Ochromonas triangulata (Chrysophyceae) from its type locality (Lake Veysove, Donetsk region, Ukraine). Phycologia 56, 591–604. 10.2216/17-15.1 - DOI
    1. Bankevich A., Nurk S., Antipov D., Gurevich A. A., Dvorkin M., Kulikov A. S., et al. (2012). SPAdes: A new genome assembly algorithm and its applications to single-cell sequencing. J. Comput. Biol. 19, 455–477. 10.1089/cmb.2012.0021 - DOI - PMC - PubMed
    1. Barrett C. F., Freudenstein J. V., Li J., Mayfield-Jones D. R., Perez L., Pires J. C., et al. (2014). Investigating the path of plastid genome degradation in an early-transitional clade of heterotrophic orchids, and implications for heterotrophic angiosperms. Mol. Biol. Evol. 31, 3095–3112. 10.1093/molbev/msu252 - DOI - PubMed
    1. Besemer J., Lomsadze A., Borodovsky M. (2001). GeneMarkS: a self-training method for prediction of gene starts in microbial genomes. Implications for finding sequence motifs in regulatory regions. Nucleic Acids Res. 29, 2607–2618. 10.1093/nar/29.12.2607 - DOI - PMC - PubMed

LinkOut - more resources