. 2020 Aug 18:11:856.
doi: 10.3389/fgene.2020.00856. eCollection 2020.

Modulation of Escherichia coli Translation by the Specific Inactivation of tRNAGly Under Oxidative Stress

Affiliations

Modulation of Escherichia coli Translation by the Specific Inactivation of tRNAGly Under Oxidative Stress

Lorenzo Eugenio Leiva et al. Front Genet. .

Abstract

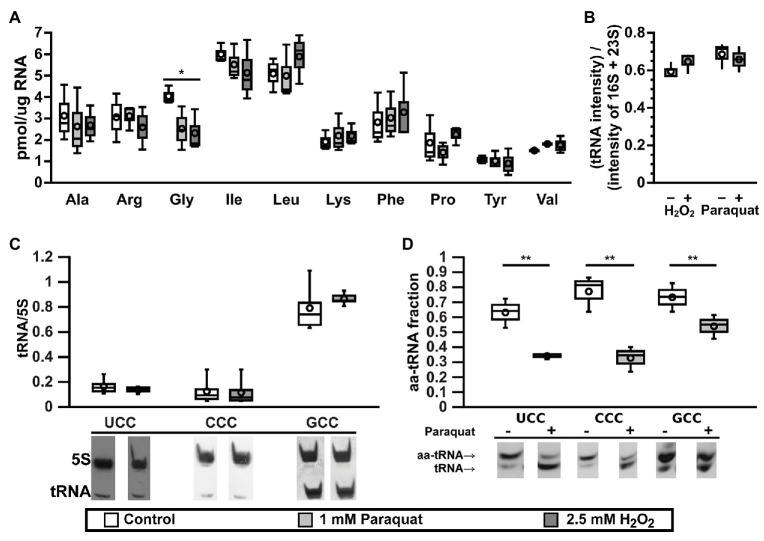
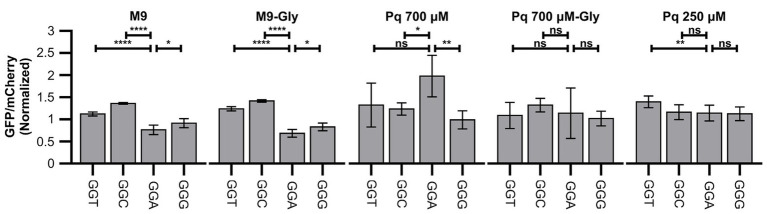
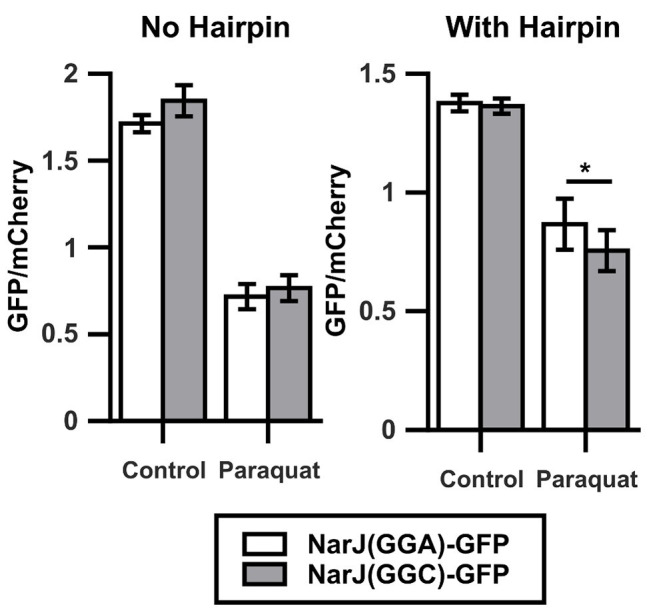
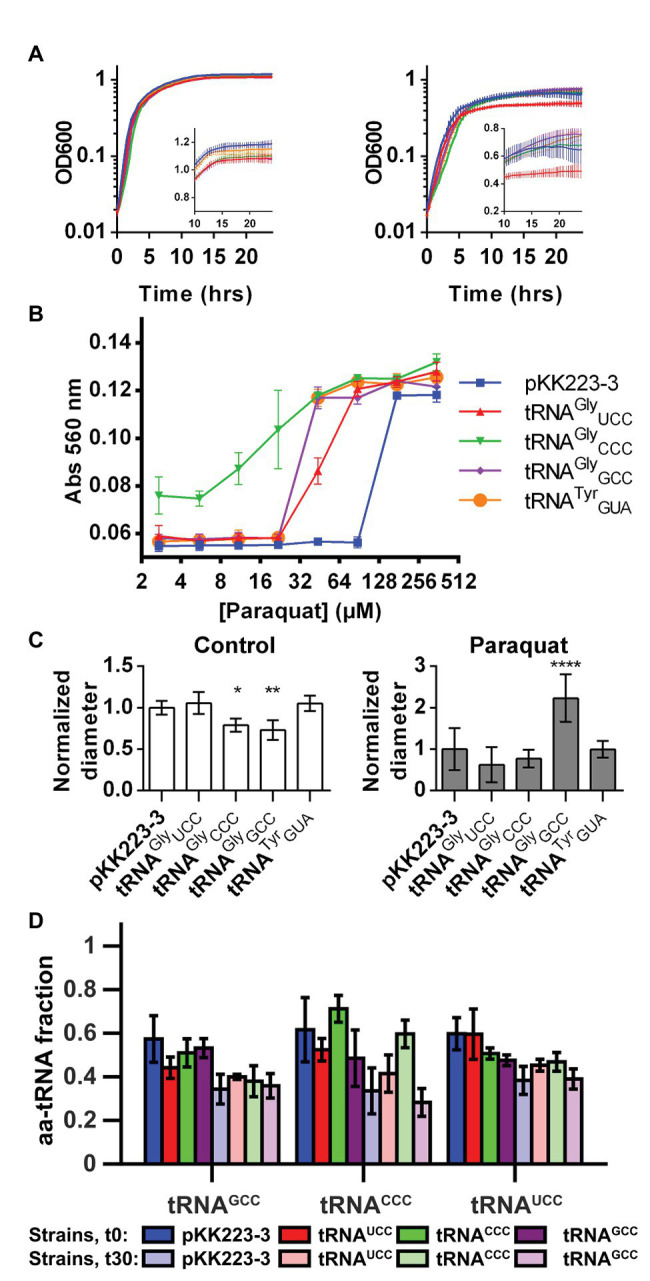
Bacterial oxidative stress responses are generally controlled by transcription factors that modulate the synthesis of RNAs with the aid of some sRNAs that control the stability, and in some cases the translation, of specific mRNAs. Here, we report that oxidative stress additionally leads to inactivation of tRNAGly in Escherichia coli, inducing a series of physiological changes. The observed inactivation of tRNAGly correlated with altered efficiency of translation of Gly codons, suggesting a possible mechanism of translational control of gene expression under oxidative stress. Changes in translation also depended on the availability of glycine, revealing a mechanism whereby bacteria modulate the response to oxidative stress according to the prevailing metabolic state of the cells.

Keywords: Escherichia coli; codon; glycine; oxidative stress; tRNAGly; translation.


Figures

Figure 1
Figure 1
tRNAGly are inactivated under oxidative stress. (A) Effect of oxidative stress on the levels of active tRNAs specific for 10 different amino acids as measured by the plateau of aminoacylation reaction. Control: lysogeny broth (LB), white bars; oxidative stress: LB + 1 mM paraquat, light gray bars; or 2.5 mM H2O2, dark gray bars. *p ≤ 0.01, one way ANOVA with Dunnett versus Control posterior test for each amino acid (n = 3). (B) Effect of oxidative stress on the levels of total tRNA from cells cultured in M9 media under control (white bars) or oxidative stress (gray bars, left: 2.5 mM H2O2 or right: 1 mM paraquat) and analyzed by electrophoresis (n = 3). Intensities from tRNA are higher than expected, as ribosomal RNA (rRNA) should represent at least 80% of total RNA. We suggest this is an artifact of staining efficiency and should not alter the conclusions of the figure. (C) Effect of paraquat on the levels of tRNA as quantified by Northern blot of total RNA samples purified from control (LB, white bars) or stressed (LB + 1 mM paraquat, gray bars) E. coli cells. Data in the graph showed no significant differences using one way ANOVA (n = 5). (D) In vivo levels of aminoacylation of tRNAGly in E. coli cell before (white bars) or 30 min after stress by 1 mM paraquat (gray bars). 3' terminal nucleotide of RNAs was eliminated by oxidation with sodium periodate followed by β-elimination and analyzed by Northern blot. **p ≤ 0.05, paired t-test (n = 3). In all box graphs, top, middle, and bottom lines of the box represent 25, 50, and 75% of the population. Whiskers represent the maximum and minimum values and the mean is represented by a circle.
Figure 2
Figure 2
Oxidative stress alters translation of Gly codons. Figure shows green fluorescent protein (GFP) fluorescence normalized by fluorescence of mCherry in diverse strains and conditions. Data were additionally normalized dividing by the GFP/mCherry ratio of the control strain (reporter S1, without additional codons). Four identical Gly codons were cloned in fusion to GFP and fluorescence measured in control media (M9), control media with Gly (M9-Gly), media with high concentration of paraquat in the absence (PQ 700 μM) or presence (PQ 700 μM-Gly), or media with low concentration of paraquat (PQ 250 μM). ****p ≤ 0.0001, **p ≤ 0.01, *p < 0.05, one way ANOVA with Dunnett versus GGA strain for each condition (n ≥ 3).
Figure 3
Figure 3
Oxidative stress alters translation of Gly codons in natural context. Left graph shows the GFP/mCherry fluorescence ratio for narJ [NarJ(GGA)-GFP, white] or a mutant of the gene where a contiguous GGA pair was changed for a pair of GGC [NarJ(GGC)-GFP, gray] cloned in fusion to GFP. Shown in the right graph are similar experiments performed after introducing a hairpin that prevents ribosome sliding between the sequences coding for GFP and mCherry. *p < 0.05, two-tailed t-test (n = 3).
Figure 4
Figure 4
Overproduction of tRNAGly alters the response of E. coli to oxidative stress. The effect of overproduction of diverse tRNAGly isoacceptors on the response to oxidative stress induced by paraquat was studied. (A) Effect of tRNAGly overproduction over growth curves performed at 37°C in control media (left) or media with paraquat (stress condition, right). Inset graph shows same data in linear scale for time points above 10 h. tRNAGlyCCC: green, tRNAGlyGCC: purple, tRNAGlyUCC: red, tRNATyrGUA: orange, and empty pKK223-3 plasmid: blue (n = 8). (B) Effect of tRNAGly overproduction on the fermentation of lactose as measured by changes in media pH after incubation at diverse paraquat concentrations. Higher absorbance indicates higher pH (lower fermentation of the carbohydrate). tRNAGlyCCC: green inverted triangles, tRNAGlyGCC: purple rhombus, tRNAGlyUCC: red triangles, tRNATyrGUA: orange circles, and empty pKK223-3 plasmid: blue squares (n = 3). (C) Effect of tRNAGly overproduction on bacterial motility as measured by changes in the diameter of colonies cultured on low agar LB plates in the absence (left) or presence (right) of paraquat. Data in graph represent the diameter of colonies normalized dividing by the average diameter of the control colonies. Each bar FIGURE 4represents the average of at least four replicates. ****p ≤ 0.0001, **p ≤ 0.01, *p ≤ 0.05, one way ANOVA with Dunnett versus strain with empty plasmid at the corresponding condition. (D) Fraction of tRNAGly isoacceptors that is aminoacylated in strains overproducing diverse tRNAGly isoacceptors. Color represents the tRNA isoacceptor that is overproduced in strains where aminoacylation was quantified. tRNAGlyCCC: green, tRNAGlyGCC: purple, tRNAGlyUCC: red, empty pKK223-3 plasmid: blue. Darker colors correspond to measurements performed before paraquat addition, while light colors represent aminoacylation 30 min after addition of the stressor. Each bar represents the average of at least three replicates.

Similar articles

Cited by

References

    1. Alings F., Sarin L. P., Fufezan C., Drexler H. C. A., Leidel S. A. (2015). An evolutionary approach uncovers a diverse response of TRNA 2-thiolation to elevated temperatures in yeast. RNA 21, 202–212. 10.1261/rna.048199.114, PMID: - DOI - PMC - PubMed
    1. Bald T., Barth J., Niehues A., Specht M., Hippler M., Fufezan C. (2012). pymzML--Python module for high-throughput bioinformatics on mass spectrometry data. Bioinformatics 28, 1052–1053. 10.1093/bioinformatics/bts066, PMID: - DOI - PubMed
    1. Blattner F. R., Plunkett G., Bloch C. A., Perna N. T., Burland V., Riley M., et al. . (1997). The complete genome sequence of Escherichia coli K-12. Science 277, 1453–1462. 10.1126/science.277.5331.1453, PMID: - DOI - PubMed
    1. Blondel C. J., Jiménez J. C., Leiva L. E., Alvarez S. A., Pinto B. I., Contreras F., et al. . (2013). The type VI secretion system encoded in Salmonella pathogenicity island 19 is required for Salmonella enterica serotype gallinarum survival within infected macrophages. Infect. Immun. 81, 1207–1220. 10.1128/IAI.01165-12, PMID: - DOI - PMC - PubMed
    1. Boccaletto P., Machnicka M. A., Purta E., Piatkowski P., Baginski B., Wirecki T. K., et al. . (2017). MODOMICS: a database of RNA modification pathways. 2017 update. Nucleic Acids Res. 46, D303–D307. 10.1093/nar/gkx1030, PMID: - DOI - PMC - PubMed