

Sources and Toxicity of Mercury in the San Francisco Bay Area, Spanning California and Beyond
- PMID: 33014081
- PMCID: PMC7519205
- DOI: 10.1155/2020/8184614
Sources and Toxicity of Mercury in the San Francisco Bay Area, Spanning California and Beyond
Abstract
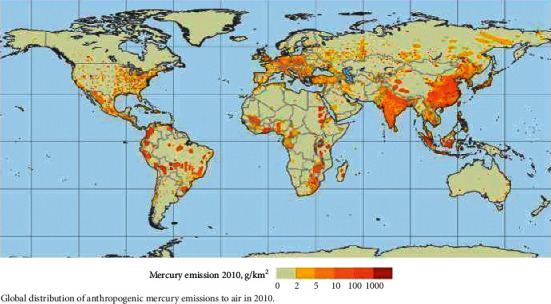
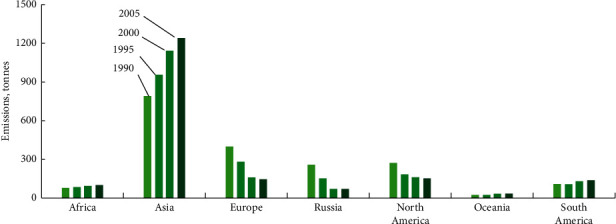
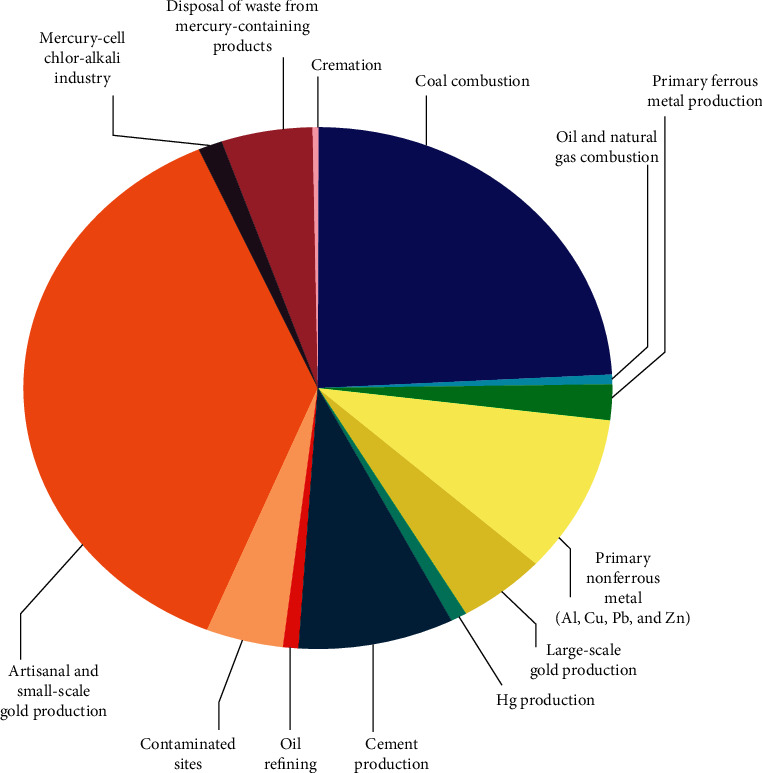
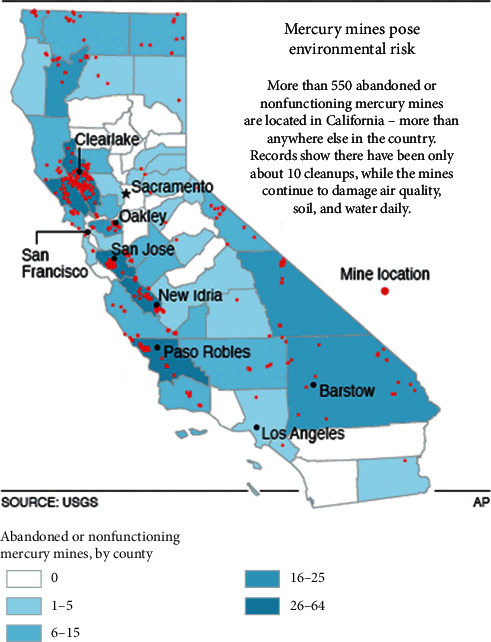
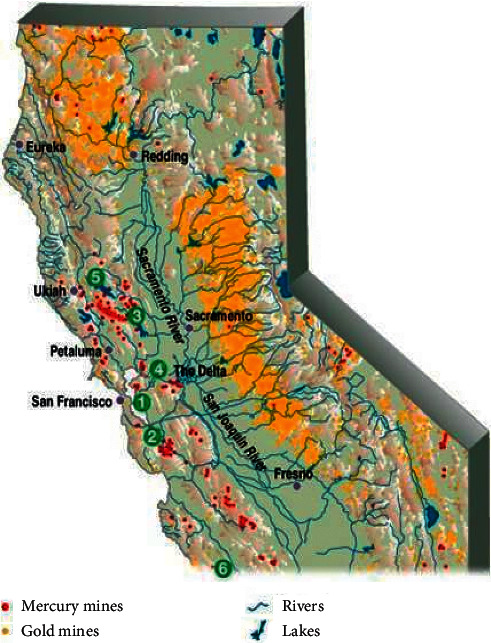
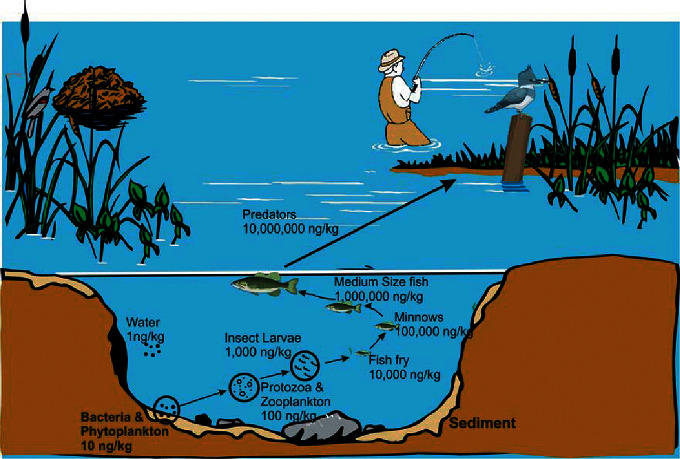
This report synthesizes and evaluates published scientific literature on the environmental occurrence and biomagnification of mercury with emphasis on the San Francisco Bay Area (SFBA), California. Mercury forms various compounds, well known for their toxicity in humans and environmental ecosystems. Elemental mercury is transported and distributed by air, water, and sediments. Through the metabolic processes of algae and bacteria, mercury is converted into organic compounds, such as methylmercury (MeHg), which then bioaccumulates up through trophic levels. In fish, it is found primarily in skeletal muscle, while in humans, the primary target organs are the brain and kidneys. Health concerns exist regarding bioaccumulation of mercury in humans. This paper reviews the known anthropogenic sources of mercury contamination, including atmospheric deposition through aerial transport from coal burning power plants, cement production, and residual contaminants of mercury from gold mining, as well as mercury-containing waste from silver amalgams emitted from dental offices into waterways. Although tools exist for measuring mercury levels in hair, breast milk, urine, blood, and feces in humans, current diagnostic tools are inadequate in measuring total mercury load, including deposited mercury in tissues. Additionally, insufficient attention is being paid to potential synergistic impacts of mercury interaction with multipliers such as lead, cadmium, and aluminum. We provide specific data on methylmercury concentrations at different trophic levels, followed by recommendations for reducing the level of mercury in the SFBA in order to protect the health of humans and other species.
Copyright © 2020 Mietek Kolipinski et al.
Conflict of interest statement
The authors declare that they have no conflicts of interest.
Figures
References
-
- Alpert A., Czaika E., Giang A. Mercury’s Health Effects. Mercury Science and Policy. 2013
-
- Olson D. A., Ramachandran T. S. Mercury Toxicity. Medscape. 20131175560
-
- Eagles-Smith C. A., Nelson S. J., Willacker J. J., Flanagan Pritz C. M., Krabbenhoft D. P. Dragonfly Mercury Project—A citizen science driven approach to linking surface-water chemistry and landscape characteristics to biosentinels on a national scale U. S. geological survey fact sheet 2016–3005. 2016.
-
- The Interstate Mercury Education and Reduction Clearinghouse (IMERC) One gram of mercury can contaminate a twenty acre lake: A Clarification of this commonly cited statistic. 2004. http://www.newmoa.org/prevention/mercury/mercurylake.pdf.
Publication types
MeSH terms
Substances
LinkOut - more resources
Full Text Sources
Medical
