. 2020 Sep 22;11(38):3515-3525.
doi: 10.18632/oncotarget.27724.

Altered lung tissue lipidomic profile in caspase-4 positive non-small cell lung cancer (NSCLC) patients

Affiliations

Altered lung tissue lipidomic profile in caspase-4 positive non-small cell lung cancer (NSCLC) patients

Michela Terlizzi et al. Oncotarget. .

Abstract

Lung cancer is by far the leading cause of cancer death. Metabolomic studies have highlighted that both tumor progression and limited curative treatment options are partly due to dysregulated glucose metabolism and its associated signaling pathways. In our previous studies, we identified caspase-4 as a novel diagnostic tool for non-small cell lung cancer (NSCLC). Here, we analyzed the metabolomic profile of both plasma and tumor tissues of NSCLC patients stratified as caspase-4 positive or negative. We found that circulating caspase-4 was correlated to LDH. However, this effect was not observed in caspase-4 positive tumor tissues, where instead, fatty acid biosynthesis was favoured in that the malonic acid and the palmitic acid were higher than in non-cancerous and caspase-4 negative tissues. The glycolytic pathway in caspase-4 positive NSCLC tissues was bypassed by the malonic acid-dependent lipogenesis. On the other hand, the dysregulated glucose metabolism was regulated by a higher presence of succinate dehydrogenase (SDHA) and by the gluconeogenic valine which favoured Krebs' cycle. In conclusion, we found that the recently identified caspase-4 positive subpopulation of NSCLC patients is characterized by a lipidomic profile accompanied by alternative pathways to guarantee glucose metabolism in favour of tumor cell proliferation.

Keywords: NSCLC; caspase-4; lipidomic; metabolomic; metabotype.


Conflict of interest statement

CONFLICTS OF INTEREST MT, AP and RS are co-founders of ImmunePharma s.r.l., academic spin-off at the University of Salerno, Department of Pharmacy (DIFARMA). ImmunePharma s.r.l. counts on the following patents: RM2014A000080 and PCT/IB2015/051262. JP and GS are co-founders of Theoreo s.r.l., academic spin-off at the University of Salerno, Department of Medicine and Surgery. The other authors have no conflicts of interest to disclose.

Figures

Figure 1
Figure 1. High levels of plasma, but not of tissue, LDH are associated to caspase-4-positive NSCLC patients.
(A) Plasma/circulating levels of LDH were evaluated in healthy (H, n = 61) and NSCLC (LK, n = 104). (B) Patients who were positive (red part, 82,69%) or negative (blue part, 17,31%) to plasma LDH were represented as fraction of total caspase-4 positive patients. (C) Tissue levels of LDH in matched pairs of non-cancerous and cancerous tissues obtained by NSCLC patients undergoing thoracic surgery. (D) Representation of caspase-4 positive (red bars) and caspase-4 negative (green bars) according to a cut-off value of LDH levels, identified by ROC analysis (1182 U/L). Data are showed as median ± interquartile range and represented as violin plots. Two-tailed Mann Whitney U test was applied. p < 0.05 was considered as significant.
Figure 2
Figure 2. Metabolomic profile of NSCLC patients.
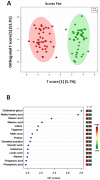
Partial least squares-discriminant analysis (PLS-DA) of tissue-derived metabolites determined by means of GC-MS. (A) Two dimensional score plot showing clustering and separation between non-cancerous (healthy, H, green symbols) and cancerous (KL, red symbols) tissues. (B) Heatmap plot of the most relevant metabolites (VIP-score > 2.0).
Figure 3
Figure 3. Lipidomic profile of NSCLC patients.
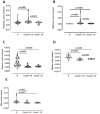
GC-MS content of palmitic acid (A), malonic acid (B), stearic acid (C), maleic acid (D) and malic acid (E) in tissue caspase-4 positive (Casp4+ LK) or negative (Casp4 – LK) cancerous tissues vs non-cancerous (H) tissues (n = 39). Data are showed as median ± interquartile range and represented as violin plots. One-Way ANOVA followed by Dunn’s multiple comparison post-test was performed. p < 0.05 was considered as significant.
Figure 4
Figure 4. Metabolomic profile of NSCLC patients.
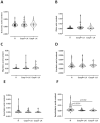
GC-MS content of succinic acid (A), oleic acid (B), myristic acid (C), linoleic acid (D), arachidinc acid (E) and arachidonic acid (F) in tissue caspase-4 positive (Casp4+ LK) or negative (Casp4 – LK) cancerous tissues vs non-cancerous (H) tissues (n = 39). Data are showed as median ± interquartile range and represented as violin plots. One-Way ANOVA followed by Dunn’s multiple comparison post-test was performed. p < 0.05 was considered as significant.
Figure 5
Figure 5. Proteomic profile of caspase-4 positive NSCLC tissues.
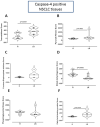
Proteomic data was analyzed by MASCOTT software following LC-MS of trypsin-digested proteic bands obtained after SDS-page of collagenase-digested lung tissues of non-cancerous (H) and cancerous (LK) tissues. Tissue proteic levels of (A) transaldolase, (B) pyruvate kinase, (C) fructose bisphoshate aldolase, (D) malate dehydrogenase, (E) phosphoglycerate kinase and (F) fatty acid binding protein. Samples are match-paired and were obtained from NSCLC patients undergoing thoracic surgery. Data are showed as median ± interquartile range and represented as violin plots. Two-tailed Mann Whitney U test was performed. p < 0.05 was considered as significant.
Figure 6
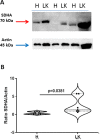
Figure 6. Expression of succinate dehydrogenase (SDHA) in non-cancerous (H) and cancerous (LK) collagenase-digested NSCLC tissues.
(A) Representative western blots are shown. (B) Data are expressed as ratio SDHA (70 kDa) vs actin (45 kDa), used as loading control. Data are showed as median ± interquartile range and represented as violin plots. Two-tailed Mann Whitney U test was performed. p < 0.05 was considered as significant.
Figure 7
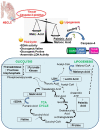
Figure 7. Caspase-4 positive NSCLC tissues present a pronounced lipogenic profile due to palmitic and malonic acid formation despite the TCA cycle, which seemed to be unbalanced.
Herein, the equilibrium is reached via the higher presence of SDHA, Valine, Proline which tend to recover the unbalanced-TCA cycle to provide ATP to tumor cells. Boxes in the schematic represent the metabolites that have been detected in caspase-4 positive tumor tissues compared to non-cancerous tissues.

Similar articles

Cited by

References

    1. Terlizzi M, Colarusso C, Pinto A, Sorrentino R. Drug resistance in non-small cell lung Cancer (NSCLC): Impact of genetic and non-genetic alterations on therapeutic regimen and responsiveness. Pharmacol Ther. 2019; 202:140–148. 10.1016/j.pharmthera.2019.06.005. - DOI - PubMed
    1. Massion PP, Caprioli RM. Proteomic strategies for the characterization and the early detection of lung cancer. J Thorac Oncol. 2006; 1:1027–1039. 10.1097/01243894-200611000-00019. - DOI - PubMed
    1. Najafi Z, Mohamadnia A, Ahmadi R, Mahmoudi M, Bahrami N, Khosravi A, Jamaati H, Tabarsi P, Kazem Pour Dizaji M, Shirian S. Proteomic and genomic biomarkers for Non-Small Cell Lung Cancer: Peroxiredoxin, Haptoglobin, and Alpha-1 antitrypsin. Cancer Med. 2020; 9:3974–3982. 10.1002/cam4.3019. - DOI - PMC - PubMed
    1. DeBerardinis RJ, Chandel NS. Fundamentals of cancer metabolism. Sci Adv. 2016; 2:e1600200. 10.1126/sciadv.1600200. - DOI - PMC - PubMed
    1. Pavlova NN, Thompson CB. The Emerging Hallmarks of Cancer Metabolism. Cell Metab. 2016; 23:27–47. 10.1016/j.cmet.2015.12.006. - DOI - PMC - PubMed