

Application of Multispectral Imaging in the Human Tympanic Membrane
- PMID: 33014321
- PMCID: PMC7525297
- DOI: 10.1155/2020/6219845
Application of Multispectral Imaging in the Human Tympanic Membrane
Abstract
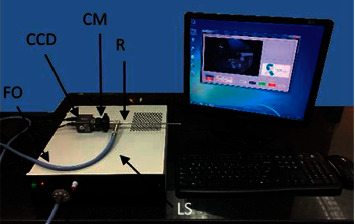
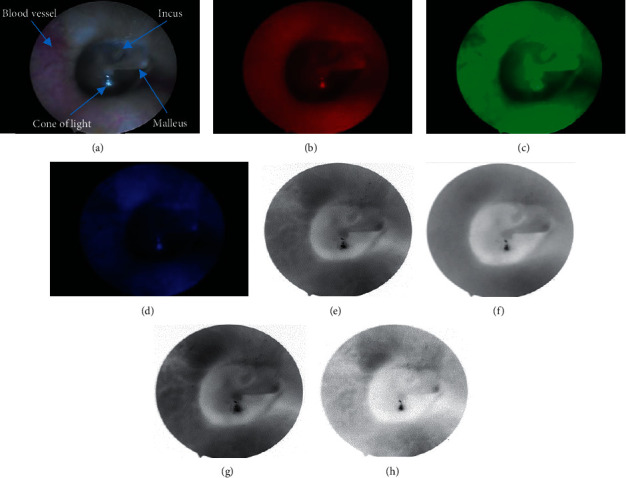
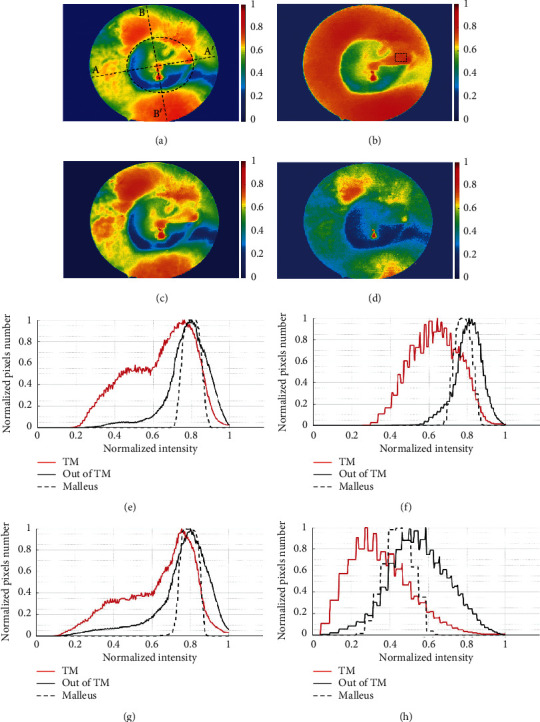
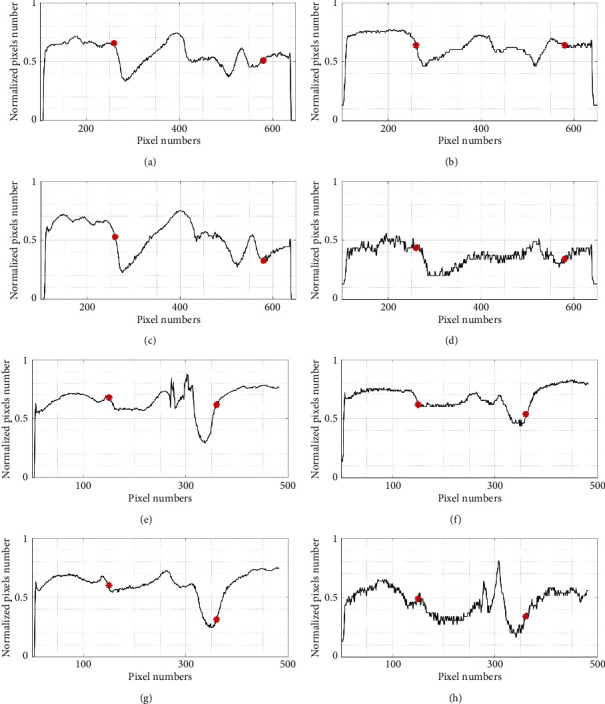
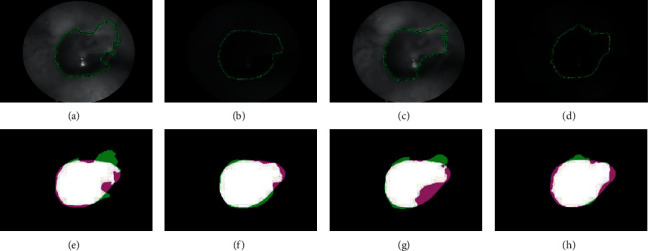
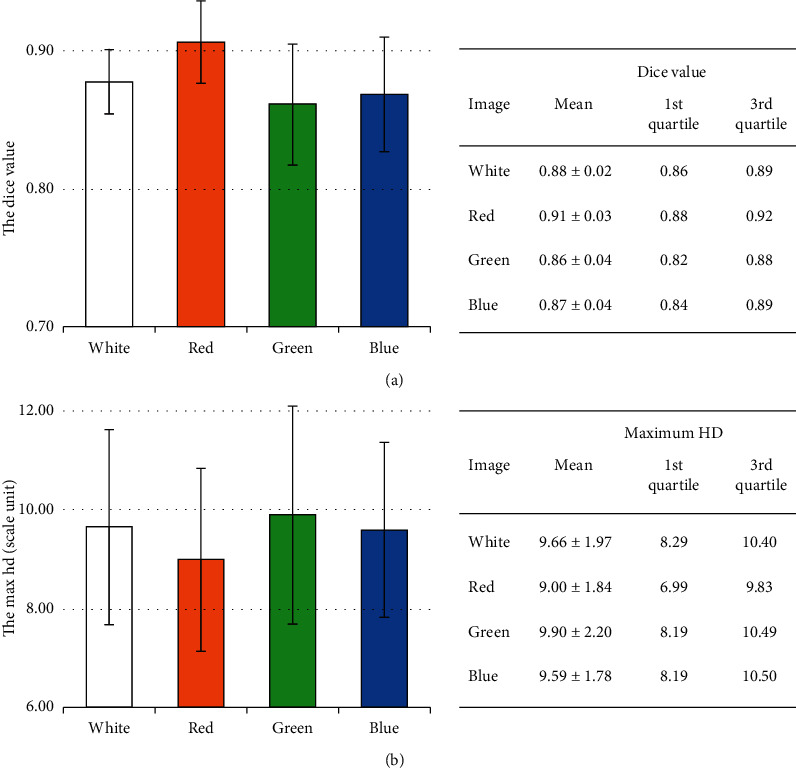
Multispectral imaging has recently shown good performance in determining information about physiology, morphology, and composition of tissue. In the endoscopy field, many researches have shown the ability to apply multispectral or narrow-band images in surveying vascular structure based on the interaction of light wavelength with tissue composition. However, there has been no mention to assess the contrast between other components in the middle ear such as the tympanic membrane, malleus, and the surrounding area. Using CT, OCT, or ODT can clearly describe the tympanic membrane structure; nevertheless, these approaches are expensive, more complex, and time-consuming and are not suitable for most common middle ear diagnoses. Here, we show the potential of using the multispectral imaging technique to enhance the contrast of the tympanic membrane compared to the surrounding tissue. The optical absorption and scattering of biological tissues constituents are not the same at different wavelengths. In this pilot study, multiwavelength images of the tympanic membrane were captured by using the otoscope with LED light source at three distinct spectral regions: 450 nm, 530 nm, and 630 nm. Subsequently, analyses of the intensity images as well as the histogram of these images point out that the 630 nm illumination image features an evident contrast in the intensity of the tympanic membrane and malleus compared to the surrounding area. Analysis of such images could facilitate the boundary determination and segmentation of the tympanic membrane (TM) with high precision.
Copyright © 2020 Tien Tran Van et al.
Conflict of interest statement
The authors declare that there are no conflicts of interest regarding the publication of this paper.
Figures
Similar articles
-
Registration of preoperative temporal bone CT-scan to otoendoscopic video for augmented-reality based on convolutional neural networks.Eur Arch Otorhinolaryngol. 2024 Jun;281(6):2921-2930. doi: 10.1007/s00405-023-08403-0. Epub 2024 Jan 10. Eur Arch Otorhinolaryngol. 2024. PMID: 38200355
-
Optical assessment of the in vivo tympanic membrane status using a handheld optical coherence tomography-based otoscope.Acta Otolaryngol. 2018 Apr;138(4):367-374. doi: 10.1080/00016489.2017.1395515. Epub 2017 Nov 10. Acta Otolaryngol. 2018. PMID: 29125012 Free PMC article. Clinical Trial.
-
Virtual CT otoscopy of the middle ear and ossicles in dogs.Vet Radiol Ultrasound. 2008 Nov-Dec;49(6):545-50. doi: 10.1111/j.1740-8261.2008.00428.x. Vet Radiol Ultrasound. 2008. PMID: 19051643
-
Optical Coherence Tomography of the Tympanic Membrane and Middle Ear: A Review.Otolaryngol Head Neck Surg. 2018 Sep;159(3):424-438. doi: 10.1177/0194599818775711. Epub 2018 May 22. Otolaryngol Head Neck Surg. 2018. PMID: 29787354 Review.
-
Machine Learning in Diagnosing Middle Ear Disorders Using Tympanic Membrane Images: A Meta-Analysis.Laryngoscope. 2023 Apr;133(4):732-741. doi: 10.1002/lary.30291. Epub 2022 Jul 18. Laryngoscope. 2023. PMID: 35848851 Review.
Cited by
-
Label-Free Optical Technologies for Middle-Ear Diseases.Bioengineering (Basel). 2024 Jan 23;11(2):104. doi: 10.3390/bioengineering11020104. Bioengineering (Basel). 2024. PMID: 38391590 Free PMC article. Review.
-
Color Dependence Analysis in a CNN-Based Computer-Aided Diagnosis System for Middle and External Ear Diseases.Diagnostics (Basel). 2022 Apr 7;12(4):917. doi: 10.3390/diagnostics12040917. Diagnostics (Basel). 2022. PMID: 35453965 Free PMC article.
-
Intelligent Control Techniques for the Detection of Biomedical Ear Infections.Comput Intell Neurosci. 2022 Sep 5;2022:9653513. doi: 10.1155/2022/9653513. eCollection 2022. Comput Intell Neurosci. 2022. PMID: 36105634 Free PMC article.
References
Publication types
MeSH terms
Substances
LinkOut - more resources
Full Text Sources
Medical
