. 2020 Sep 16:9:164.
doi: 10.1038/s41377-020-00399-0. eCollection 2020.

Metastatic status of sentinel lymph nodes in breast cancer determined with photoacoustic microscopy via dual-targeting nanoparticles

Affiliations

Metastatic status of sentinel lymph nodes in breast cancer determined with photoacoustic microscopy via dual-targeting nanoparticles

Yanfeng Dai et al. Light Sci Appl. .

Abstract

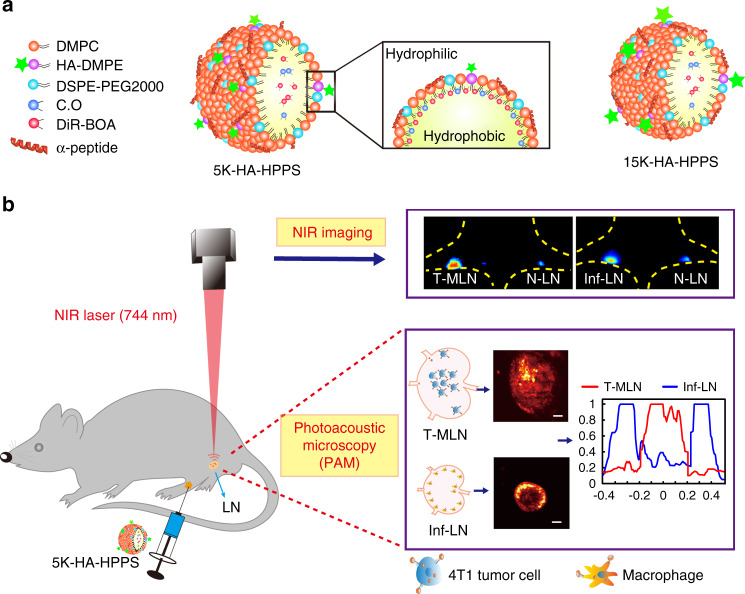
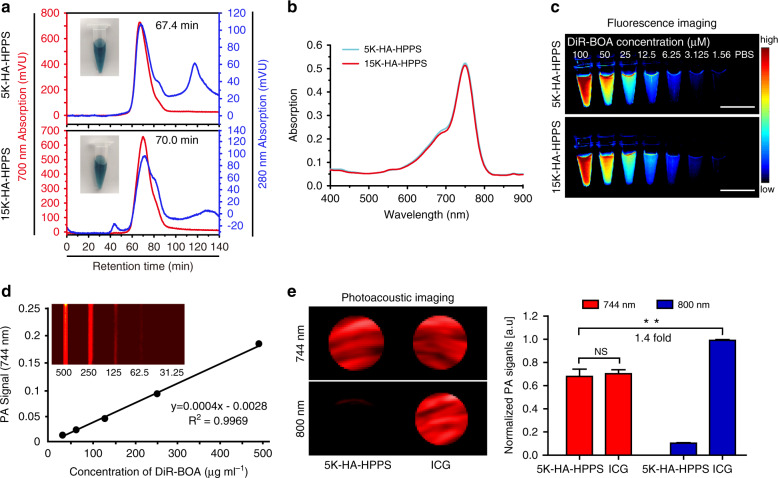
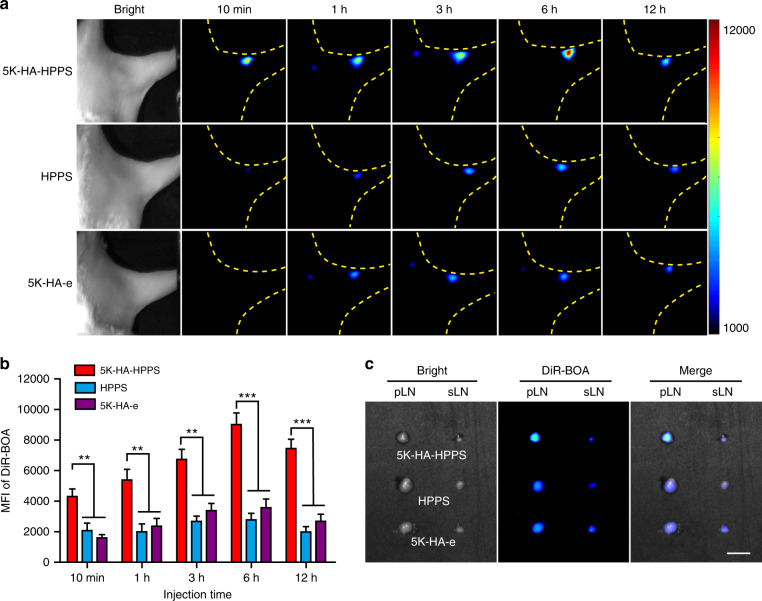
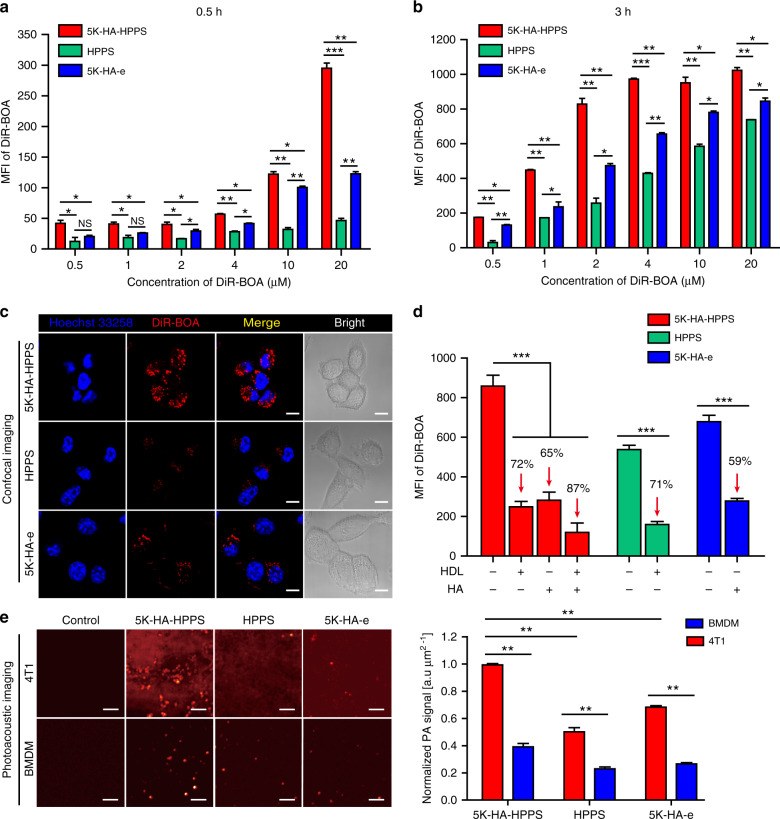
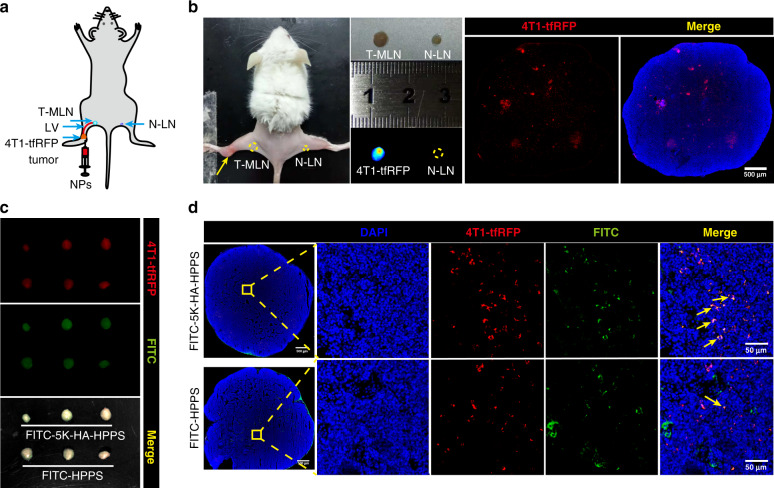
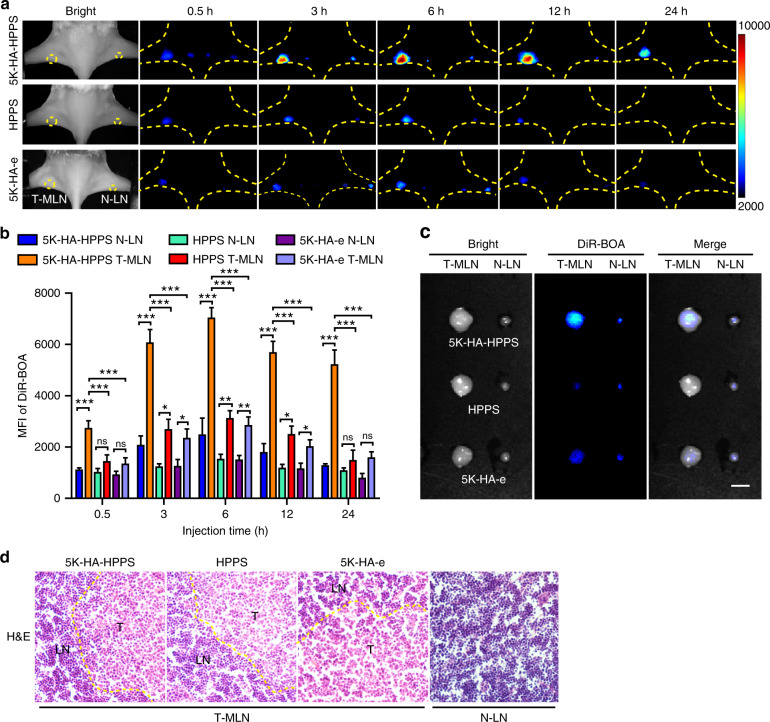
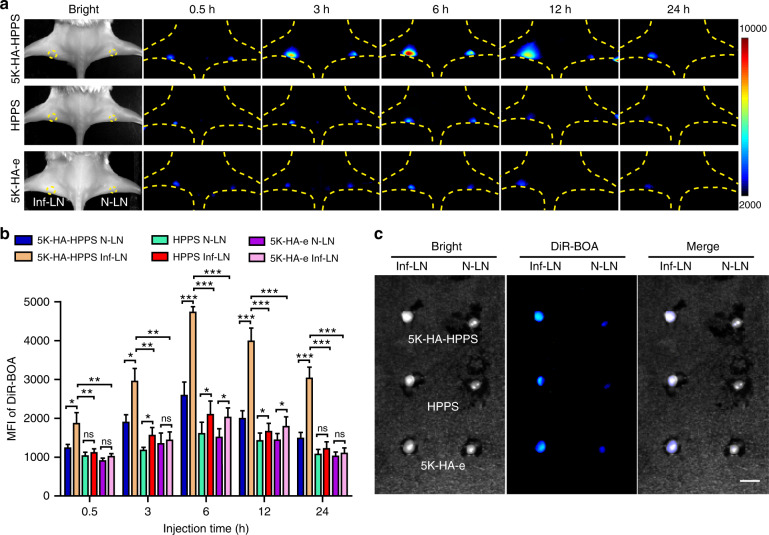
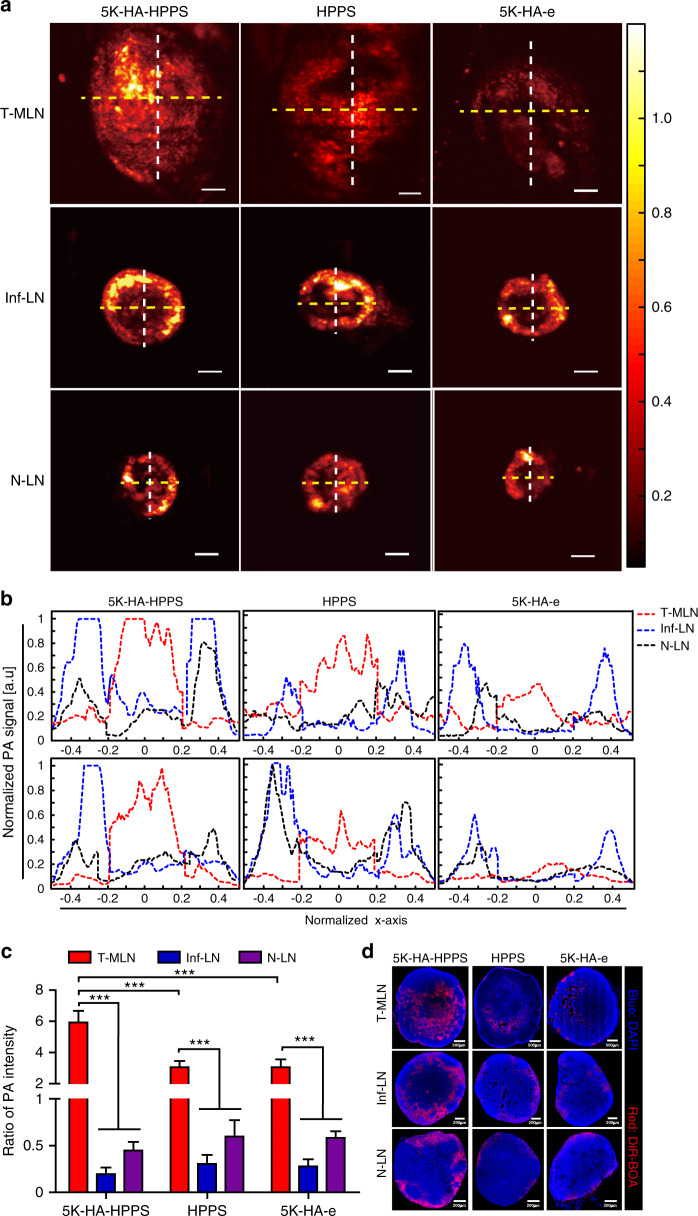
Detection of sentinel lymph nodes (SLNs) is critical to guide the treatment of breast cancer. However, distinguishing metastatic SLNs from normal and inflamed lymph nodes (LNs) during surgical resection remains a challenge. Here, we report a CD44 and scavenger receptor class B1 dual-targeting hyaluronic acid nanoparticle (5K-HA-HPPS) loaded with the near-infra-red fluorescent dye DiR-BOA for SLN imaging in breast cancer. The small sized (~40 nm) self-assembled 5K-HA-HPPSs accumulated rapidly in the SLNs after intradermal injection. Compared with normal popliteal LNs (N-LN), there were ~3.2-fold and ~2.4-fold increases in fluorescence intensity in tumour metastatic SLNs (T-MLN) and inflamed LNs (Inf-LN), respectively, 6 h after nanoparticle inoculation. More importantly, photoacoustic microscopy (PAM) of 5K-HA-HPPS showed a significantly distinct distribution in T-MLN compared with N-LN and Inf-LN. Signals were mainly distributed at the centre of T-MLN but at the periphery of N-LN and Inf-LN. The ratio of PA intensity (R) at the centre of the LNs compared with that at the periphery was 5.93 ± 0.75 for T-MLNs of the 5K-HA-HPPS group, which was much higher than that for the Inf-LNs (R = 0.2 ± 0.07) and N-LNs (R = 0.45 ± 0.09). These results suggest that 5K-HA-HPPS injection combined with PAM provides a powerful tool for distinguishing metastatic SLNs from pLNs and inflamed LNs, thus guiding the removal of SLNs during breast cancer surgery.

Keywords: Optical materials and structures; Optical techniques.


Conflict of interest statement

Conflict of interestThe authors declare that they have no conflict of interest.

Figures

Fig. 1
Fig. 1. Design of dual-modality HA-HPPS nanoparticles for mapping sentinel lymph nodes in breast cancer.
a Components and structures of the CD44 and SR-B1 dual-targeting HA-HPPS nanoparticles. b Dual-modality fluorescence and photoacoustic imaging of HA-HPPS in SLNs, which includes near-infra-red (NIR) fluorescence imaging for long-term monitoring of the accumulation and retention of HA-HPPS in SLNs and photoacoustic microscopy (PAM) for intraoperative determination of the metastatic status of SLNs in breast cancer
Fig. 2
Fig. 2. In vitro characteristics and optical properties of 5K-HA-HPPS and 15K-HA-HPPS.
a FPLC profiles and photographs of 5K-HA-HPPS and 15K-HA-HPPS. b 5K-HA-HPPS and 15K-HA-HPPS absorption spectra. c In vitro fluorescence imaging of 5K-HA-HPPS and 15K-HA-HPPS with different DiR-BOA concentrations (μM): 100, 50, 25, 12.5, 6.25, 3.125 and 1.56. Scale bar: 1 cm. d In vitro PA imaging of 5K-HA-HPPS excited at 744 nm as a function of different concentrations. e The photoacoustic signal amplitude of PAM 5K-HA-HPPS and ICG at 744nm and 800 nm (left panel) and the quantitative analysis of 5K-HA-HPPS and ICG at 744 nm and 800 nm (right panel). Data are presented as the mean ± SD. **P < 0.01. n = 3
Fig. 3
Fig. 3. In vivo comparison of the migratory capabilities of 5K-HA-HPPS, HPPS and 5K-HA-e to pLNs.
a Representative fluorescence images to observe the migratory capabilities of 5K-HA-HPPS, HPPS and 5K-HA-e to pLNs at 10min, 1, 3, 6 and 12 h after intradermal footpad injection. b Quantitative analysis of the mean fluorescence intensity of DiR-BOA in pLNs. c Fluorescence imaging was performed 12 h after injection on resected pLNs and sciatic LNs (sLNs). Scale bar: 2 mm. Data are presented as the mean ± SD (two-tailed t-test; n = 5 animals per group)
Fig. 4
Fig. 4. 5K-HA-HPPS efficiently targeted 4T1 cells through CD44 and SR-B1 receptors in vitro.
Flow cytometry was performed to analyse and compare the cellular uptake of 5K-HA-HPPS, HPPS and 5K-HA-e by 4T1 cells (5 × 10⁴ cells/well) in vitro after exposure to various concentrations for 0.5 h (a) and 3h (b). MFI: mean fluorescent intensity. c Confocal images for the nanoparticle-targeting ability to 4T1 cells (2 × 10⁴ cells/well). Scale bar: 50 μm. d Flow cytometry of 4T1 cells (5 × 10⁴ cells/well) pretreated for 3 h with free HDL protein and HA with 5K-HA-HPPS, HPPS and 5K-HA-e. The mass ratio of HDL to R4F in 5K-HA-HPPS and HPPS was 10:1. The mass ratio of free HA to HA in 5K-HA-HPPS and 5K-HA-e was 250:1. Blue: Hoechst 33258, red: DiR-BOA. e PAM and quantitative analysis of 4T1 cells and bone marrow-derived macrophages (BMDMs) incubated in vitro with 5K-HA-HPPS, HPPS and 5K-HA-e for 3 h. The spatial resolution of PAM was ~45 μm. Data are presented as the mean ± SD (two-tailed t-test; n = 3)
Fig. 5
Fig. 5. 5K-HA-HPPS efficiently targeted 4T1 cells in vivo.
a Schematic of LN tumour metastasis detection after intratumoural injection of NPs. b Successful establishment of the 4T1-tfRFP breast tumour LN metastasis model (left yellow dotted circle for T-MLN, right yellow dotted circle for N-LN), where the fluorescence signal of FITC–5K-HA-HPPS in the LNs shows metastasis of 4T1-tfRFP cells. Confocal imaging confirmed that 4T1-tfRFP tumour cells metastasised within pLNs. Scale bar: 500 μm. c Three weeks after hock inoculation of 4T1-tfRFP cells (5 × 10⁵ cells/mouse), wide-field fluorescence imaging of resected tumour-draining LNs (n = 3 mice/group) was performed at 6 h after intratumoural injection of FITC-labelled 5K-HA-HPPS and HPPS. Red: 4T1-tfRFP cells, green: FITC-labelled nanoparticles. n = 3 mice/group. d Confocal microscopy verified that FITC-labelled 5K-HA-HPPS colocalized with the majority of 4T1-tfRFP cells in tumour-draining LNs. Scale bar: 50 μm. Red: 4T1-tfRFP cells, blue: DAPI, green: FITC-labelled 5K-HA-HPPS
Fig. 6
Fig. 6. In vivo NIR fluorescence imaging of 5K-HA-HPPS for the detection of metastatic SLNs in breast cancer.
a After hock inoculation of 4T1 tumour cells (5 × 10⁵ cells/mouse), 5K-HA-HPPS (upper), HPPS (middle) and 5K-HA-e (lower) were administered by intratumoural (left) or footpad injection (right), and NIR fluorescence imaging of pLNs was performed at 0.5, 3, 6, 12 and 24 h after injection. b Quantitative statistical analysis of the mean fluorescence intensity of DiR-BOA in pLNs. c Fluorescence images of excised LNs from BALB/c mice. Scale bar: 2 mm. d H&E staining of LNs from the tumour side and control side. Data are presented as the mean ± SD, n = 6 mice/group (two-tailed t-test)
Fig. 7
Fig. 7. Accumulation of 5K-HA-HPPS in lipopolysaccharide-induced inflamed LNs.
a Comparison of 5K-HA-HPPS, HPPS and 5K-HA-e signals in the LPS-induced inflammation pLN model (Inf-LN, left) and normal LNs (N-LN, right) by fluorescence imaging at different time points (0.5, 3, 6, 12 and 24 h) after intradermal footpad injection of nanoparticles. b Quantitative analysis of the mean fluorescence intensity of DiR-BOA in Inf-LNs and N-LNs. c Fluorescence imaging was performed on resected pLNs. Scale bars: 2 mm. Data are presented as the mean ± SD, n = 6 mice/group (two-tailed t-test)
Fig. 8
Fig. 8. In vivo PAM of 5K-HA-HPPS in LNs with different statuses.
a In vivo comparison of the distribution of 5K-HA-HPPS (left), HPPS (middle) and 5K-HA-e (right) in 4T1-related SLNs (upper), inflamed LNs (middle) and normal LNs (lower) obtained using the AR-PAM system at 6 h after intratumoural injection (left) or footpad injection (right). Scale bar: 500 μm. n = 6 per group. b Normalised PA signals of 5K-HA-HPPS, HPPS and 5K-HA-e for distribution and intensity profiles that were taken from the transverse (yellow line) and longitudinal (white line) diameters of each LN depicted in a. To quantitatively analyse the distribution of PA signals, the diameters of the LNs with different statuses were normalised, and their centres were designated as the zero position. c The ratio of PA intensities (R values) at the centre of the LNs to those at their periphery. Data are presented as the mean ± SD, n = 6 mice/group (two-tailed t-test). d After in vivo PAM of LNs with different statuses, frozen sections were taken and confocal microscopy was performed. Blue: DAPI, red: DiR-BOA. Slices: 10 μm

Similar articles

Cited by

References

    1. Siegel RL, Miller KD, Jemal A. Cancer statistics, 2019. CA: Cancer J. Clin. 2019;69:7–34. - PubMed
    1. Bray F, et al. Global cancer statistics 2018: GLOBOCAN estimates of incidence and mortality worldwide for 36 cancers in 185 countries. CA: A Cancer J. Clin. 2018;68:394–424. - PubMed
    1. Mehta RS, et al. Overall survival with fulvestrant plus anastrozole in metastatic breast cancer. N. Engl. J. Med. 2019;380:1226–1234. - PMC - PubMed
    1. McGuire A, Brown JAL, Kerin MJ. Metastatic breast cancer: the potential of miRNA for diagnosis and treatment monitoring. Cancer Metastasis Rev. 2015;34:145–155. - PMC - PubMed
    1. Hayes DF. HER2 and breast cancer—a phenomenal success story. N. Engl. J. Med. 2019;381:1284–1286. - PubMed