. 2020 Oct 1:24:17.
doi: 10.1186/s40824-020-00196-1. eCollection 2020.

In vivo bone regeneration assessment of offset and gradient melt electrowritten (MEW) PCL scaffolds

Affiliations

In vivo bone regeneration assessment of offset and gradient melt electrowritten (MEW) PCL scaffolds

Naghmeh Abbasi et al. Biomater Res. .

Abstract

Background: Biomaterial-based bone tissue engineering represents a promising solution to overcome reduced residual bone volume. It has been previously demonstrated that gradient and offset architectures of three-dimensional melt electrowritten poly-caprolactone (PCL) scaffolds could successfully direct osteoblast cells differentiation toward an osteogenic lineage, resulting in mineralization. The aim of this study was therefore to evaluate the in vivo osteoconductive capacity of PCL scaffolds with these different architectures.

Methods: Five different calcium phosphate (CaP) coated melt electrowritten PCL pore sized scaffolds: 250 μm and 500 μm, 500 μm with 50% fibre offset (offset.50.50), tri layer gradient 250-500-750 μm (grad.250top) and 750-500-250 μm (grad.750top) were implanted into rodent critical-sized calvarial defects. Empty defects were used as a control. After 4 and 8 weeks of healing, the new bone was assessed by micro-computed tomography and immunohistochemistry.

Results: Significantly more newly formed bone was shown in the grad.250top scaffold 8 weeks post-implantation. Histological investigation also showed that soft tissue was replaced with newly formed bone and fully covered the grad.250top scaffold. While, the bone healing did not happen completely in the 250 μm, offset.50.50 scaffolds and blank calvaria defects following 8 weeks of implantation. Immunohistochemical analysis showed the expression of osteogenic markers was present in all scaffold groups at both time points. The mineralization marker Osteocalcin was detected with the highest intensity in the grad.250top and 500 μm scaffolds. Moreover, the expression of the endothelial markers showed that robust angiogenesis was involved in the repair process.

Conclusions: These results suggest that the gradient pore size structure provides superior conditions for bone regeneration.

Keywords: Angiogenesis; Bone tissue engineering; Melt electrowriting; Poly (ε-caprolactone); Pore size; Scaffold.


Conflict of interest statement

Competing interestsThe authors declare that they have no competing interests.

Figures

Fig. 1
Fig. 1
Schematic diagram of experimental procedures and scaffold design used for the bone regeneration study. The left panel shows the custom-built melt electrowriting device. In the middle panel, diagrammatic representation of the different scaffold structures and SEM images of 3D printed scaffolds. The right panel illustrates the uniform hydroxyapatite coating process on the surface of the porous scaffolds by soaking in SBF and subsequent implantation of the scaffolds into a calvarial defect in rats
Fig. 2
Fig. 2
Photographs of the surgical procedures whereby two circular calvarial defects were created in the rat and subsequently filled with PTFE membrane to prevent soft tissue infiltration. Then MEW scaffolds were implanted into the defect site and the defect was closed in layers using sutures. The defects were subsequently left to heal for 4 and 8 weeks (Scale bar = 5 mm)
Fig. 3
Fig. 3
Schematic of the calvarial defects and the combination of MEW scaffolds subsequently placed in vivo. To ensure sufficient material for subsequent analysis, five replicates of each scaffold for both healing time points (4 and 8 weeks) were placed
Fig. 4
Fig. 4
3-D reconstructed Micro-CT image analysis showing the degree of bone repair in the different MEW PCL scaffolds implanted into the rat calvarial, a) 4 weeks post implantation and b) 8 weeks post-surgery. Top and sagittal defect views are of the area indicated by the dashed red line (Scale bar = 1 mm)
Fig. 5
Fig. 5
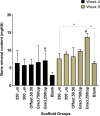
Quantitative micro-CT data analysis of BV/TV ratio. A significant difference in the BV/TV ratio was seen between grad.250top and the 250 μm scaffolds and the control after 8 weeks post-implantation, (number of samples/ group = 5) (* p ≤ 0.025). (#) indicates a significant difference between grad250top scaffold groups at the different time points of 4 and 8 weeks (p ≤ 0.034)
Fig. 6
Fig. 6
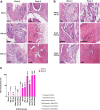
Microscope images of H&E stained tissue sections of MEW PCL scaffolds implanted in rat calvarial defects, a) 4 and b) 8 weeks (top and bottom panels respectively) after surgery. B: new bone; Black arrow: osteoblasts; BM: newly formed bone matrix; ST: Soft tissue; P: pore remaining implanted scaffold material; Blue arrow: new bone forming; Green arrow: osteocytes; Yellow arrow: osteocytes in lacuna; Asterisk: blood vessel; The black scale bar represents 200 μm. c) The percentage of newly formed bone for each group was calculated 4 and 8 weeks postoperatively using Fiji ImageJ software. The values expressed are the mean ± SD (n = 3). Statistically significant differences between the mean %bone for the treatment groups when compared to each other were determined by ANOVA (Significant: *, ^, ■, ♦, ▼, ● all p < 0.0001)
Fig. 7
Fig. 7
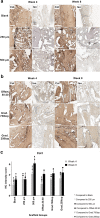
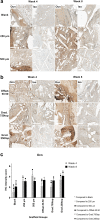
IHC analysis of Col I in calvarial defects from rats 4 and 8 weeks post-implantation of MEW PCL scaffolds. a) Blank (defect control without implanted scaffold), 250 μm, 500 μm. b) Offset.50.50, Grad.750top, Grad.250top. Col: collagen type I staining, Iso: Isotype control. The white scale bar represents 200 μm. c) Quantitative analysis of Col I staining at weeks 4 and 8. The values expressed are the mean ± SD (n = 3). Statistically significant differences between mean Col I intensity scores for the treatment groups when compared to each other were determined by ANOVA (Significant: * p ≤ 0.0001, ^ p = 0.004, ■ p ≤ 0.0001, ♦ p = 0.002, ▼p = 0.002, ● p ≤ 0.0004)
Fig. 8
Fig. 8
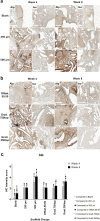
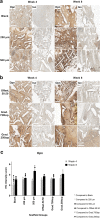
IHC analysis of Alp in calvarial defects from rats 4 and 8 weeks post-implantation of MEW PCL scaffolds. a) Blank (defect control without implanted scaffold), 250 μm, 500 μm. b) Offset.50.50, Grad.750top, Grad.250top. Alp: alkaline phosphatase staining, Iso: Isotype control. The white bar represents 200 μm. c) Quantitative analysis at weeks 4 and 8. The values expressed are the mean ± SD (n = 3). Statistically significant differences between mean Alp intensity scores for the treatment groups when compared to each other were determined by ANOVA (Significant: * p < 0.0001, ^ p = 0.002, ■ p < 0.0001, ♦ p = 0.002, ▼p = 0.001, ● p = 0.009)
Fig. 9
Fig. 9
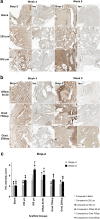
IHC analysis of Bmp-2 in calvarial defects from rats 4 and 8 weeks post-implantation of MEW PCL scaffolds. a) Blank (defect control without implanted scaffold), 250 μm, 500 μm. b) Offset.50.50, Grad.750top, Grad.250top. Bmp-2: bone morphogenic protein-2 staining, Iso: Isotype control. The white bar represents 200 μm. c) Quantitative analysis at weeks 4 and 8. The values expressed are the mean ± SD (n = 3). Statistically significant differences between Bmp-2 intensity scores for the treatment groups when compared to each other were determined by ANOVA (Significant: * p < 0.0001, ^ p = 0.009, ■ p = 0.005, ♦ p = 0.002, ▼p = 0.005, ● p < 0.0001)
Fig. 10
Fig. 10
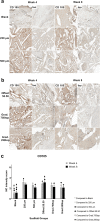
IHC analysis of Ocn in calvarial defect of rat 4 and 8 weeks of post-implantation of the MEW PCL scaffolds. a) Blank (defect control without implanted scaffold), 250 μm, 500 μm. b) Offset.50.50, Grad.750top, Grad.250top. Ocn: osteocalcin staining, Iso: Isotype control.. The white bar represents 200 μm. c) Quantitative analysis at weeks 4 and 8. The values expressed are the mean ± SD (n = 3). Statistically significant differences between mean Ocn intensity scores for the treatment groups when compared to the other groups were determined byby ANOVA (Significant: * p < 0.0001, ^ p = 0.004, ■ p < 0.0001, ♦ p = 0.006, ▼p < 0.0001, ● p = 0.002)
Fig. 11
Fig. 11
IHC analysis of Opn in calvarial defect of rat 4 and 8 weeks of post-implantation of the MEW PCL scaffolds. a) Blank (defect control without implanted scaffold), 250 μm, 500 μm. b) Offset.50.50, Grad.750top, Grad.250top. Opn: Osteopontin staining, Iso: Isotype control. The white bar represents 200 μm.c) Quantitative analysis at weeks 4 and 8. The values expressed are the mean ± SD (n = 3). Statistically significant differences between mean Opn intensity scores for the treatment groups when compared to the other groups were determined by ANOVA (Significant: * p < 0.0001, ^ p = 0.0004, ■ p < 0.0001, ♦ p = 0.0006, ▼p = 0.0004, ● p = 0.002)
Fig. 12
Fig. 12
IHC analysis of CD34 in calvarial defect of rat 4 and 8 weeks of post-implantation of the MEW PCL scaffolds. a) Blank (defect control without implanted scaffold), 250 μm, 500 μm. b) Offset.50.50, Grad.750top, Grad.250top. CD34: CD34 staining, Iso: Isotype control. The white bar represents 200 μm. c) Quantitative analysis at weeks 4 and 8. The values expressed are the mean ± SD (n = 3). Statistically significant differences between mean CD34 intensity scores for the treatment groups when compared to the other groups were determined by ANOVA (Significant: * p < 0.0001, ^ p < 0.0001, ■ p = 0.0007, ♦ p < 0.0001, ▼ p < 0.0001, ● p < 0.0001)
Fig. 13
Fig. 13
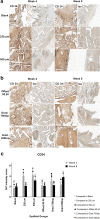
IHC analysis of CD105 in calvarial defect of rat 4 and 8 weeks of post-implantation of the MEW PCL scaffolds. a) Blank (defect control without implanted scaffold), 250 μm, 500 μm. b) Offset.50.50, Grad.750top, Grad.250top. CD105: endoglin staining, Iso: Isotype control. The white bar represents 200 μm. c) Quantitative analysis at weeks 4 and 8. The values expressed are the mean ± SD (n = 3). Statistically significant differences between mean CD105 intensity scores for the treatment groups when compared to each other were determined by ANOVA (Significant: * p < 0.0001, ^ p < 0.0001, ■ p = 0.0006, ♦ p = 0.002, ▼p = 0.002, ● p = 0.0006)
Fig. 14
Fig. 14
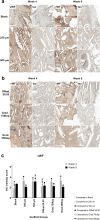
IHC analysis of VEGF, in calvarial defect of rat 4 and 8 weeks of post-implantation of the MEW PCL scaffolds. a) Blank (defect control without implanted scaffold), 250 μm, 500 μm. b) Offset.50.50, Grad.750top, Grad.250top. VEGF: vascular endothelial growth factor staining, Iso: Isotype control. The white bar represents 200 μm. c) Quantitative analysis at weeks 4 and 8. The values expressed are the mean ± SD (n = 3). Statistically significant differences between mean VEGF intensity scores for the treatment groups when compared to the other groups were determined by ANOVA (Significant: * p = 0.002, ^ p = 0.009, ■ p = 0.002, ♦ p = 0.001, ▼p = 0.042, ● p = 0.037)
Fig. 15
Fig. 15
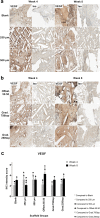
IHC analysis of vWF in calvarial defect of rat 4 and 8 weeks of post-implantation of the MEW PCL scaffolds. a) Blank (defect control without implanted scaffold), 250 μm, 500 μm. b) Offset.50.50, Grad.750top, Grad.250top. vWF: von Willebrand Factor staining, Iso: Isotype control. The white bar represents 200 μm. c) Quantitative analysis at weeks 4 and 8. The values expressed are the mean ± SD (n = 3). Statistically significant differences between mean vWF intensity scores for the treatment groups when compared to the other groups were determined by ANOVA (Significant: * p < 0.0001, ^ p = 0.002, ■ p = 0.003, ♦ p = 0.001, ▼p = 0.015, ● p = 0.003)

Similar articles

Cited by

References

    1. Tao O, Kort-Mascort J, Lin Y, Pham HM, Charbonneau AM, ElKashty OA, et al. The applications of 3D printing for craniofacial tissue engineering. Micromachines-Basel. 2019;10(7):480. doi: 10.3390/mi10070480. - DOI - PMC - PubMed
    1. Rohman G, Langueh C, Ramtani S, Lataillade JJ, Lutomski D, Senni K, et al. The use of platelet-rich plasma to promote cell recruitment into low-molecular-weight Fucoidan-functionalized poly(Ester-urea-urethane) scaffolds for soft-tissue engineering. Polymers-Basel. 2019;11(6):1016. doi: 10.3390/polym11061016. - DOI - PMC - PubMed
    1. Barati D, Karaman O, Moeinzadeh S, Kader S, Jabbari E. Material and regenerative properties of an osteon-mimetic cortical bone-like scaffold. Regen Biomater. 2019;6(2):89–98. doi: 10.1093/rb/rbz008. - DOI - PMC - PubMed
    1. Chocholata P, Kulda V, Babuska V. Fabrication of scaffolds for bone-tissue regeneration. Materials. 2019;12(4):568. doi: 10.3390/ma12040568. - DOI - PMC - PubMed
    1. Woodruff MA, Hutmacher DW. The return of a forgotten polymer-Polycaprolactone in the 21st century. Prog Polym Sci. 2010;35(10):1217–1256. doi: 10.1016/j.progpolymsci.2010.04.002. - DOI