

Fluorescence imaging and Raman spectroscopy applied for the accurate diagnosis of breast cancer with deep learning algorithms
- PMID: 33014559
- PMCID: PMC7510916
- DOI: 10.1364/BOE.394772
Fluorescence imaging and Raman spectroscopy applied for the accurate diagnosis of breast cancer with deep learning algorithms
Abstract
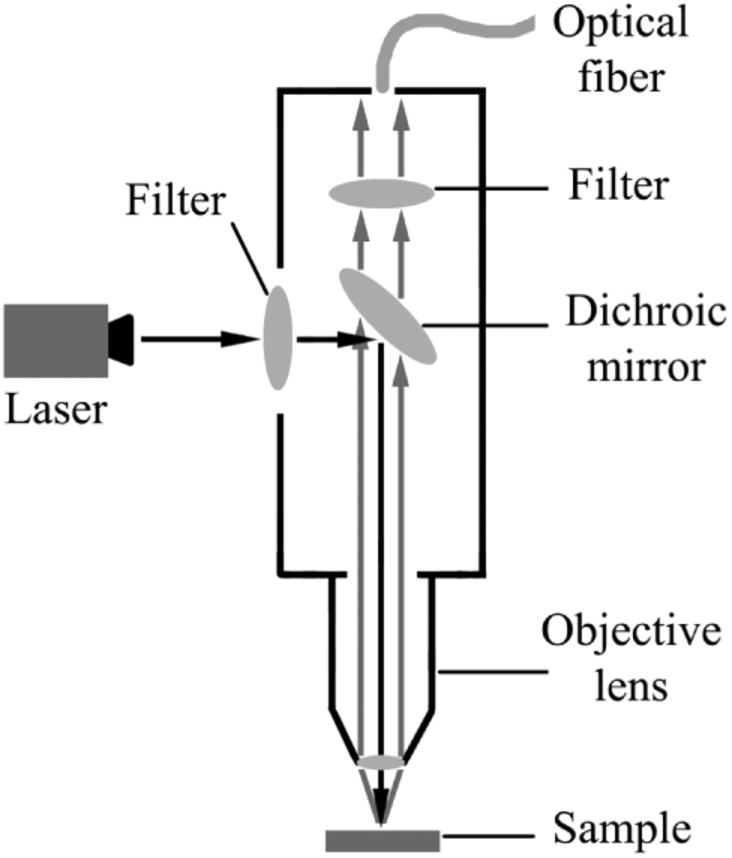
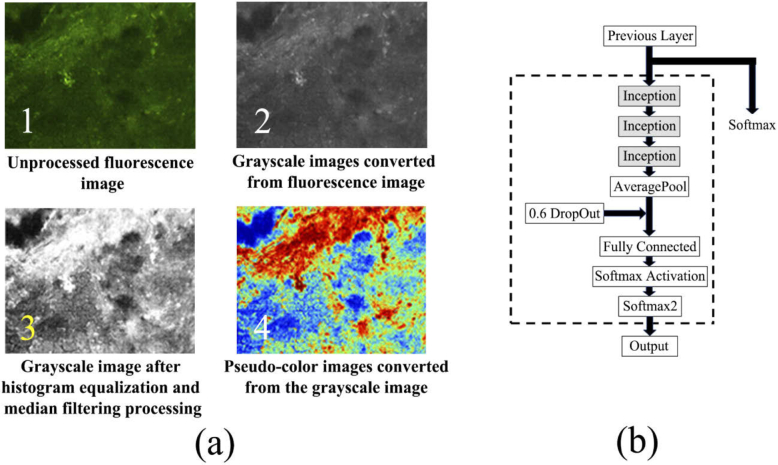
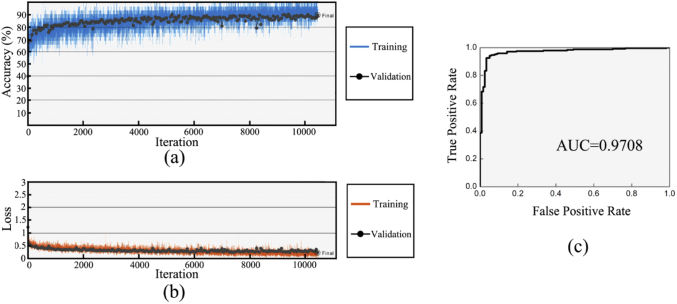
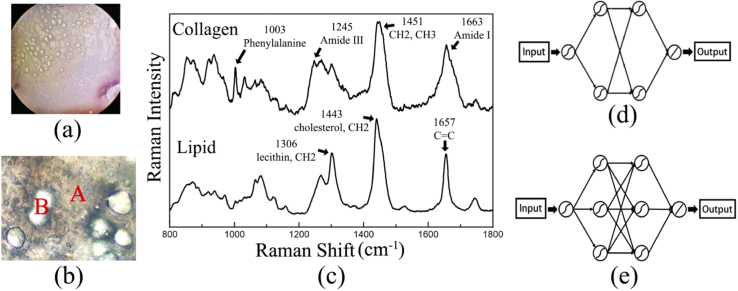
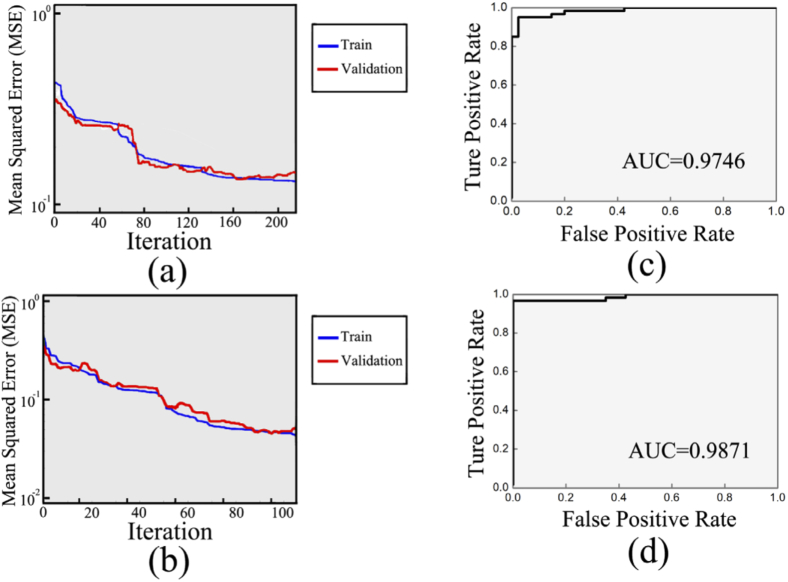
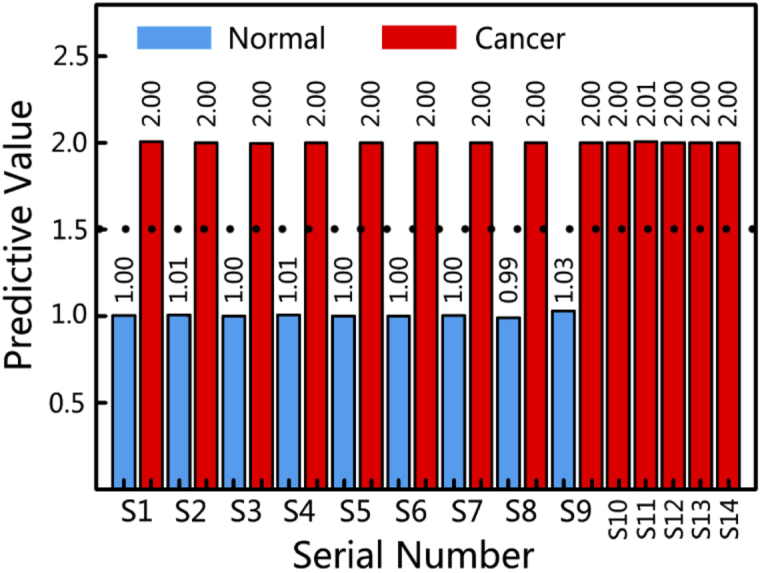
Deep learning is usually combined with a single detection technique in the field of disease diagnosis. This study focused on simultaneously combining deep learning with multiple detection technologies, fluorescence imaging and Raman spectroscopy, for breast cancer diagnosis. A number of fluorescence images and Raman spectra were collected from breast tissue sections of 14 patients. Pseudo-color enhancement algorithm and a convolutional neural network were applied to the fluorescence image processing, so that the discriminant accuracy of test sets, 88.61%, was obtained. Two different BP-neural networks were applied to the Raman spectra that mainly comprised collagen and lipid, so that the discriminant accuracy of 95.33% and 98.67% of test sets were gotten, respectively. Then the discriminant results of fluorescence images and Raman spectra were counted and arranged into a characteristic variable matrix to predict the breast tissue samples with partial least squares (PLS) algorithm. As a result, the predictions of all samples are correct, with minor error of predictive value. This study proves that deep learning algorithms can be applied into multiple diagnostic optics/spectroscopy techniques simultaneously to improve the accuracy in disease diagnosis.
© 2020 Optical Society of America under the terms of the OSA Open Access Publishing Agreement.
Conflict of interest statement
The authors declare that there are no conflicts of interest related to this article.
Figures
References
-
- Kovama Y., Yoshizawa M., Manba N., Hasegawa M., Hatakeyama K., “The frozen section is superior to imprint cytology for intraoperative diagnosis of sentinel node biopsy for breast cancer,” Eur. J. Cancer Suppl. 6(7), 151 (2008). 10.1016/S1359-6349(08)70664-5 - DOI
-
- Kurosumi M., “Recent trends in pathological diagnosis of breast cancer,” J. Nihon rinsho. 64(3), 451–460 (2006). - PubMed
LinkOut - more resources
Full Text Sources
Research Materials