Review
. 2020 Oct;10(10):2030-2065.
doi: 10.21037/qims-20-795.

New options for increasing the sensitivity, specificity and scope of synergistic contrast magnetic resonance imaging (scMRI) using Multiplied, Added, Subtracted and/or FiTted (MASTIR) pulse sequences

Affiliations
Review

New options for increasing the sensitivity, specificity and scope of synergistic contrast magnetic resonance imaging (scMRI) using Multiplied, Added, Subtracted and/or FiTted (MASTIR) pulse sequences

Ya-Jun Ma et al. Quant Imaging Med Surg. 2020 Oct.

Abstract

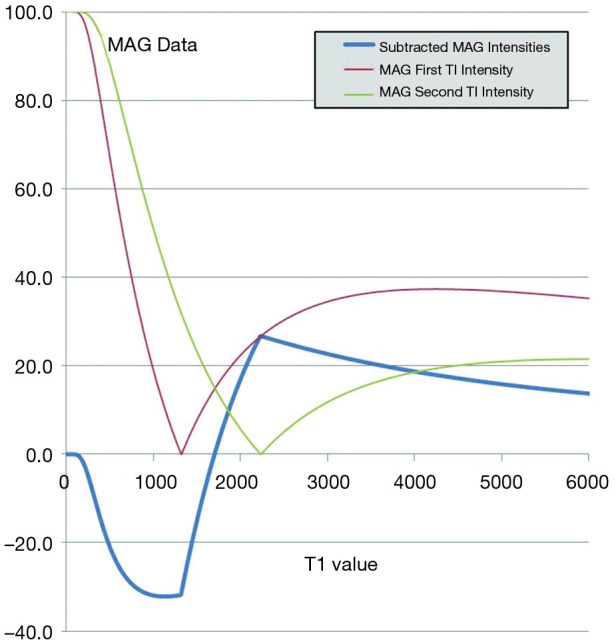
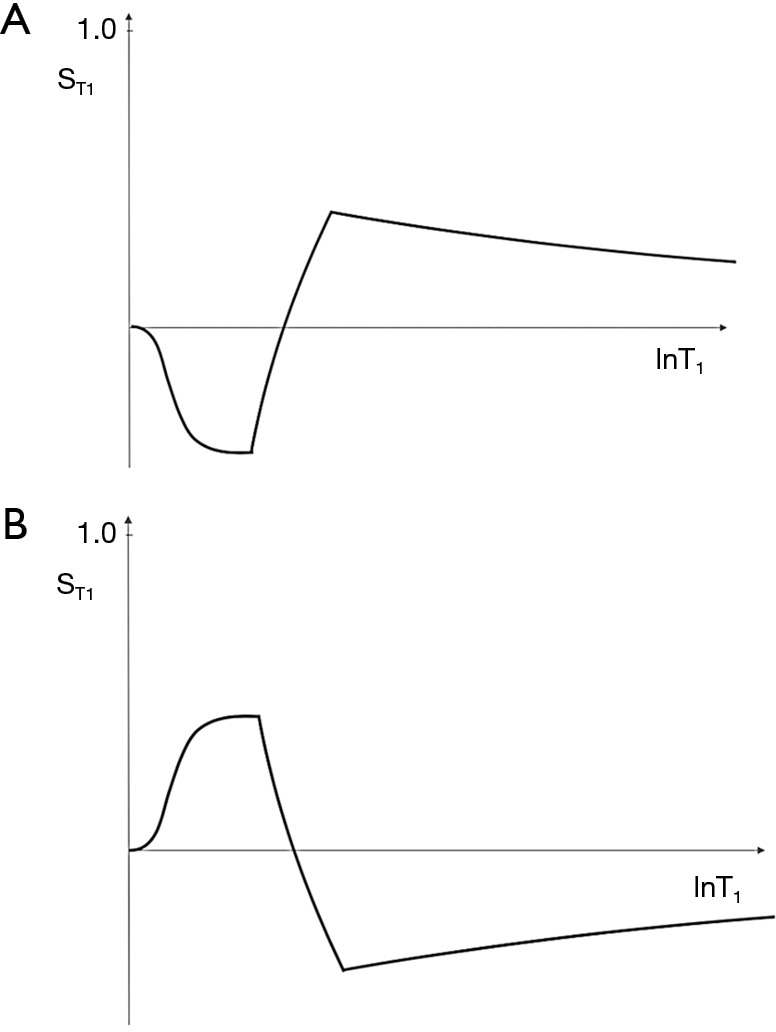
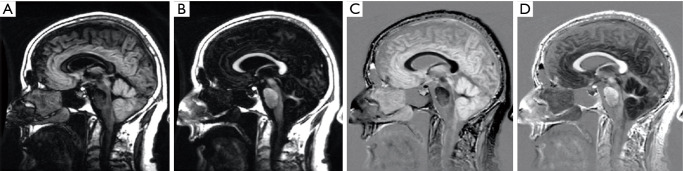
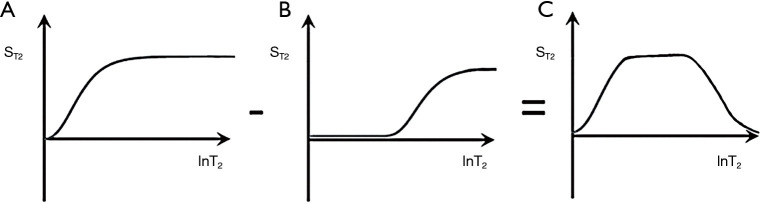
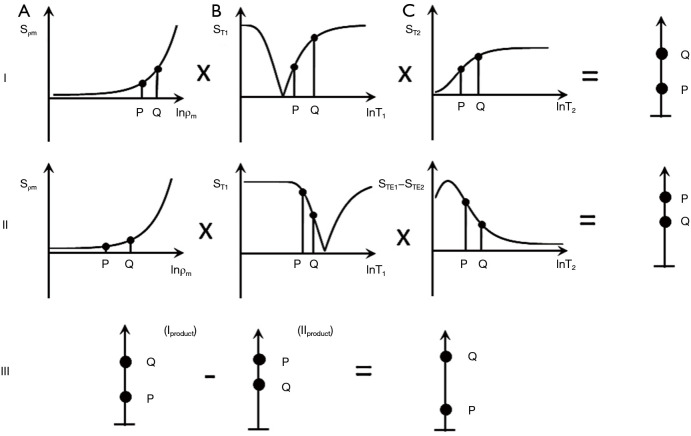
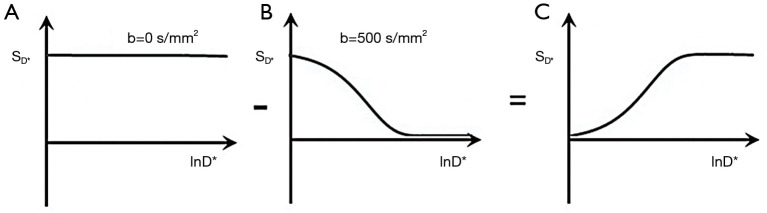
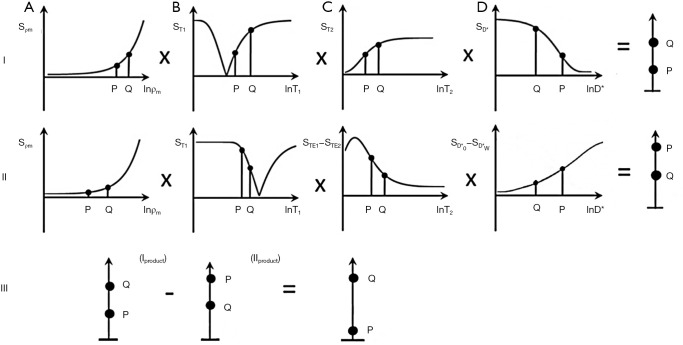
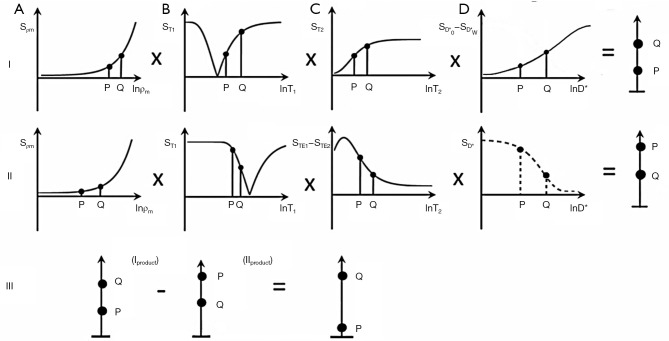
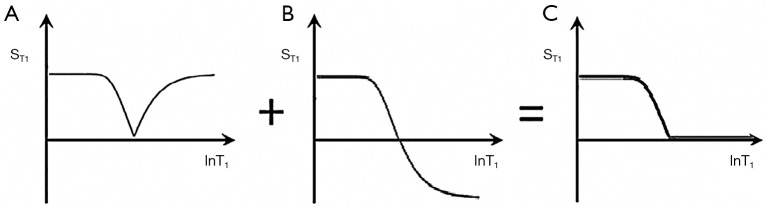
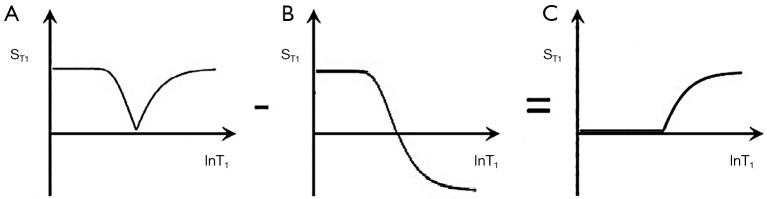
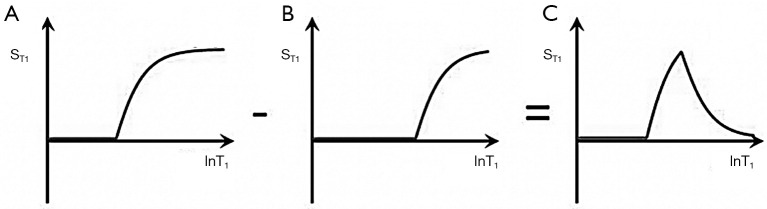
This paper reviews magnetic resonance (MR) pulse sequences in which the same or different tissue properties (TPs) such as T1 and T2 are used to contribute synergistically to lesion contrast. It also shows how synergistic contrast can be created with Multiplied, Added, Subtracted and/or fiTted Inversion Recovery (MASTIR) sequences, and be used to improve the sensitivity, specificity and scope of clinical magnetic resonance imaging (MRI) protocols. Synergistic contrast can be created from: (i) the same TP, e.g., T1 used twice or more in a pulse sequence; (ii) different TPs such as ρm, T1, T2, and D* used once or more within a sequence, and (iii) additional suppression or reduction of signals from tissues and/or fluids such as fat, long T2 tissues and cerebrospinal fluid (CSF). The short inversion time (TI) inversion recovery (IR) (STIR) and double IR (DIR) sequences usually show synergistic positive contrast for lesions which have increases in both T1 and T2. The diffusion weighted pulsed gradient spin echo (PGSE) sequence shows synergistic contrast for lesions which have an increase in T2 and a decrease in D*; the sequence is both positively weighted for T2 and negatively weighted for D*. In the brain, when an IR sequence nulling white matter has subtracted from it an IR sequence nulling gray matter to form the subtracted IR (SIR) sequence, increases in the single TP T1 between the two nulling points of the original two sequences generate high synergistic positive contrast. In addition, the subtraction to produce the SIR sequence reduces fat and CSF signals. To provide high sensitivity to changes in TPs in disease the SIR sequence can be used (i) alone to provide synergistic T1 contrast as above; (ii) with T2-weighting to provide synergistic T1 and T2 contrast, and (iii) with T2- and D*-weighting to provide synergistic T1, T2, and D* contrast. The SIR sequence can also be used in reversed form (longer TI form minus shorter TI form) to produce very high positive synergistic T1 contrast for reductions in T1, and so increase the positive contrast enhancement produced by clinical gadolinium-based contrast agents (GBCAs) when they reduce T1. The specificity of MRI examinations can be improved by using the reversed SIR sequence with a long echo time (TE) gradient echo as well as echo subtraction to show synergistic high contrast from T1 and T2* shortening produced by organic iron. Other added and subtracted forms of the MASTIR sequence can be used synergistically to selectively show myelin, myelin water and fluids including blood and CSF. Protocols using MASTIR sequences to provide synergistic contrast in MRI of the brain, prostate and articular cartilage are included as illustrative examples, and the features of synergistic contrast MRI (scMRI) are compared to those of multiparametric MRI (mpMRI) and functional MRI (fMRI).

Keywords: Magnetic resonance imaging (MRI); Multiplied, Added, Subtracted and/or fiTted Inversion Recovery sequences (MASTIR sequences); articular cartilage; brain; contrast agents; prostate; pulse sequences; synergistic contrast MRI (scMRI).


Conflict of interest statement

Conflicts of Interest: All authors have completed the ICMJE uniform disclosure form (available at http://dx.doi.org/10.21037/qims-20-795). JD serves as an unpaid editorial board member of Quantitative Imaging in Medicine and Surgery. The other authors have no conflicts of interest to declare.

Figures

Figure 1
Figure 1
Composite diagram for the SE sequence. This shows recovery of the Mz for time TR, followed by decay of the transfer magnetization (Mxy) for time TE after the 90° pulse, for a short T1 short T2 tissue P, and a longer T1 longer T2 tissue Q. The contrast between the two tissues is proportional to the difference between the two curves (vertical line) at time TE during the dc. SE, spin echo; TR, repetition time; TE, echo time; Mz, longitudinal magnetization; dc, data collection.
Figure 2
Figure 2
The SE T1-filter sequence. Relationship between change in lnT1 (=ΔT1/T1) and change in signal (or contrast Cab) ΔST1. The positive difference ΔlnT1 = ΔT1/T1 from P to Q along the X axis produces a negative change in signal ΔST1 from P to Q along the Y axis in a region where the T1-filter is steeply sloping. This is the absolute contrast Cab. The change ΔlnT1 would produce little or no contrast if it was opposite either the high or the low signal plateau regions of the filter. The slope of the curve between P and Q which is the sequence weighting is negative. SE, spin echo.
Figure 3
Figure 3
The SE sequence T2-filter. Plot of ST2 against lnT2 for two tissues, P and Q. The positive difference ΔlnT2 = ΔT2/T2 from P to Q along the X axis produces a positive difference in signal (or contrast Cab) ΔST2 from P to Q along the Y axis where it corresponds with a sloping region of the T2-filter. Little or no difference in signal would be produced by ΔlnT2 if it was opposite either the upper or the lower flat regions of the curve. The slope of the T2-filter between P and Q is its sequence weighting which is positive. SE, spin echo.
Figure 4
Figure 4
The SE sequence showing its ρm-filter (A), T1-filter (B) and T2-filter (C). Using a logTP scale the ρm-filter is exponential, the T1-filter is a low pass sigmoid and the T2-filter is a high pass sigmoid. The signals which P and Q produce with each filter in (A), (B) and (C) are multiplied together to give the overall contrast shown at the right of the diagram. The slopes of ρm, T1 and T2-filters from P to Q are their respective sequence weightings. They are positive for ρm, negative for T1 and positive for T2. The contrast produced in changing positively from P to Q along the X axis is positive for the ρm-filter, negative for the T1-filter and positive for the T2-filter. SE, spin echo; TP, tissue property.
Figure 5
Figure 5
Long TR IR sequence T1-filters with ps (A) and m (B) reconstructions. The T1-filter in (A) has high and low plateaus with a sloping region between. It has twice the range (+1 to −1), and twice the slope of the corresponding SE T1-filter. The T1-filter in (B) is the same as (A) up to the zero, or null point. Beyond this, it is a mirror reflection across the X axis of the curve shown in (A). The slope of the filter shown in (A) is negative, and that shown in (B) is negative up to the null point after which it becomes positive. TR, repetition time; IR, inversion recovery; SE, spin echo; ps, phase sensitive; m, magnitude.
Figure 6
Figure 6
The long TR IR sequence. Plots of ST1 against lnT1 of the IR T1-filters for short TIs (A), intermediate TIi (B), and long TIl (C) IR sequences. The positions of white matter (W) and gray matter (G) of the brain along the X axis are shown, and are fixed in (A), (B) and (C). In (A) (the STIR sequence), G is higher signal than W. In (B) (the intermediate TIi sequence) the filter is shifted to the right and W is higher signal than G, and in (C), the long TIl filter (e.g., the T2-FLAIR sequence) the filter is further shifted to the right and W is slightly higher signal than G. These are the three main classes of the long TR IR sequence. The slope of the filter between W and G which is the sequence weighting is highly positive in (A), highly negative in (B), and mildly negative in (C). TR, repetition time; IR, inversion recovery; SE, spin echo; STIR, short inversion time inversion recovery; FLAIR, FLuid Attenuated inversion recovery.
Figure 7
Figure 7
The D*-filter of the PGSE sequence. Plot of SD* against lnD*. Positive change in D* from P to Q ΔD*/D* along the X axis produces negative change from P to Q ΔSD* along the Y axis. This is Cab. The filter is a negative exponential with a negative slope. Cab is maximized where b = 1/D*. Increase in TE increases b and shifts the filter to the left. PGSE, pulsed gradient spin echo.
Figure 8
Figure 8
STIR sequence (1985) (1). Plot of Sρm vs. lnρm (A), ST1 vs. lnT1 using m reconstruction (B) and ST2 vs. lnT2 (C) for the short TIs STIR sequence. The slopes of the three TP-filters from P to Q are all positive. Increase from P to Q in (A), (B) and (C) results in an increase in signal, i.e., positive contrast. The effect on overall contrast is synergistic with the contributions from the changes in T1 and T2 usually greater than that from ρm. TI, inversion time; STIR, short inversion time inversion recovery.
Figure 9
Figure 9
Contrast enhanced CT (A) and STIR (B) sequences (1985) (1). Frontoparietal astrocytoma grade II: contrast enhanced CT (A) and STIR (B) (TR =1,000 ms, TR =100 ms, TE =44 ms) scans (1985). The tumor shows a mass effect with displacement of the falx to the right in (A) but appears much more extensive in (B) (arrows). This includes extensive involvement of the right centrum semiovale. CT, computed tomography; STIR, short inversion time inversion recovery; TR, repetition time; TE, echo time.
Figure 10
Figure 10
Psoas abscess. Contrast enhanced CT (A) and STIR (B) sequence (1985) (1). There is extensive involvement of the left abdominal wall in both (A) and (B). The psoas abscess is only seen on (B) (arrow). CT, computed tomography; STIR, short inversion time inversion recovery.
Figure 11
Figure 11
T1-weighted SE (A) and STIR (B) sagittal image of lymphoma involving the femur (1985) (1). The tumor is not easily differentiated from the yellow bone marrow in (A) but suppression of the signal from the marrow makes the tumor obvious in (B) (arrows). SE, spin echo; STIR, short inversion time inversion recovery.
Figure 12
Figure 12
The DIR sequence. (A) is the T1-filter nulling CSF, (B) is the T1-filter nulling white matter W and (C) is (A) multiplied by (B) in which both W and CSF are nulled. The sequence weighting is the slope of the T1-filter. It is zero, negative and positive for different values of T1. DIR, double inversion recovery; CSF, cerebrospinal fluid.
Figure 13
Figure 13
Glioma of the corpus callosum and frontal lobes (1985) (1). SE (TR =1,500 ms, TE =80 ms) (A) and DIR (TR =3,000 ms, TI1 =1,200 ms, TI2 =100 ms, TE =44 ms) (B) scans. The bilateral frontal tumor is seen on both scans. Both fat and CSF fluid signals are suppressed in (B). SE, spin echo; TR, repetition time; TE, echo time; TI, inversion time; DIR, double inversion recovery.
Figure 14
Figure 14
DIR scan of the brain nulling white matter and CSF (1994) (2). The DIR sequence shows gray matter with no signal from white matter or CSF. (courtesy FW Smith). DIR, double inversion recovery; CSF, cerebrospinal fluid.
Figure 15
Figure 15
Acute neonatal infarction: T2-weighted SE (A) and PGSE (B) scans. The infarction is just visualized in (A) but is obvious in (B) (arrows) as a consequence of its reduced D*. SE, spin echo; PGSE, pulsed gradient spin echo.
Figure 16
Figure 16
Probable metastasis (1991) (15). Coronal SE 1,500/80 ms (A), SE 1,500/130 ms (B) and SE 15,00/130 ms (b =550 s/mm2) (C) scans. The central tumor and surrounding edema are high signal and isointense on the b = “0” image in (B). The central tumor is high signal on the diffusion sensitized image (C) (arrows) and the surrounding edema is lower signal. This is consistent with a reduced D* for the tumor and an increased D* for the edema. SE, spin echo.
Figure 17
Figure 17
Left astrocytoma grade III extending to the right across the corpus callosum (1991) (15). SE 1,500/80 (A), SE 1,500/130 (b = “0” s/mm2) (B), PGSE 1,500/130 (b =550 s/mm gradient left to right) (C) and PGSE 1,500/130 (b =550 s/mm gradient anterior to posterior) (D) scans. The left hemispheric tissue is high signal without differentiation from associated vasogenic edema consistent with an increase in D*. The extension across the corpus callosum is seen in (A) (arrow), not well seen in (C) with gradients parallel to the corpus callosum fibers, but is apparent in (D) (arrow) with the gradient perpendicular to the corpus callosum fibers. This shows the effect of fiber anisotropy on the visualization of disease. The normal value of D* is higher with fibers parallel to the gradient than across and this may overlap with abnormal values of D*. SE, spin echo; PGSE, pulsed gradient spin echo.
Figure 18
Figure 18
MASTIR sequences: classification. *, included in both the subtracted and fitted categories.
Figure 19
Figure 19
T1-filter for SIR (mTIs − mTIi) filter. An m reconstructed intermediate TI (TIi) (green image is subtracted from a m reconstructed short TI (TIs) image (red). The difference image (blue) shows that for T1s in the range between the null points of the two TIs there is a very high positive slope or sequence weighting. The slope of the subtracted curve in this range is greater than that of either of the two original images. This leads to high positive contrast for increases in T1 values in the range between two nulling points of the short and intermediate TI sequences. SIR, subtracted inversion recovery; TI, inversion time; MAG, magnitude.
Figure 20
Figure 20
T1-filter for SIR (mTIs − mTIi) (A) and reversed rSIR (mTIi − mTIs) (B). Between the null points for TIs and TIi the T1-filter in (A) has a marked positive slope while the T1-filter in (B) has a marked negative slope. In (B) reductions in T1 from the intermediate TIi null point produce marked increases in signal. This occurs with T1 shortening due to GBCAs or iron deposition. SIR, subtracted inversion recovery; TI, inversion time; rSIR, reversed subtraction inversion recovery; GBCAs, gadolinium-based contrast agents.
Figure 21
Figure 21
Sagittal images of a normal brain. mTIs nulling white matter (A), mTIi nulling gray matter (B), SIR (mTIs − mTIi) in (C) and rSIR (mTIi − mTIs) in (D). There is high gray white matter contrast with gray matter high signal and white matter low signal in (C). In (D) the gray white matter contrast is reversed with white matter white, and gray matter black. CSF is of intermediate signal near the noise level in both (C) and (D). SIR, subtracted inversion recovery; TI, inversion time; rSIR, reversed subtraction inversion recovery; CSF, cerebrospinal fluid.
Figure 22
Figure 22
The echo subtraction (ES) T2-filter. Subtraction from an ultrashort TE image (TEu) of an intermediate TEi. This results in a broad band pass filter. For medium T2 values the slope of the curve is negative and this is the reverse of the usual SE sequence weighting. TE, echo time.
Figure 23
Figure 23
SIR echo subtraction (SIRES) sequence (multivariate model). The ρm, T1 and T2-filters for a short TIs sequence are shown in the top row (I). For an increase in ρm, T1 and T2 from P to Q this results in an increase in signal from P to Q in each filter, and multiplication of each of the filters shows high positive contrast from P to Q (right hand side). In the middle row (II) an intermediate TIi is used and the T1-filter sequence weighting from P to Q is negative. The ES T2-filter (STE1-STE2) is also negative from P to Q. The multiplied result shows negative contrast from P to Q (right hand side). The bottom row (III) shows normalized subtraction of the signals from P and Q in the middle row (II product) from the corresponding signals in the first row (I product). This creates higher positive contrast from P to Q than from the top row alone.
Figure 24
Figure 24
The diffusion subtraction (DS) D*-filter. Subtraction of the b =500 s/mm2 filter (B) from the b =0 s/mm2 filter (A) produces (C) which reverses the sequence weighting shown in (B) so that an increase in D* increases the signal on the subtracted D*-filter in (C). This can be used to make D* contrast synergistic with the contrast produced by increases in ρm and T2 when D* is increased.
Figure 25
Figure 25
The Subtracted IR Diffusion Echo Subtraction (SIRDES) sequence for an increase in ρm, T1 and T2 with a decrease in D* from P to Q. The TP-filters for the sequence are shown in the top (I) and middle (II) rows. In the top row, a short TIs is used so that increases in ρm, T1 and T2 as well as a decrease in D* from P to Q result in positive contrast for each of the four filters, and the product of the signals (far right) shows positive contrast from P to Q. In the middle row (II), with an intermediate TIi an increase in T1 from P to Q results in negative contrast. An ES T2-filter is used to produce negative contrast for an increase in T2 from P to Q. The D*-filter also shows negative contrast for the decrease in D* from P to Q. Multiplication (far right) shows negative contrast from P to Q. In the bottom row (III) subtraction of the product in row II from the product in row I increases the positive contrast from P to Q even further compared to that in row I alone. ES, echo subtraction.
Figure 26
Figure 26
The SIRDES sequence for an increase in each of ρm, T1, T2 and D* from P to Q. In row I using a short TIs T1-filter, conventional T2-filter and DS filter, the increases in ρm, T1, T2 and D* result in synergistic positive contrast from P to Q shown on the right. In row II, using an intermediate TIi T1-filter for T1 and an ES filter for T2 result in synergistic negative contrast from P to Q as shown on the right. It is not possible to retain the negative D* weighting and reverse the T2 contrast since this would require a heavily diffusion weighted sequence with a short or ultrashort TE. The D*-filter in this row is therefore only shown in dashed line form. In row III, subtraction of the product in row II from the product in row I results in higher positive contrast from P to Q than in row I alone. SIRDES, subtracted inversion recovery diffusion and echo subtraction; ES, echo subtraction.
Figure 27
Figure 27
AIR sequence: T1-filter for an AIR (psTIs/i/l + mTIs/i/l) sequence. The ps sequence at any short, intermediate or long TI (TIs/i/l) (A) is added to the m reconstructed version of the same sequence with the same TI to give a low pass T1-filter in (C). The ST1 values are normalized in this filter. In (C) signal is seen from shorter values of T1, there is then a transition band as T1 increases, and no signal is seen for longer values of T1. AIR, added inversion recovery; TI, inversion time; ps, phase sensitive.
Figure 28
Figure 28
T1-filter for subtracted inversion recovery (SIR) (mTIs/i/l − psTIs/i/l) sequence. The m sequence (A) at any short, intermediate or long TI (TIs, TIi, TIl) has subtracted from it the corresponding ps sequence with the same TI. This results in a (normalized) high pass T1-filter (C). With this filter short T1 values are zero. There is a transition band as T1 increases and higher signals are seen as T1 increases further. TI, inversion time; m, magnitude; ps, phase sensitive.
Figure 29
Figure 29
Subtracted SIR [S2IR (mTIs/i − psTIs/i) – (mTIl − psTIl)] sequence. The high pass filter in (B) with a long TIl produced by subtracting a ps image from an m image, is subtracted from the high pass filter in (A) which has a short or intermediate TI (TIs or TIi). This gives the band pass filter shown in (C). With longer values of TI this could be used to selectively image blood. SIR, subtracted inversion recovery; TI, inversion time; m, magnitude; ps, phase sensitive.

Similar articles

Cited by

References

    1. Bydder GM, Young IR. Clinical use of the inversion recovery sequence. J Comput Assist Tomogr 1985;9:659-75. 10.1097/00004728-198507010-00002 - DOI - PubMed
    1. Redpath TW, Smith FW. Technical note: use of a double inversion recovery pulse sequence to image selectively gray or white brain matter. Br J Radiol 1994;67:1258-63. 10.1259/0007-1285-67-804-1258 - DOI - PubMed
    1. Young IR, Szeverenyi NM, Du J, Bydder GM. Pulse sequences as Tissue Property filters (TP-filters): A way of understanding the signal, contrast and weighting of Magnetic Resonance Images. Quant Imaging Med Surg 2020;10:1080-120. 10.21037/qims.2020.04.07 - DOI - PMC - PubMed
    1. Ma YJ, Fan S, Shao H, Du J, Szeverenyi NM, Young IR, Bydder GM. Clinical use of Multiplied, Added, Subtracted and/or fiTtedInversion Recovery (MASTIR) pulse sequences. Quant Imaging Med Surg 2020;10:1334-69. 10.21037/qims-20-568 - DOI - PMC - PubMed
    1. Hawkes RC, Holland GN, Moore WS, Worthington BS. Nuclear magnetic resonance (NR) tomography of the brain: a preliminary clinical assessment with demonstration of pathology. J Comput Assist Tomogr 1980;4:577-86. 10.1097/00004728-198010000-00001 - DOI - PubMed