

Fibrinogen/Albumin Ratio Index Is an Independent Prognosis Predictor of Recurrence-Free Survival in Patients After Surgical Resection of Gastrointestinal Stromal Tumors
- PMID: 33014783
- PMCID: PMC7462001
- DOI: 10.3389/fonc.2020.01459
Fibrinogen/Albumin Ratio Index Is an Independent Prognosis Predictor of Recurrence-Free Survival in Patients After Surgical Resection of Gastrointestinal Stromal Tumors
Abstract
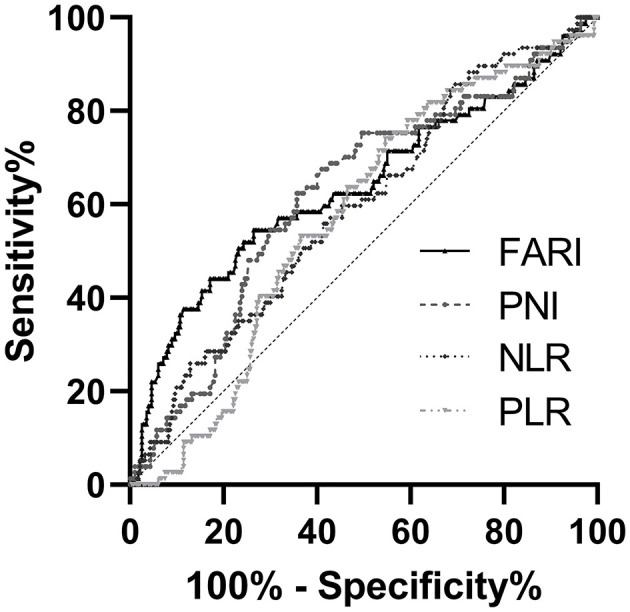
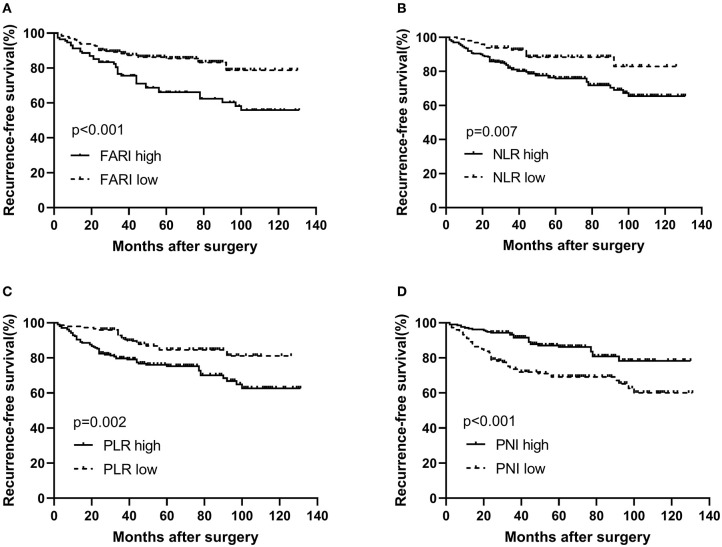
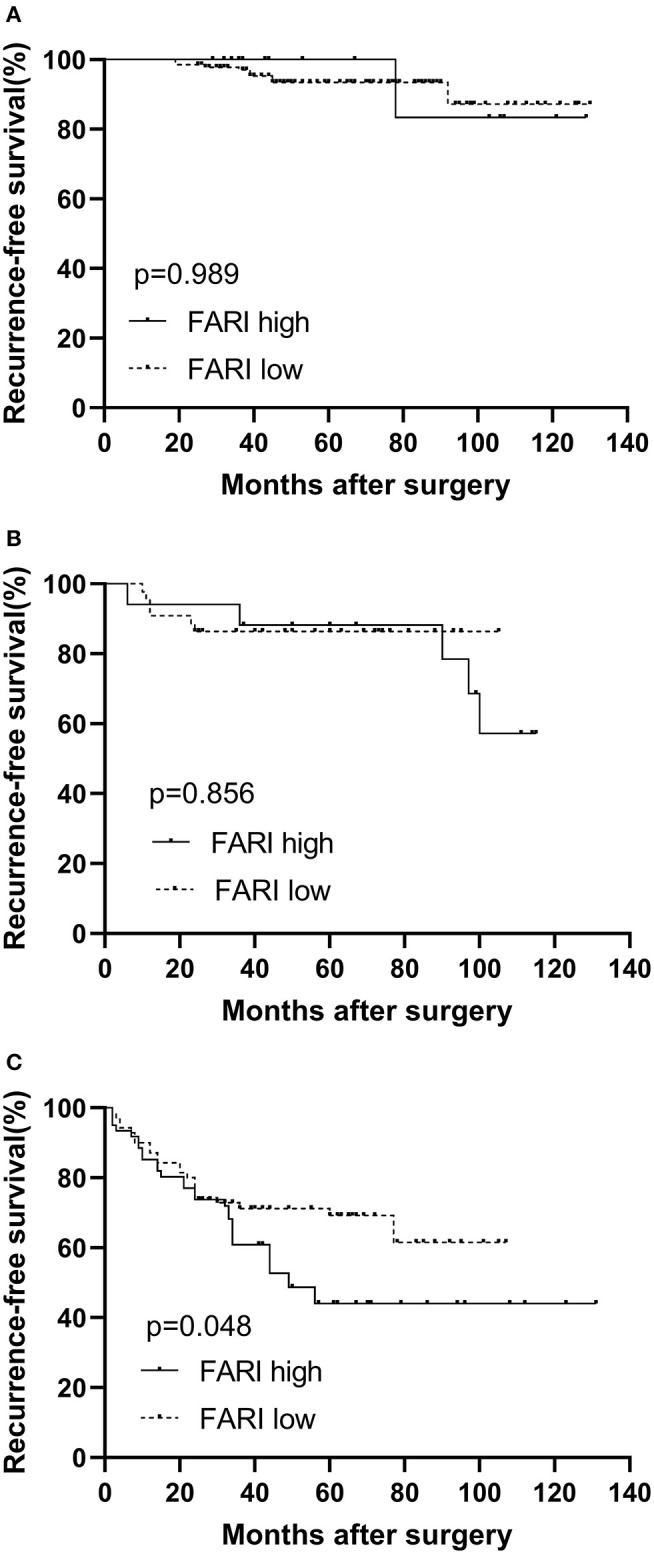
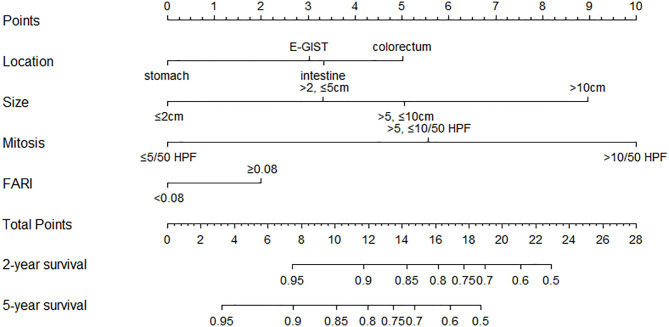
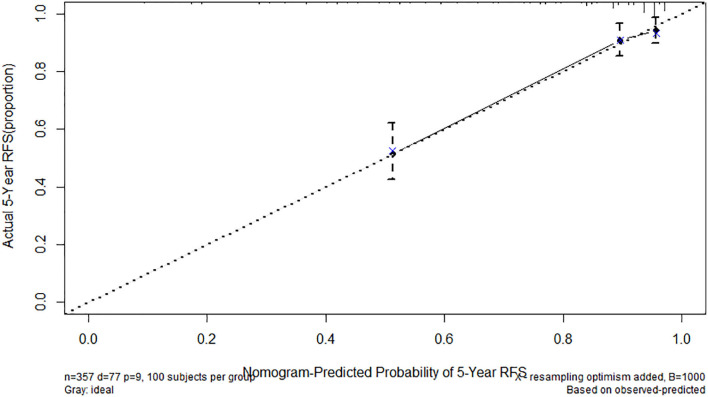
Background: Nutritional status, systemic inflammation, and coagulation mechanism are closely related to tumor progression. Herein, we examined the role of fibrinogen-to-albumin ratio index (FARI) in the prognosis of gastrointestinal stromal tumors (GISTs) and developed a novel nomogram predicting recurrence-free survival (RFS). Methods: We retrospectively analyzed data from 357 GIST patients admitted at the gastrointestinal surgery of the Beijing Hospital from January 2008 to January 2018 and underwent curative resection. FARI was calculated as fibrinogen level (g/L) /albumin level (g/L). The cutoff point of FARI was set using the point with the largest Youden index on the receiver operating characteristic curve with the 5-years recurrence-free survival as an endpoint. We used the Kaplan-Meier approach and multivariable Cox regression model to study the impact of FARI on recurrence-free survival. Finally, we developed a nomogram based on tumor size, location, mitotic index, and FARI to predict RFS. The nomogram was assessed by calculating concordance probabilities and testing calibration of predicted RFS with observed RFS. Concordance probabilities were also compared with the National Institute of Health (NIH) risk classification system. Results: The ROC curve revealed that the best cutoff point of the FARI was set as 0.08. The patients were classified into the FARI-high (≥0.08) and FARI-low (<0.08) groups. FARI was significantly associated with age, size of the tumor, NIH risk category, and Mitotic Index (all P < 0.05). FARI was weakly associated with NLR and PLR. FARI and PNI had a weak negative association. Multivariate analysis showed that the NIH risk category and FARI were independent prognostic predictors for worse outcomes concerning RFS in GIST patients. In the high-risk subgroup, patients with low FARI also had a more prolonged RFS than patients with high FARI (P < 0.05). The nomogram had a concordance probability of 0.802 (SE 0.025). Nomogram predictions were well-calibrated. Concordance probabilities of the nomogram were better than NIH risk classification system [0.802 [0.025] vs. 0.737 [0.024], p < 0.01]. Conclusion: We established that preoperative FARI is a novel serum biomarker to predict the prognosis after surgical resection of GISTs. The nomogram incorporating FARI could be used to help the decision-making of clinical treatment.
Keywords: albumin; fibrinogen; fibrinogen-to-albumin ratio index; gastrointestinal stromal tumors; prognosis.
Copyright © 2020 Cao, Cui, Yu, Li and Zhao.
Figures
Similar articles
-
Fibrinogen/albumin ratio index is an independent predictor of recurrence-free survival in patients with intrahepatic cholangiocarcinoma following surgical resection.World J Surg Oncol. 2021 Jul 20;19(1):218. doi: 10.1186/s12957-021-02330-2. World J Surg Oncol. 2021. PMID: 34284775 Free PMC article.
-
Novel Prognostic Nomogram for Recurrence-Free Survival of Patients With Primary Gastrointestinal Stromal Tumors After Surgical Resection: Combination of Prognostic Nutritional Index and Basic Variables.Front Oncol. 2021 Jan 28;10:581855. doi: 10.3389/fonc.2020.581855. eCollection 2020. Front Oncol. 2021. PMID: 33585198 Free PMC article.
-
Preoperative Fibrinogen-Albumin Ratio Index (FARI) is a Reliable Prognosis and Chemoradiotherapy Sensitivity Predictor in Locally Advanced Rectal Cancer Patients Undergoing Radical Surgery Following Neoadjuvant Chemoradiotherapy.Cancer Manag Res. 2020 Sep 17;12:8555-8568. doi: 10.2147/CMAR.S273065. eCollection 2020. Cancer Manag Res. 2020. PMID: 32982448 Free PMC article.
-
Risk stratification systems for surgically treated localized primary Gastrointestinal Stromal Tumors (GIST). Review of literature and comparison of the three prognostic criteria: MSKCC Nomogramm, NIH-Fletcher and AFIP-Miettinen.Ann Ital Chir. 2015 May-Jun;86(3):219-27. Ann Ital Chir. 2015. PMID: 26098671 Review.
-
Risk of recurrence of gastrointestinal stromal tumour after surgery: an analysis of pooled population-based cohorts.Lancet Oncol. 2012 Mar;13(3):265-74. doi: 10.1016/S1470-2045(11)70299-6. Epub 2011 Dec 6. Lancet Oncol. 2012. PMID: 22153892 Review.
Cited by
-
The fibrinogen-albumin ratio as a novel prognostic factor for elderly patients with osteosarcoma.Medicine (Baltimore). 2023 Sep 8;102(36):e34926. doi: 10.1097/MD.0000000000034926. Medicine (Baltimore). 2023. PMID: 37682137 Free PMC article.
-
Prognostic Value of Preoperative Albumin-to-Fibrinogen Ratio in Patients with Bladder Cancer.J Cancer. 2021 Aug 4;12(19):5864-5873. doi: 10.7150/jca.61068. eCollection 2021. J Cancer. 2021. PMID: 34475999 Free PMC article.
-
Postoperative Adjuvant Imatinib Therapy-Associated Nomogram to Predict Overall Survival of Gastrointestinal Stromal Tumor.Front Med (Lausanne). 2022 Mar 10;9:777181. doi: 10.3389/fmed.2022.777181. eCollection 2022. Front Med (Lausanne). 2022. PMID: 35360729 Free PMC article.
-
Development and validation of a novel diagnostic model for initially clinical diagnosed gastrointestinal stromal tumors using an extreme gradient-boosting machine.BMC Gastroenterol. 2021 Dec 18;21(1):481. doi: 10.1186/s12876-021-02048-1. BMC Gastroenterol. 2021. PMID: 34922474 Free PMC article. Clinical Trial.
-
The prognostic value of fibrinogen to albumin ratio in malignant tumor patients: A meta-analysis.Front Oncol. 2022 Sep 29;12:985377. doi: 10.3389/fonc.2022.985377. eCollection 2022. Front Oncol. 2022. PMID: 36249067 Free PMC article.
References
LinkOut - more resources
Full Text Sources