

Identification of a Prognostic Model Based on Immune-Related Genes of Lung Squamous Cell Carcinoma
- PMID: 33014809
- PMCID: PMC7493716
- DOI: 10.3389/fonc.2020.01588
Identification of a Prognostic Model Based on Immune-Related Genes of Lung Squamous Cell Carcinoma
Abstract
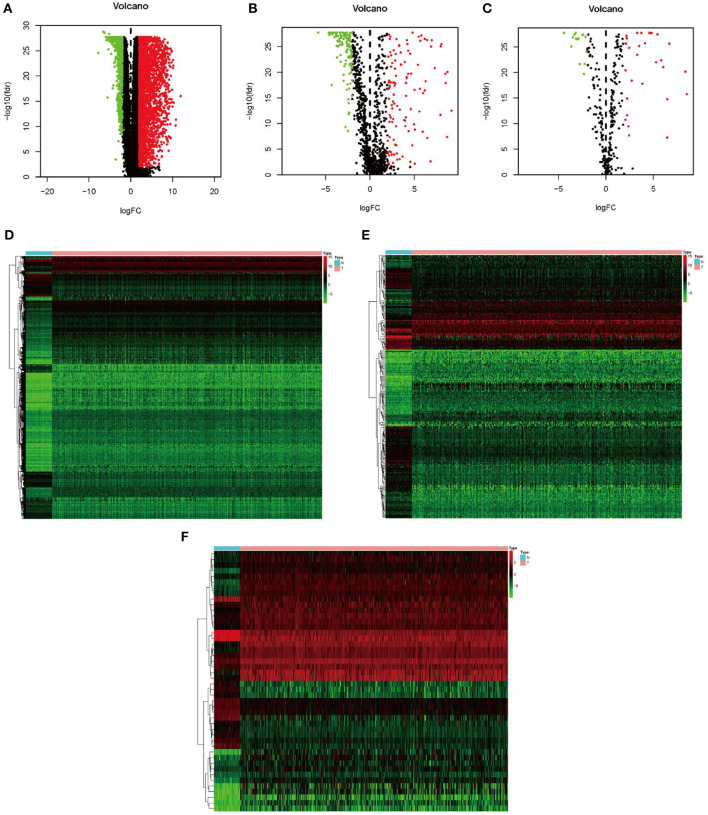
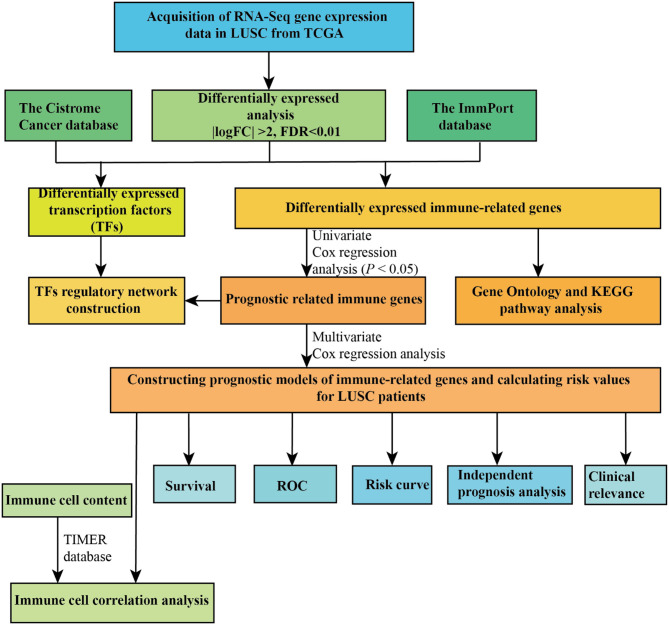
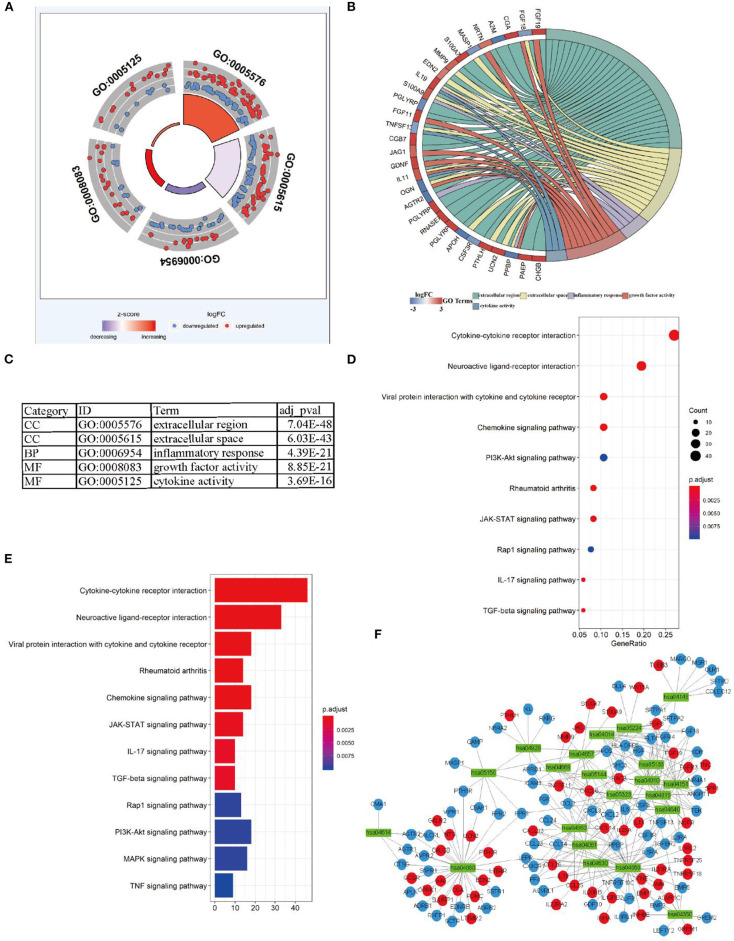
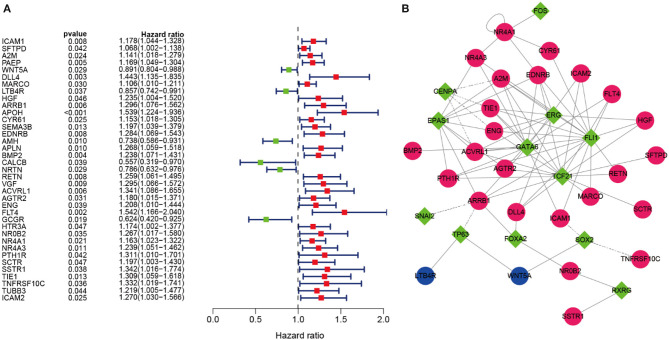
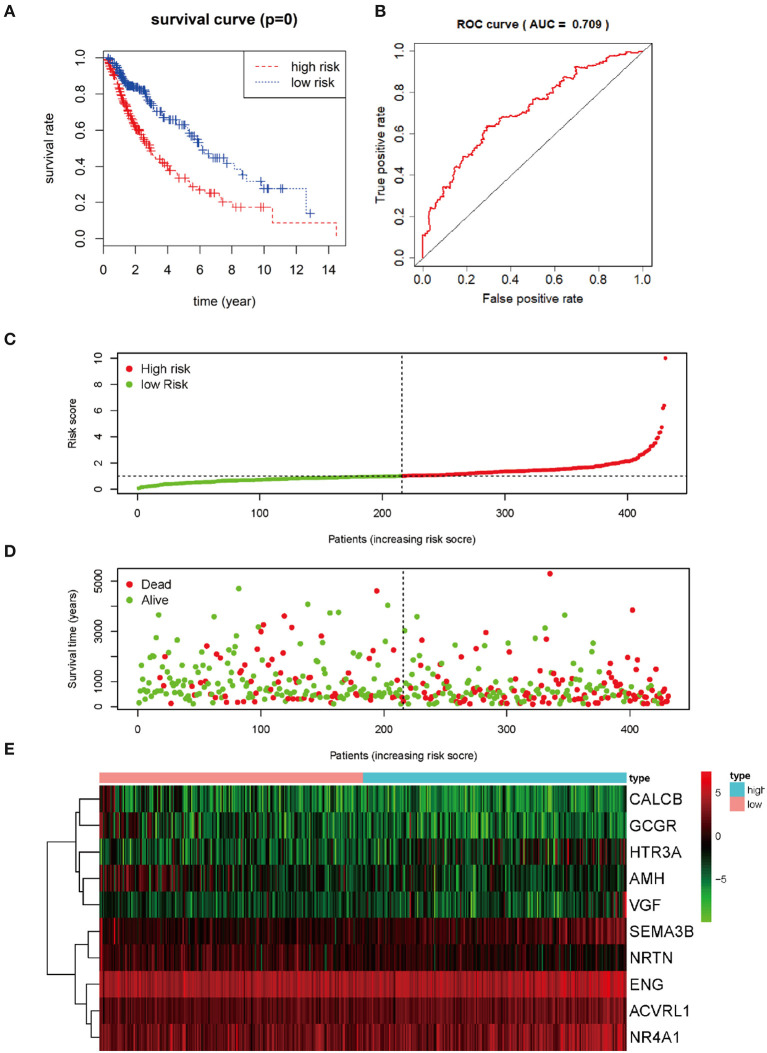
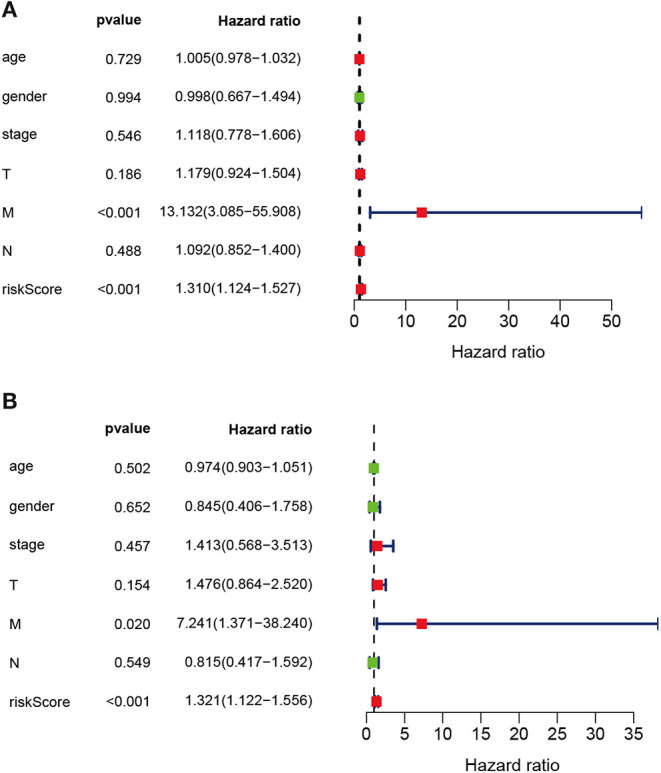
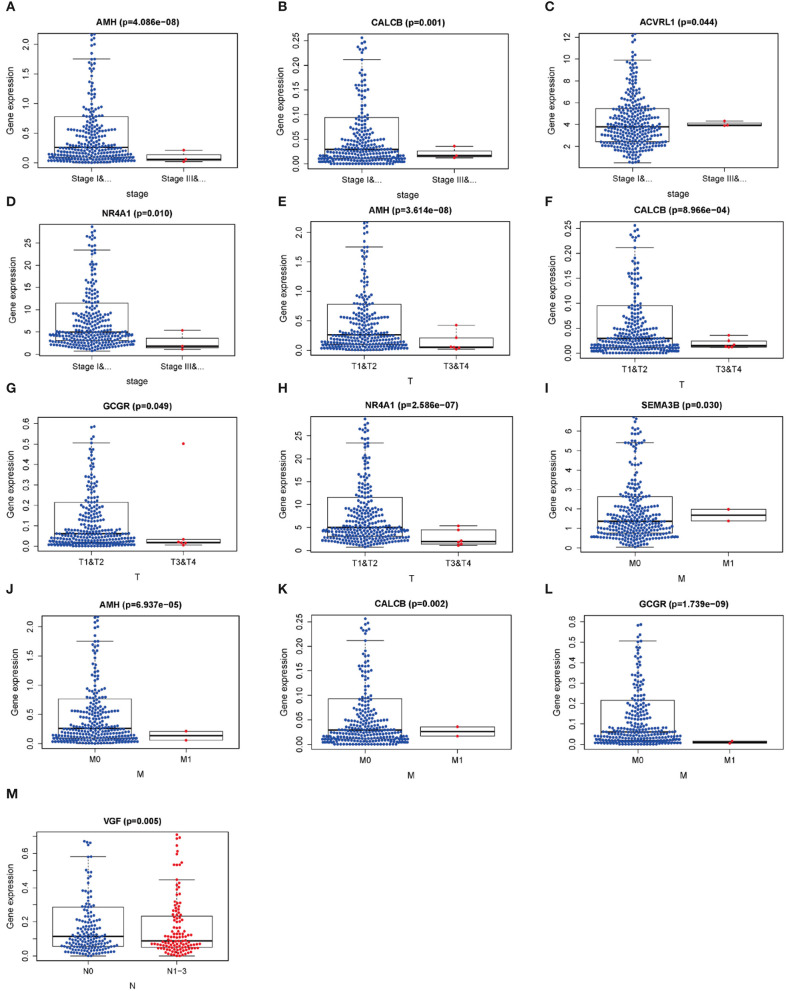
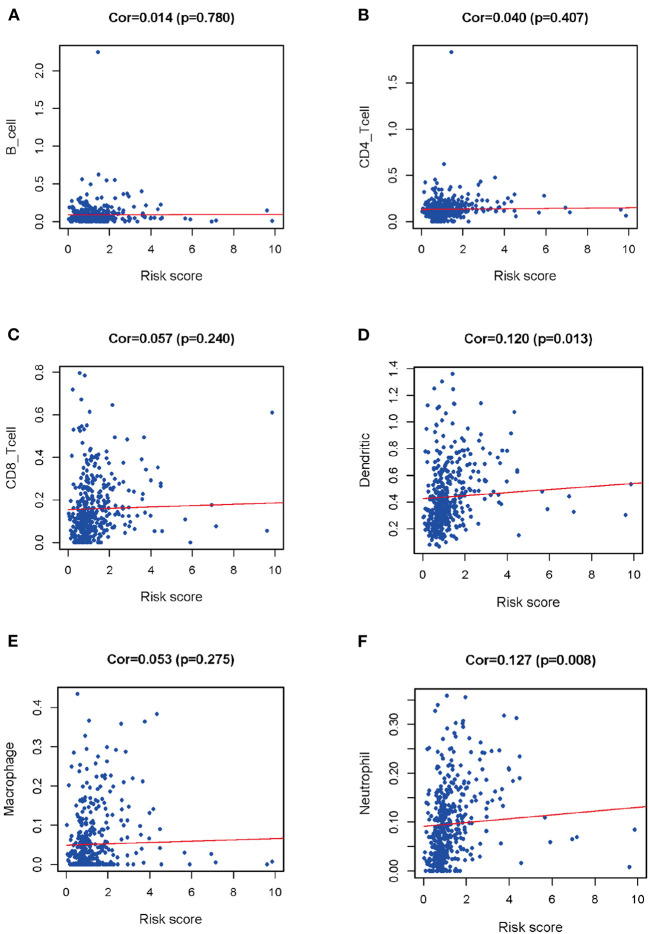
Immune-related genes (IRGs) play considerable roles in tumor immune microenvironment (IME). This research aimed to discover the differentially expressed immune-related genes (DEIRGs) based on the Cox predictive model to predict survival for lung squamous cell carcinoma (LUSC) through bioinformatics analysis. First of all, the differentially expressed genes (DEGs) were acquired based on The Cancer Genome Atlas (TCGA) using the limma R package, the DEIRGs were obtained from the ImmPort database, whereas the differentially expressed transcription factors (DETFs) were acquired from the Cistrome database. Thereafter, a TFs-mediated IRGs network was constructed to identify the candidate mechanisms for those DEIRGs in LUSC at molecular level. Moreover, Gene Ontology (GO), together with Kyoto Encyclopedia of Genes and Genomes (KEGG) pathway enrichment analysis, was conducted for exploring those functional enrichments for DEIRGs. Besides, univariate as well as multivariate Cox regression analysis was conducted for establishing a prediction model for DEIRGs biomarkers. In addition, the relationship between the prognostic model and immunocytes was further explored through immunocyte correlation analysis. In total, 3,599 DEGs, 223 DEIRGs, and 46 DETFs were obtained from LUSC tissues and adjacent non-carcinoma tissues. According to multivariate Cox regression analysis, 10 DEIRGs (including CALCB, GCGR, HTR3A, AMH, VGF, SEMA3B, NRTN, ENG, ACVRL1, and NR4A1) were retrieved to establish a prognostic model for LUSC. Immunocyte infiltration analysis showed that dendritic cells and neutrophils were positively correlated with IRGs, which possibly exerted an important part within the IME of LUSC. Our study identifies a prognostic model based on IRGs, which is then used to predict LUSC prognosis and analyze immunocyte infiltration. This may provide a novel insight for exploring the potential IRGs in the IME of LUSC.
Keywords: a Cox prediction model; immune-related genes (IRGs); lung squamous cell carcinoma; prognostic biomarkers; transcription factors (TFs) mediated IRGs network.
Copyright © 2020 Li, Liu, Zhou, Chen, Li, Yin and Qu.
Figures
Similar articles
-
A Prognostic Model Based on the Immune-related Genes in Colon Adenocarcinoma.Int J Med Sci. 2020 Jul 19;17(13):1879-1896. doi: 10.7150/ijms.45813. eCollection 2020. Int J Med Sci. 2020. PMID: 32788867 Free PMC article.
-
Identification and validation of the prognostic value of immune-related genes in non-small cell lung cancer.Am J Transl Res. 2020 Sep 15;12(9):5844-5865. eCollection 2020. Am J Transl Res. 2020. PMID: 33042464 Free PMC article.
-
A robust signature associated with patient prognosis and tumor immune microenvironment based on immune-related genes in lung squamous cell carcinoma.Int Immunopharmacol. 2020 Nov;88:106856. doi: 10.1016/j.intimp.2020.106856. Epub 2020 Aug 7. Int Immunopharmacol. 2020. PMID: 32777677
-
Development and validation of a novel immune-related prognostic model in lung squamous cell carcinoma.Int J Med Sci. 2020 Jun 1;17(10):1393-1405. doi: 10.7150/ijms.47301. eCollection 2020. Int J Med Sci. 2020. PMID: 32624696 Free PMC article.
-
Integrated identification of key immune related genes and patterns of immune infiltration in calcified aortic valvular disease: A network based meta-analysis.Front Genet. 2022 Sep 21;13:971808. doi: 10.3389/fgene.2022.971808. eCollection 2022. Front Genet. 2022. PMID: 36212153 Free PMC article.
Cited by
-
The clinical significance of preoperative serum triglyceride, high-density lipoprotein, and low-density lipoprotein levels in lung squamous cell carcinoma.Sci Rep. 2022 Oct 7;12(1):16828. doi: 10.1038/s41598-022-18589-8. Sci Rep. 2022. PMID: 36207435 Free PMC article.
-
Characterization of a prognostic model for lung squamous cell carcinoma based on eight stemness index-related genes.BMC Pulm Med. 2022 Jun 8;22(1):224. doi: 10.1186/s12890-022-02011-0. BMC Pulm Med. 2022. PMID: 35676660 Free PMC article.
-
Integrative Analysis of Biomarkers and Mechanisms in Adamantinomatous Craniopharyngioma.Front Genet. 2022 Mar 30;13:830793. doi: 10.3389/fgene.2022.830793. eCollection 2022. Front Genet. 2022. PMID: 35432485 Free PMC article.
-
Ethanol promoting the upregulation of C-X-C Motif Chemokine Ligand 1(CXCL1) and C-X-C Motif Chemokine Ligand 6(CXCL6) in models of early alcoholic liver disease.Bioengineered. 2022 Mar;13(3):4688-4701. doi: 10.1080/21655979.2022.2030557. Bioengineered. 2022. PMID: 35156518 Free PMC article.
-
Association of dysbindin expression with individualized postoperative prognosis and chemotherapy benefit among patients with gastric adenocarcinoma.J Cancer. 2021 Sep 21;12(22):6740-6748. doi: 10.7150/jca.60576. eCollection 2021. J Cancer. 2021. PMID: 34659563 Free PMC article.
References
LinkOut - more resources
Full Text Sources