

Nutritional Status and Symptoms in Preschool Children With Autism Spectrum Disorder: A Two-Center Comparative Study in Chongqing and Hainan Province, China
- PMID: 33014918
- PMCID: PMC7494825
- DOI: 10.3389/fped.2020.00469
Nutritional Status and Symptoms in Preschool Children With Autism Spectrum Disorder: A Two-Center Comparative Study in Chongqing and Hainan Province, China
Abstract
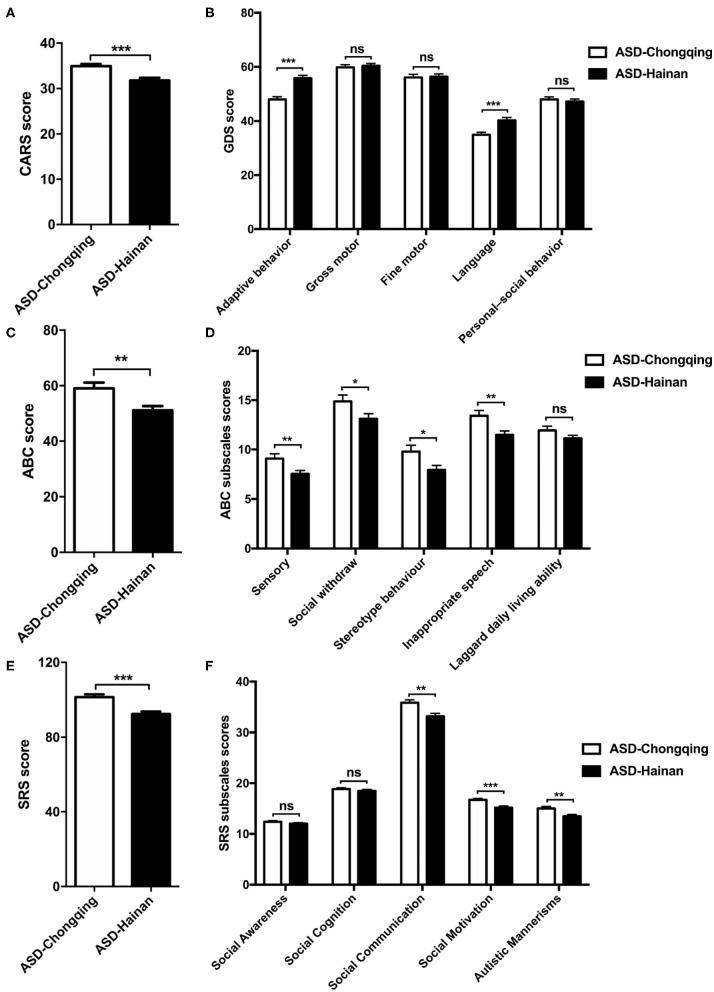
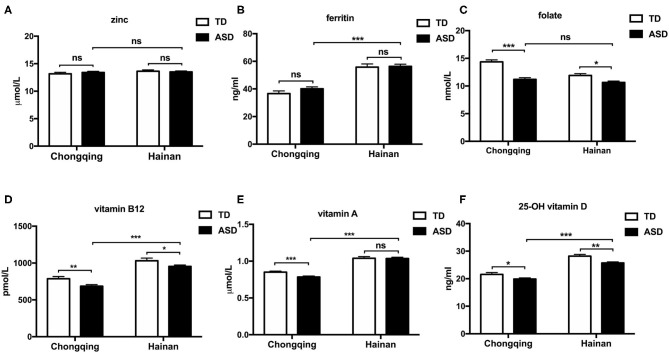
Objective: The study aimed to compare the nutritional status and symptoms of preschool children with autism spectrum disorder (ASD) from two regions of China, and to analyze the association between nutritional status and symptoms of ASD. Methods: In this cross-sectional study, 738 ASD children and 302 typically developing children (TD) were recruited from Chongqing and Hainan of China. Symptoms of ASD children were evaluated with the Autism Behavior Checklist (ABC), Social Responsiveness Scale (SRS), and Childhood Autism Rating Scale (CARS). Neurodevelopment of ASD children was assessed with the Gesell Developmental Scale (GDS). Nutritional status was evaluated by anthropometric measures, biochemical detection of micronutrients, and providing questionnaire and food frequency questionnaire (FFQ) to caregivers. Results: Comparing ASD children with local TD children, ASD children consumed fewer whole grains, milk and dairy products, beans and soy products, vegetables, and fruits than local TD children in both regions. The serum concentrations of folate, vitamin B12 (VB12), and vitamin D (VD) were consistently lower in ASD children in both regions. Comparing the ASD children between the two regions, the ASD children in Chongqing had significantly higher mean scores of CARS, SRS, and ABC than those in Hainan. The ASD children in Chongqing consumed fewer whole grains, seafood, and fruits than those in Hainan. The serum concentrations of ferritin, vitamin A (VA), VB12, and VD were reduced in the ASD children of Chongqing than those in Hainan, and the ASD children in Chongqing had higher deficiency rates of zinc, ferritin, VA, and VD than those in Hainan. The serum levels of VA, VD, and folate showed a negative association with symptom scores of ASD children. VD and zinc levels had a positive association with the GDS scores of ASD children. Conclusions: ASD children exhibit a higher risk of nutrient deficiencies than neurotypical children, and there are regional differences in the nutritional status of ASD children. Micronutrients VA, VD, folate, and zinc levels were correlated with symptoms and development of ASD children. Therefore, it is essential to provide detailed nutrition evaluation and individualized nutrition interventions for ASD children from different backgrounds.
Keywords: autism spectrum disorders; children; dietary; micronutrients; nutrition; vitamin.
Copyright © 2020 Zhu, Guo, Yang, Lai, Tang, Chen, Li and Li.
Figures
Similar articles
-
Vitamin and mineral status of children with autism spectrum disorder in Hainan Province of China: associations with symptoms.Nutr Neurosci. 2020 Oct;23(10):803-810. doi: 10.1080/1028415X.2018.1558762. Epub 2018 Dec 20. Nutr Neurosci. 2020. PMID: 30570388
-
Correlation between Nutrition and Symptoms: Nutritional Survey of Children with Autism Spectrum Disorder in Chongqing, China.Nutrients. 2016 May 14;8(5):294. doi: 10.3390/nu8050294. Nutrients. 2016. PMID: 27187463 Free PMC article.
-
Vitamin A and vitamin D deficiencies exacerbate symptoms in children with autism spectrum disorders.Nutr Neurosci. 2019 Sep;22(9):637-647. doi: 10.1080/1028415X.2017.1423268. Epub 2018 Jan 16. Nutr Neurosci. 2019. PMID: 29338670
-
Differences in food consumption and nutritional intake between children with autism spectrum disorders and typically developing children: A meta-analysis.Autism. 2019 Jul;23(5):1079-1095. doi: 10.1177/1362361318794179. Epub 2018 Oct 21. Autism. 2019. PMID: 30345784 Review.
-
Autism Spectrum Disorder: Classification, diagnosis and therapy.Pharmacol Ther. 2018 Oct;190:91-104. doi: 10.1016/j.pharmthera.2018.05.007. Epub 2018 May 12. Pharmacol Ther. 2018. PMID: 29763648 Review.
Cited by
-
Correlation of Co-Morbidities with Symptom Severity of Children with Autism Spectrum Disorder: A Cross-Sectional Survey.Nutrients. 2024 Sep 3;16(17):2960. doi: 10.3390/nu16172960. Nutrients. 2024. PMID: 39275276 Free PMC article.
-
Association of whole blood essential metals with neurodevelopment among preschool children.Pediatr Res. 2024 Nov 16. doi: 10.1038/s41390-024-03729-9. Online ahead of print. Pediatr Res. 2024. PMID: 39550514
-
A Review of the Nutritional Approach and the Role of Dietary Components in Children with Autism Spectrum Disorders in Light of the Latest Scientific Research.Nutrients. 2023 Nov 21;15(23):4852. doi: 10.3390/nu15234852. Nutrients. 2023. PMID: 38068711 Free PMC article. Review.
-
Do Children with Autism Spectrum Disorders Eat Differently and Less Adequately than Those with Subclinical ASD and Typical Development? EPINED Epidemiological Study.J Autism Dev Disord. 2022 Jan;52(1):361-375. doi: 10.1007/s10803-021-04928-7. Epub 2021 Mar 21. J Autism Dev Disord. 2022. PMID: 33745113
-
In Vitro Fermentation of Edible Mushrooms: Effects on Faecal Microbiota Characteristics of Autistic and Neurotypical Children.Microorganisms. 2023 Feb 6;11(2):414. doi: 10.3390/microorganisms11020414. Microorganisms. 2023. PMID: 36838379 Free PMC article.
References
LinkOut - more resources
Full Text Sources