. 2020 Aug 18:8:838.
doi: 10.3389/fbioe.2020.00838. eCollection 2020.

A Sensor Fusion Approach to the Estimation of Instantaneous Velocity Using Single Wearable Sensor During Sprint

Affiliations

A Sensor Fusion Approach to the Estimation of Instantaneous Velocity Using Single Wearable Sensor During Sprint

Salil Apte et al. Front Bioeng Biotechnol. .

Abstract

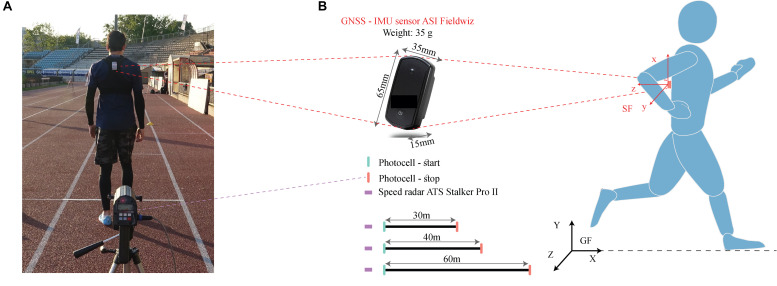
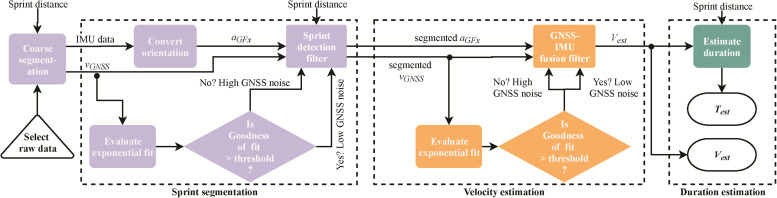
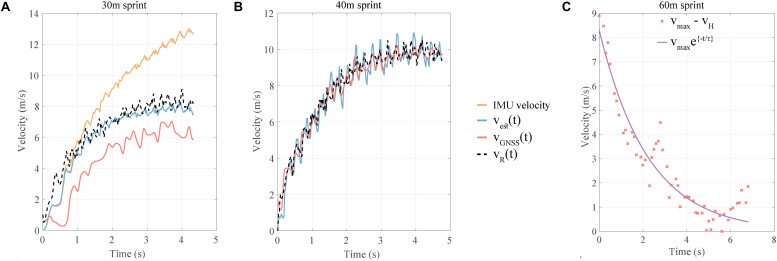
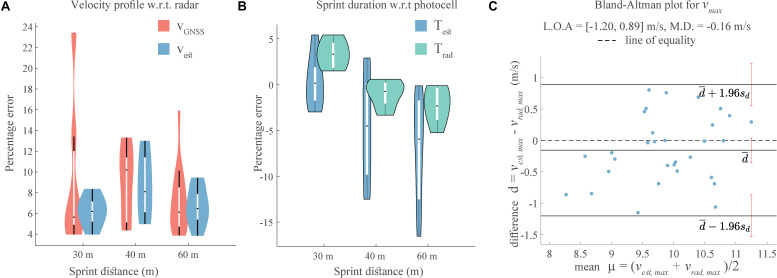
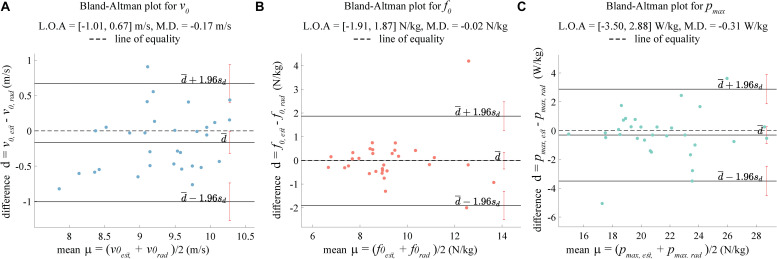
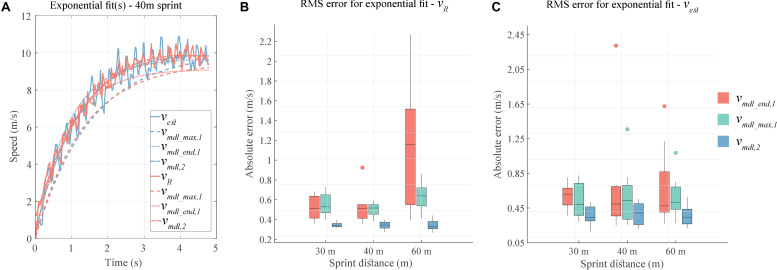
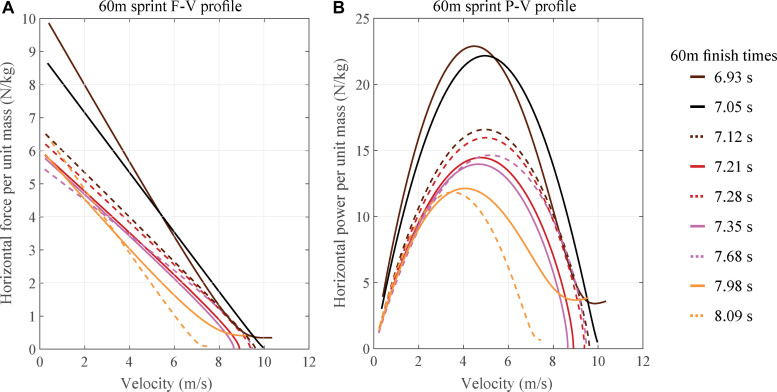
Power-Force-Velocity profile obtained during a sprint test is crucial for designing personalized training and evaluating injury risks. Estimation of instantaneous velocity is requisite for developing these profiles and the predominant method for this estimation assumes it to have a first order exponential behavior. While this method remains appropriate for maximal sprints, the sprint velocity profile may not always show a first-order exponential behavior. Alternately, velocity profile has been estimated using inertial sensors, with a speed radar, or a smartphone application. Existing methods either relied on the exponential behavior or timing gates for drift removal, or estimated only the mean velocity. Thus, there is a need for a more flexible and appropriate approach, allowing for instantaneous velocity estimation during sprint tests. The proposed method aims to solve this problem using a sensor fusion approach, by combining the signals from wearable Global Navigation Satellite System (GNSS) and inertial measurement unit (IMU) sensors. We collected data from nine elite sprinters, equipped with a wearable GNSS-IMU sensor, who ran two trials each of 60 and 30/40 m sprints. We developed an algorithm using a gradient descent-based orientation filter, which simplified our model to a linear one-dimensional model, thus allowing us to use a simple Kalman filter (KF) for velocity estimation. We used two cascaded KFs, to segment the sprint data precisely, and to estimate the velocity and the sprint duration, respectively. We validated the estimated velocity and duration with speed radar and photocell data as reference. The median RMS error for the estimated velocity ranged from 6 to 8%, while that for the estimated sprint duration lied between 0.1 and -6.0%. The Bland-Altman plot showed close agreement between the estimated and the reference values of maximum velocity. Examination of fitting errors indicated a second order exponential behavior for the sprint velocity profile, unlike the first order behavior previously suggested in literature. The proposed sensor-fusion algorithm is valid to compute an accurate velocity profile with respect to the radar; it can compensate for and improve upon the accuracy of the individual IMU and GNSS velocities. This method thus enables the use of wearable sensors in the analysis of sprint test.

Keywords: athlete monitoring; functional capacity test; sensor fusion; sprinting; validation study; velocity profile; wearable GNSS-IMU sensor.


Figures

FIGURE 1
FIGURE 1
Sensor setup and measurement protocol, (A) Snapshot of a sprinter wearing the Fieldwiz sensor with the speed radar in the foreground (B) Specifications of the Fieldwiz sensor and the measurement protocol, wherein the sprinters ran two trials each of 60 m and 30 or 40 m distances with the speed radar as the velocity reference. Photocells were positioned at the start/end to record the sprint duration. GF and SF represent the global and sensor frames.
FIGURE 2
FIGURE 2
Flowchart for the sprint velocity estimation algorithm. The “coarse segmentation” block is manual and creates a window to select the approximate starting point of the relevant sprint, while remaining algorithm is automated. The “Sprint detection” and “GNSS-IMU fusion” filters are simple Kalman filters. aGFx denotes the horizontal acceleration in the global frame, vGNSS the ground velocity from the GNSS sensor, while vest and Test represent the estimated velocity and sprint duration, respectively.
FIGURE 3
FIGURE 3
(A) Example of a specific case of 30 m sprint when vGNSS(t) was inaccurate while the estimated velocity is accurate. (B) Example of a specific case of 40 m sprint when vGNSS(t) was accurate and so was the estimated velocity. (C) Example of exponential fit (Eq. 5) used to adjust measurement (GNSS) noise for the Kalman filter. IMU velocity: velocity obtained by strapdown integration of IMU signals, vGNSS(t): GNSS velocity, vR(t): radar velocity, vest(t): estimated velocity by GNSS-IMU fusion.
FIGURE 4
FIGURE 4
Validation of estimated velocity, (A) RMS error of the estimated velocity and GNSS velocity w.r.t. the radar speed. (B) RMS error of the predicted sprint duration from the proposed algorithm and the radar speed with the photocell duration as reference. (C) Bland–Altman plot for the maximum estimated velocity with the maximum radar speed as reference. Here, L.O.A. are the limits of agreement and M.D. is the mean difference.
FIGURE 5
FIGURE 5
Bland–Altman plots with the values calculated from radar speed as reference, where L.O.A. are the limits of agreement and M.D. is the mean difference. The values here are obtained using the second-order exponential fit, (A) Maximum theoretical velocity v0 (m/s). (B) Maximum theoretical horizontal force per unit mass f0 (N/kg). (C) Maximum theoretical horizontal power pmax per unit mass (W/kg).
FIGURE 6
FIGURE 6
(A) Three methods for exponential fit. (B) RMS error for exponential fit(s) on radar speed (vR). (C) RMS error for exponential fit(s) on estimated velocity (vest).
FIGURE 7
FIGURE 7
(A) Horizontal force (per unit mass) – velocity profile for the respective best 60 m performance of nine athletes. (B) Power (per unit mass) – velocity profile, based on second order exponential fit, for the respective best 60 m performance of nine athletes.
FIGURE A1
FIGURE A1
Change in the percentage of RMS error from its value at the chosen threshold of 0.3 m/s. The RMS error is slightly sensitive to the threshold for the 30 m sprint, especially when the threshold is below 0.3 m/s. For other distances, the error is almost insensitive to the threshold.

References

    1. Altman D. G. (1990). Practical statistics for medical research. Boca Raton, FL: CRC press.
    1. Bangsbo J., Krustrup P. (2001). Physiological demands in top-class soccer refereeing: effect of high intensity intermittent training. Med. Sci. Sports Exerc. 33:S159. - PubMed
    1. Bergamini E., Picerno P., Pillet H., Natta F., Thoreux P., Camomilla V. (2012). Estimation of temporal parameters during sprint running using a trunk-mounted inertial measurement unit. J. Biomech. 45 1123–1126. 10.1016/j.jbiomech.2011.12.020 - DOI - PubMed
    1. Brodie M., Walmsley A., Page W. (2008). Fusion motion capture: a prototype system using inertial measurement units and GPS for the biomechanical analysis of ski racing. Sports Technol. 1 17–28. 10.1080/19346182.2008.9648447 - DOI
    1. Buchheit M., Samozino P., Glynn J. A., Michael B. S., Al Haddad H., Mendez-Villanueva A., et al. (2014). Mechanical determinants of acceleration and maximal sprinting speed in highly trained young soccer players. J. Sports Sci. 32 1906–1913. 10.1080/02640414.2014.965191 - DOI - PubMed