. 2020 Sep 8:8:1006.
doi: 10.3389/fbioe.2020.01006. eCollection 2020.

Distinguishing Epileptiform Discharges From Normal Electroencephalograms Using Scale-Dependent Lyapunov Exponent

Affiliations

Distinguishing Epileptiform Discharges From Normal Electroencephalograms Using Scale-Dependent Lyapunov Exponent

Qiong Li et al. Front Bioeng Biotechnol. .

Abstract

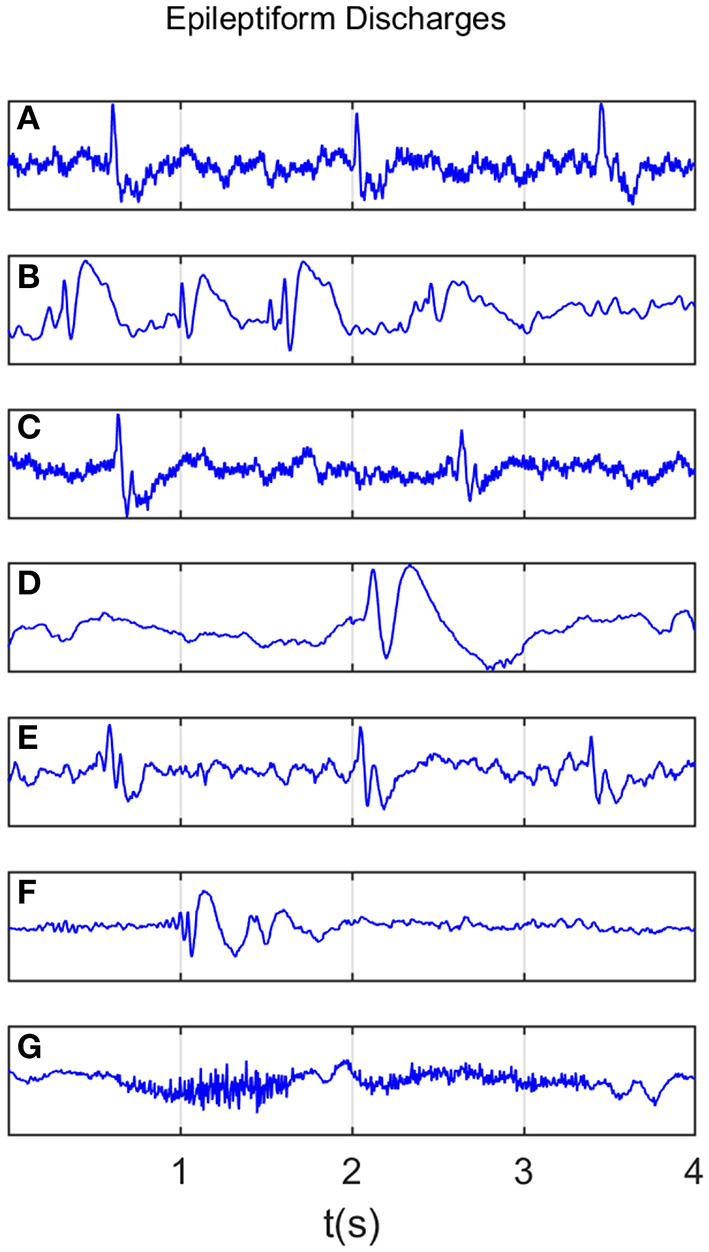
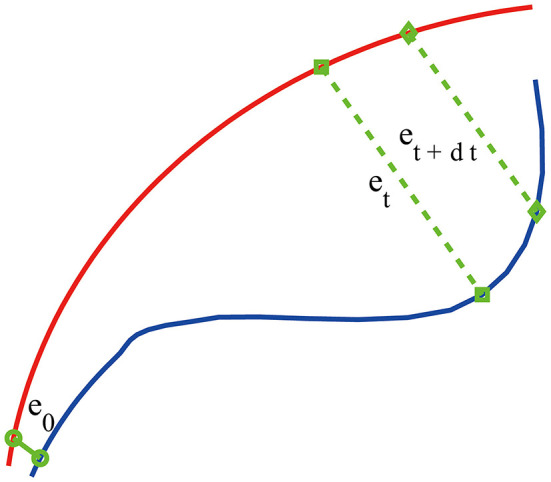
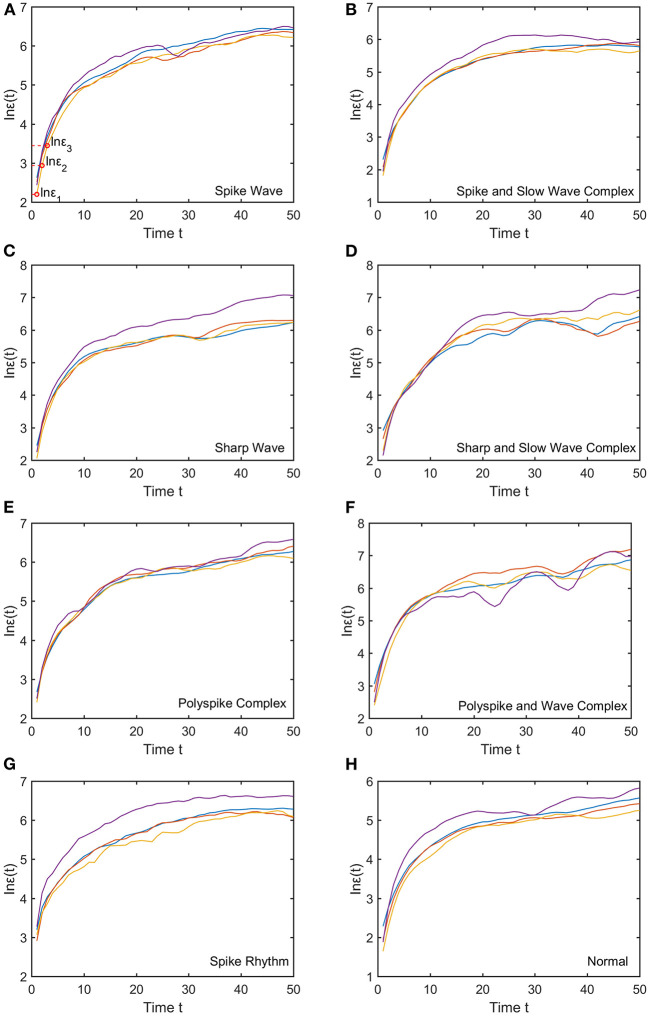
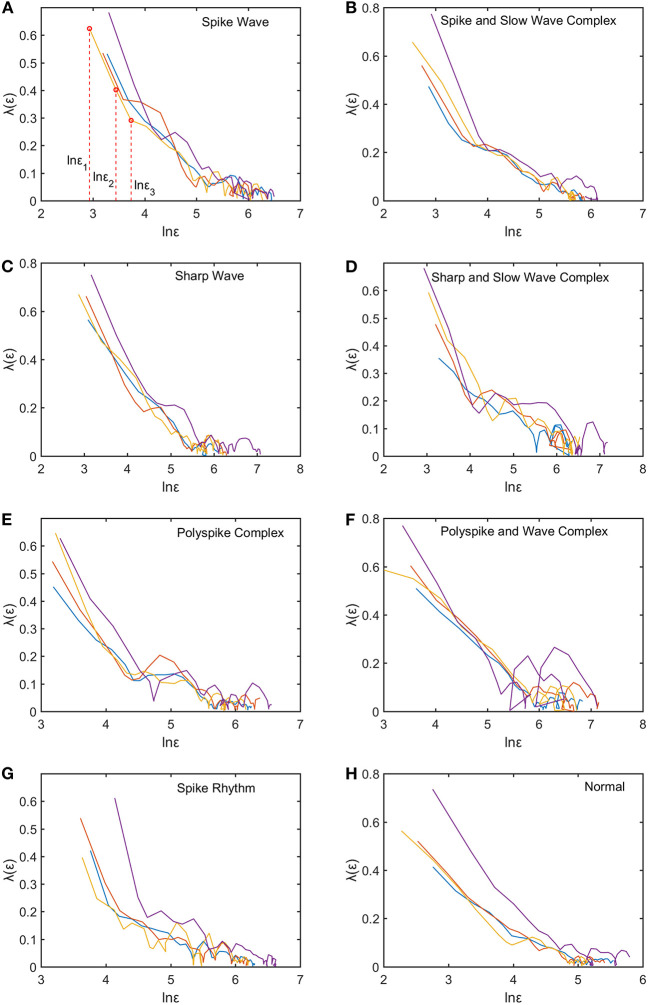
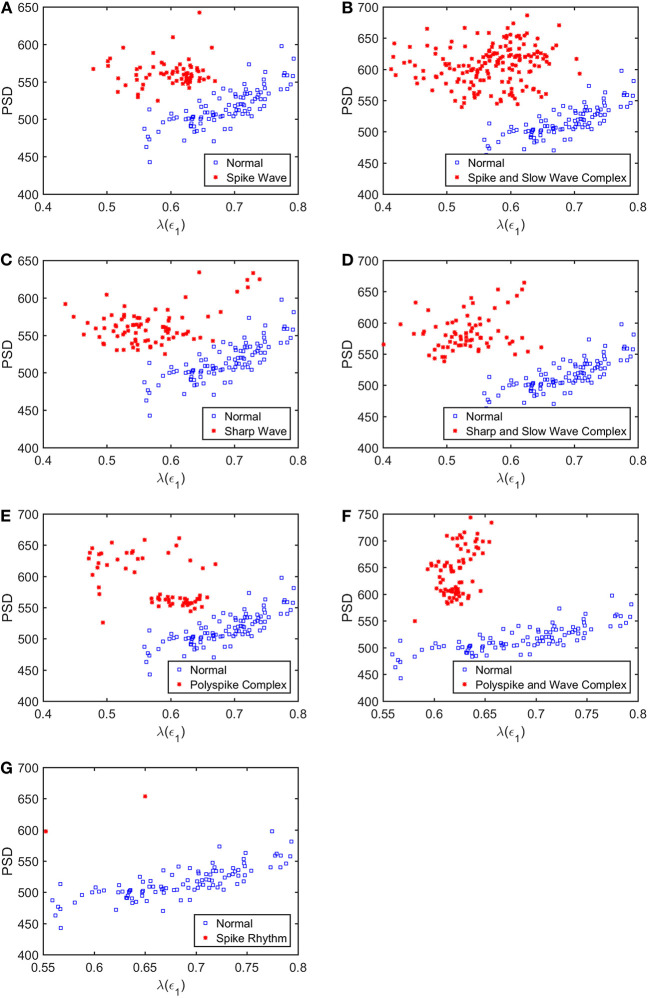
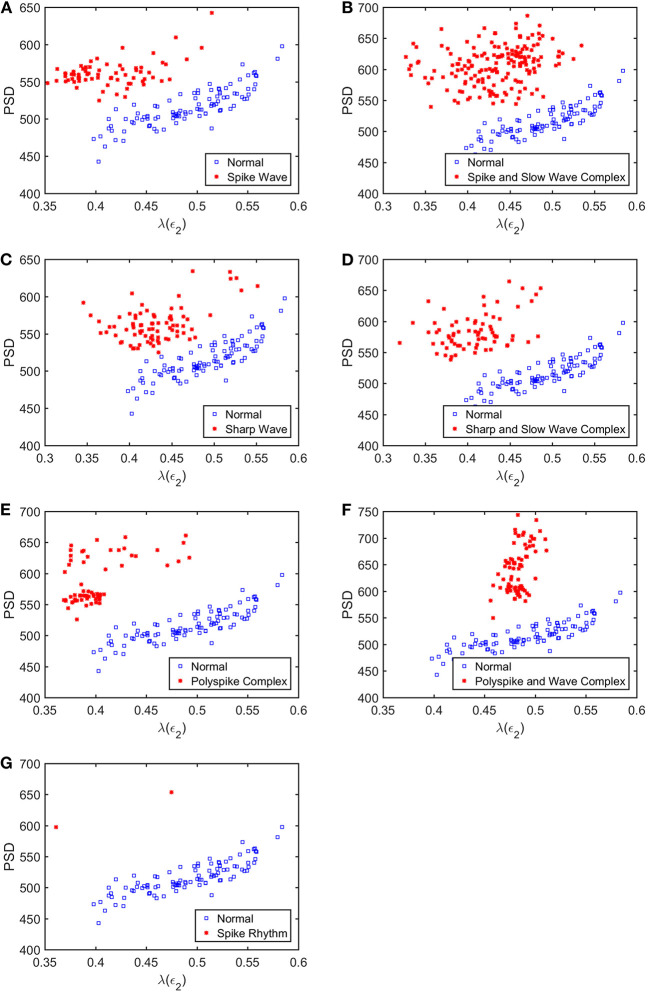
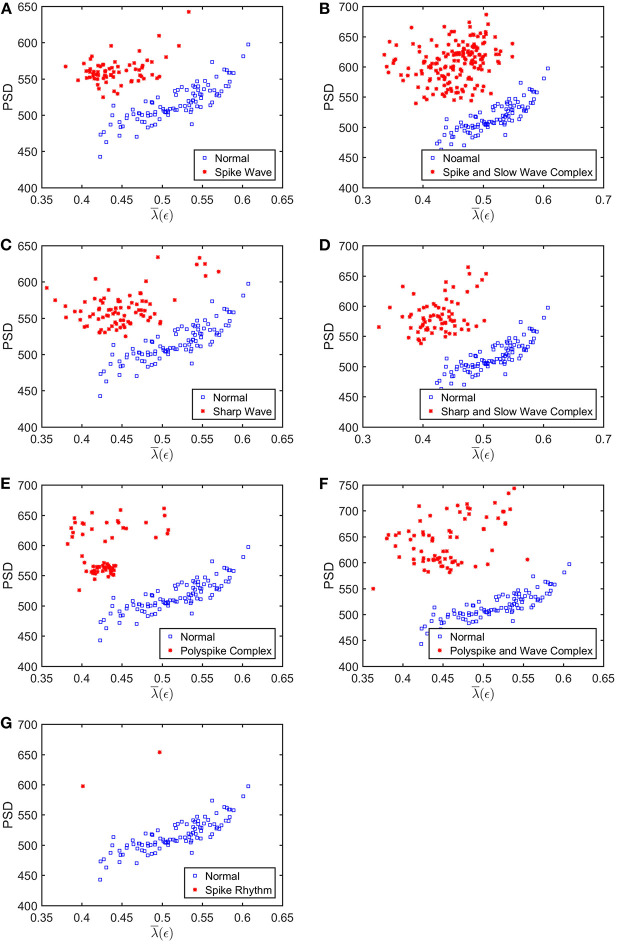
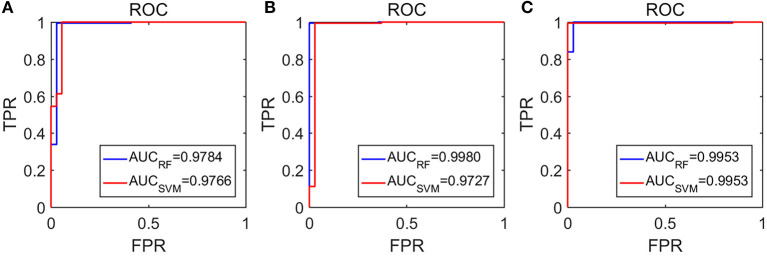
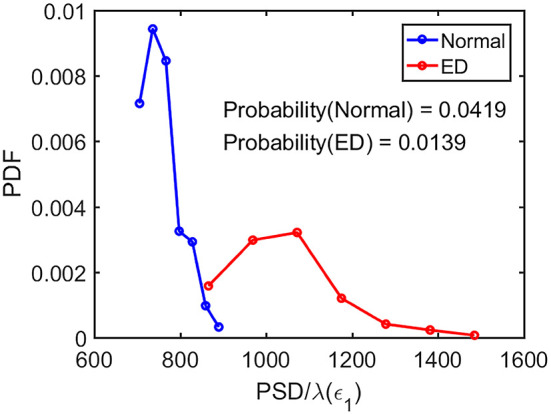
Epileptiform discharges are of fundamental importance in understanding the physiology of epilepsy. To aid in the clinical diagnosis, classification, prognosis, and treatment of epilepsy, it is important to develop automated computer programs to distinguish epileptiform discharges from normal electroencephalogram (EEG). This is a challenging task as clinically used scalp EEG often contains a lot of noise and motion artifacts. The challenge is even greater if one wishes to develop explainable rather than black-box based approaches. To take on this challenge, we propose to use a multiscale complexity measure, the scale-dependent Lyapunov exponent (SDLE). We analyzed 640 multi-channel EEG segments, each 4 s long. Among these segments, 540 are short epileptiform discharges, and 100 are from healthy controls. We found that features from SDLE were very effective in distinguishing epileptiform discharges from normal EEG. Using Random Forest Classifier (RF) and Support Vector Machines (SVM), the proposed approach with different features from SDLE robustly achieves an accuracy exceeding 99% in distinguishing epileptiform discharges from normal control ones. A single parameter, which is the ratio of the spectral energy of EEG signals and the SDLE and quantifies the regularity or predictability of the EEG signals, is introduced to better understand the high accuracy in the classification. It is found that this regularity is considerably greater for epileptiform discharges than for normal controls. Robustly having high accuracy in distinguishing epileptiform discharges from normal controls irrespective of which classification scheme being used, the proposed approach has the potential to be used widely in a clinical setting.

Keywords: EEG; epileptiform discharges; power spectral density (PSD); random forest classifier; scale-dependent Lyapunov exponent (SDLE); support vector machine (SVM).


Figures

Figure 1
Figure 1
Typical waveforms of the 7 major epileptiform EEG, where (A-G), denotes spike wave, spike and slow wave complex, sharp wave, sharp and slow wave complex, polyspike complex, polyspike and slow wave complex, spike rhythm discharges, respectively.
Figure 2
Figure 2
A schematic showing two arbitrary trajectories in a general high-dimensional space, with the distance between them at time 0, t, and tt being ϵ0, ϵt, and ϵtt, respectively.
Figure 3
Figure 3
Typical ln εt vs. t curves for epileptiform discharges and normal EEG, where the four curves correspond to four different shells, with the diameter of the largest shell being 1/10 of the standard deviation of the EEG signal, and successive shells shrinking by a factor of 1/2. (A–H) illustrates the different between the seven types of epileptiform discharges (spike wave, spike and slow wave complex, sharp wave, sharp and slow wave complex, polyspike complex, polyspike and slow wave complex, spike rhythm discharges) and normal EEG.
Figure 4
Figure 4
Typical λ(ϵ) vs. lnϵ curves for epileptiform discharges and normal EEG. The four curves represented in four different colors correspond to the error growth curves shown in Figure 3. (A–H) illustrates the different between the seven types of epileptiform discharges (spike wave, spike and slow wave complex, sharp wave, sharp and slow wave complex, polyspike complex, polyspike and slow wave complex, spike rhythm discharges) and normal EEG.
Figure 5
Figure 5
Scatter plots with PSD and λ(e1), where (A–G), illustrates the different between the seven types of epileptiform discharges (spike wave, spike and slow wave complex, sharp wave, sharp and slow wave complex, polyspike complex, polyspike and slow wave complex, spike rhythm discharges) and normal EEG. These plots highly suggest the classification accuracy will be very high.
Figure 6
Figure 6
Scatter plots with PSD and λ(e2), where (A–G), illustrates the different between the seven types of epileptiform discharges (spike wave, spike and slow wave complex, sharp wave, sharp and slow wave complex, polyspike complex, polyspike and slow wave complex, spike rhythm discharges) and normal EEG. These plots highly suggest the classification accuracy will be very high.
Figure 7
Figure 7
Scatter plots with PSD and λ¯(ϵ), where (A–G), illustrates the different between the seven types of epileptiform discharges (spike wave, spike and slow wave complex, sharp wave, sharp and slow wave complex, polyspike complex, polyspike and slow wave complex, spike rhythm discharges) and normal EEG. These plots highly suggest the classification accuracy will be very high.
Figure 8
Figure 8
The ROC curves for the testing data: (A–C) are for algorithms using PSD and λ(ϵ1), PSD and λ(ϵ2), and PSD and λ¯(ϵ), respectively.
Figure 9
Figure 9
The probability density distribution (PDF) for the ratio PSD/λ(ϵ1) of the epileptiform discharges (red curve) and normal control ones (blue curve). The overlapping of the blue and the red curves defines a right and left tail for the blue and red curves, respectively; the corresponding probabilities for them are 1.39 and 4.19%, as indicated in the plot.

Similar articles

Cited by

References

    1. Acharya J. N., Acharya V. J. (2019). Overview of EEG montages and principles of localization. J. Clin. Neurophysiol. 36, 325–329. 10.1097/WNP.0000000000000538 - DOI - PubMed
    1. Adeli H., Zhou Z., Dadmehr N. (2003). Analysis of EEG records in an epileptic patient using wavelet transform. J. Neurosci. Methods 123, 69–87. 10.1016/S0165-0270(02)00340-0 - DOI - PubMed
    1. Anh-Dao N. T., Linh-Trung N., Van Nguyen L., Tran-Duc T., Boashash B. (2018). A multistage system for automatic detection of epileptic spikes. Rev J. Electron. Commun. 8, 1–12. 10.21553/rev-jec.166 - DOI
    1. Antoniades A., Spyrou L., Took C. C., Sanei S. (2016). Deep learning for epileptic intracranial EEG data, in Deep learning International Workshop on Machine Learning for Signal Processing (MLSP) (Vietri sul Mare: ), 1–6. 10.1109/MLSP.2016.7738824 - DOI
    1. Arunkumar N., Ram Kumar K., Venkataraman V. (2016). Automatic detection of epileptic seizures using permutation entropy, Tsallis entropy and Kolmogorov complexity. J. Med. Imaging Health Inform. 6, 526–531. 10.1166/jmihi.2016.1710 - DOI

LinkOut - more resources