. 2020 Sep 10:7:513.
doi: 10.3389/fmed.2020.00513. eCollection 2020.

Motor Cortex and Hippocampus Display Decreased Heme Oxygenase Activity 2 Weeks After Ventricular Fibrillation Cardiac Arrest in Rats

Affiliations

Motor Cortex and Hippocampus Display Decreased Heme Oxygenase Activity 2 Weeks After Ventricular Fibrillation Cardiac Arrest in Rats

Alexandra-Maria Warenits et al. Front Med (Lausanne). .

Abstract

Heme oxygenase (HO) and biliverdin reductase (BVR) activities are important for neuronal function and redox homeostasis. Resuscitation from cardiac arrest (CA) frequently results in neuronal injury and delayed neurodegeneration that typically affect vulnerable brain regions, primarily hippocampus (Hc) and motor cortex (mC), but occasionally also striatum and cerebellum. We questioned whether these delayed effects are associated with changes of the HO/BVR system. We therefore analyzed the activities of HO and BVR in the brain regions Hc, mC, striatum and cerebellum of rats subjected to ventricular fibrillation CA (6 min or 8 min) after 2 weeks following resuscitation, or sham operation. From all investigated regions, only Hc and mC showed significantly decreased HO activities, while BVR activity was not affected. In order to find an explanation for the changed HO activity, we analyzed protein abundance and mRNA expression levels of HO-1, the inducible, and HO-2, the constitutively expressed isoform, in the affected regions. In both regions we found a tendency for a decreased immunoreactivity of HO-2 using immunoblots and immunohistochemistry. Additionally, we investigated the histological appearance and the expression of markers indicative for activation of microglia [tumor necrosis factor receptor type I (TNFR1) mRNA and immunoreactivity for ionized calcium-binding adapter molecule 1 (Iba1])], and activation of astrocytes [immunoreactivity for glial fibrillary acidic protein (GFAP)] in Hc and mC. Morphological changes were detected only in Hc displaying loss of neurons in the cornu ammonis 1 (CA1) region, which was most pronounced in the 8 min CA group. In this region also markers indicating inflammation and activation of pro-death pathways (expression of HO-1 and TNFR1 mRNA, as well as Iba1 and GFAP immunoreactivity) were upregulated. Since HO products are relevant for maintaining neuronal function, our data suggest that neurodegenerative processes following CA may be associated with a decreased capacity to convert heme into HO products in particularly vulnerable brain regions.

Keywords: biliverdin reductase; brain regions; cardiac arrest; enzyme activity; global cerebral ischemia; heme degradation pathway; neurodegeneration; reperfusion injury.


Figures

Figure 1
Figure 1
Schematic representation of setup and timeline of the experiments. (A) Instrumentation of animals using an endotracheal tube (endotr tube), an arterial and venous catheter in the femoral artery and vein (art and ven catheter), an esophageal temperature probe (Tesoph), and a rectal temperature probe (Trect). Fibrillation catheter for inducing ventricular fibrillation (fibrill cath). For resuscitation defibrillation pads (Defi Pads) were placed as indicated and a thumper was positioned 2 cm cranial of the xiphoid process. (B) Animals were randomly allocated to sham (not shown) or the 6 or 8 min cardiac arrest (CA) group following anesthesia and surgery (Anesth/Surgery). Sevoflurane was stopped (Sevofl stop) and CA was induced by ventricular fibrillation (single lightning symbol; Fibr.). Heparin (Hep), epinephrine (EPI) and sodium bicarbonate were added prior to cardiopulmonary resuscitation (CPR) attempted by 2 consecutive defibrillation steps (double lightning bolts), repeated every 2 min of CPR and followed immediately by epinephrine (EPI) supplementation every 2 min of CPR. After successful resuscitation with maximal 5 defibrillation attempts catheters were explanted (Cath Explant) and animals extubated (Extub). Overall performance category score (OPC) and neurological deficit score (NDS) were determined in all surviving animals at day 1 and day 14 prior to sacrifice.
Figure 2
Figure 2
Schematic overview for the preparation of brain sections used for the different analysis. Brain samples were taken from rats surviving 2 weeks following CA and processed as described in the Materials and Methods section. Half of the brain was fixed and used for histological examination [hematoxylin and eosin staining (HE), immunohistochemistry for heme oxygenase (HO)-2, ionized calcium-binding adapter molecule 1 (Iba-1), and glial fibrillary acidic protein (GFAP)]. Different regions were cut from the other half and immediately snap-frozen. In order to prevent biases frozen tissue pieces were homogenized and distributed into droplets prior to analysis of activity of HO and BVR, protein expression of HO-1 and HO-2, and gene expression [Tumor necrosis factor receptor 1 (TNFR1), HO-1, HO-2, and biliverdin reductase A (BVRA)]. Analyses were performed in accordance to the procedures described in Materials and Methods section.
Figure 3
Figure 3
Catalytic activities of the heme degradation pathway enzymes, HO and BVR, in brain regions 2 weeks after cardiac arrest (CA) (6 or 8 min) and resuscitation. Animals were subjected to CA for 6 min (CA 6 min) or 8 min (CA 8 min) or sham operated, as outlined in Materials and Method section. Brain regions were analyzed for enzyme activity by measuring the capacity of homogenized tissue to convert heme (HO activity) or biliverdin (BVR activity) into bilirubin within 30 min. The obtained amount of BR was corrected for the underlying protein concentration and enzyme activity is given in nmol BR formed per mg protein in 30 min (nmol BR/mg protein/30 min). Data are shown for single animals (gray open symbols) in each group: sham (instrumented animals, open circles, n = 9), rats subjected to CA for 6 min (CA 6 min, open squares, n = 7) or 8 min (CA 8 min, open triangles, n = 6), indicating additionally group medians (thin black line) and 1st and 3rd quartiles (bold black lines). Differences between groups are indicated (one-way non-parametric ANOVA (Kruskal Wallis) Bonferroni-corrected; *p < 0.05; **p < 0.01).
Figure 4
Figure 4
Abundance of HO-2 in homogenates of mC (A) and Hc (B). Homogenates from brain regions of single animals were analyzed by SDS-PAGE and immunostained for HO-2 as described in Materials and Methods section. For quantification, band intensities of HO-2 specific staining were normalized to total protein staining of the respective gel lanes, in (C) for mC and in (D) for Hc. Values are given as AUFS (arbitrary units) as single data (gray open symbols) for each group: sham animals (open circles), rats subjected to cardiac arrest (CA) for 6 min (CA 6 min, open squares) or 8 min (CA 8 min, open triangles), indicating additionally group medians (thin black line) and 1st and 3rd quartiles (bold black lines). The numbers of analyzed animals per group are indicated below the graphs; a selection is displayed here. Total protein patterns of the respective gels are shown in Figure S1. Differences between groups are indicated (one-way non-parametric ANOVA (Kruskal Wallis) Bonferroni-corrected; *p < 0.01).
Figure 5
Figure 5
Representative pictures of HO-2 expression in hippocampus and motor cortex. (A–C) Expression of HO-2 in the Hc, bar = 30 μm, bar in inserts = 150 μm. (A) The signal intensity in the hippocampus (Hc) of sham animals is nearly similar to the expression in the respective overlying cerebral cortex (Co). (B,C) Reduced expression of HO-2 in the Hc of 6 and 8 min CA animals compared to the respective cerebral cortex and compared to sham animals. Inserts: HO-2 expression is detectable in all pyramidal neurons of sham animals (A), but only in viable pyramidal neurons [arrows in (B,C)] in CA animals. (D–F) Expression of HO-2 in the mC, bar = 30 μm; consistent expression of HO-2 in sham (D) as well as 6 (E) and 8 min (F) CA animals with increased staining intensity in some neurons.
Figure 6
Figure 6
Expression of, HO-1, HO-2, BVRA and TNFR1 mRNA in motor cortex and hippocampus 2 weeks following cardiac arrest (CA). Gene expression was quantified by qPCR. Data were normalized against the internal reference genes HPRT and Cyclophilin A and expressed relative to the IS (relative mRNA level). Gene expression levels are shown for single animals (gray open symbols) in each group: sham animals (open circles, n = 9), rats subjected to CA for 6 min (CA 6 min, open squares, n = 7) or 8 min (CA 8 min, open triangles, n = 6), indicating additionally group medians (thin black line) and 1st and 3rd quartiles (bold black lines). Significant differences between groups were calculated by one-way non-parametric ANOVA (Kruskal Wallis followed by Bonferroni-correction) and are indicated (*p < 0.05; ***p < 0.005).
Figure 7
Figure 7
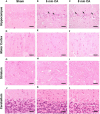
Representative pictures of hippocampus, motor cortex, striatum and cerebellum at 14 days after CA, HE-staining, bar = 30 μm. (A–C) Hippocampus, (A) sham animal with viable pyramidal neurons, no lesions present. (B) 6 min CA animal with many necrotic neurons (arrows) and few viable pyramidal neurons; (C) 8 min CA animal with many necrotic neurons (arrows) and only scattered viable pyramidal neurons. (D–F) Motor cortex, viable neurons in sham (D) as well as 6 (E) and 8 min CA (F) animals, no lesions present. (G–I) Striatum, viable neurons in sham (G) as well as 6 (H) and 8 min CA (I) animals, no lesions present. (J–L) Cerebellum, viable neurons in sham (J) as well as 6 (K) and 8 min CA (L) animals, no lesions present. CA, cardiac arrest.
Figure 8
Figure 8
Representative pictures of microglia and astrocyte activation after CA in the hippocampus, bar = 30 μm. (A–C) Detection of microglia (antibody against Iba1) in the Hc. (A) Normal appearance and numbers of microglial cells in sham animal. (B,C) Increased numbers of activated microglia in CA animals. (D–F) Detection of astrocytes (antibody against GFAP) in the Hc. (D) Normal appearance and numbers of astrocytes in sham animal. (E,F) Increased numbers of gemistocytes in CA animals. CA, cardiac arrest.

Similar articles

Cited by

References

    1. Lemiale V, Dumas F, Mongardon N, Giovanetti O, Charpentier J, Chiche JD, et al. . Intensive care unit mortality after cardiac arrest: the relative contribution of shock and brain injury in a large cohort. Intensive Care Med. (2013) 39:1972–80. 10.1007/s00134-013-3043-4 - DOI - PubMed
    1. Nolan JP, Neumar RW, Adrie C, Aibiki M, Berg RA, Boettiger BW, et al. . Post-cardiac arrest syndrome: epidemiology, pathophysiology, treatment, and prognostication. A Scientific Statement from the International Liaison Committee on Resuscitation; the American Heart Association Emergency Cardiovascular Care Committee; the Council on Cardiovascular Surgery and Anesthesia; the Council on Cardiopulmonary, Perioperative, and Critical Care; the Council on Clinical Cardiology; the Council on Stroke. Resuscitation. (2008) 79:350–79. 10.1016/j.resuscitation.2008.09.017 - DOI - PubMed
    1. Frisch S, Thiel F, Schroeter ML, Jentzsch RT. Apathy and cognitive deficits in patients with transient global ischemia after cardiac arrest. Cogn Behav Neurol. (2017) 30:172–5. 10.1097/WNN.0000000000000139 - DOI - PubMed
    1. Nunes B, Pais J, Garcia R, Magalhaes Z, Granja C, Silva MC. Cardiac arrest: long-term cognitive and imaging analysis. Resuscitation. (2003) 57:287–97. 10.1016/S0300-9572(03)00033-9 - DOI - PubMed
    1. Stamenova V, Nicola R, Aharon-Peretz J, Goldsher D, Kapeliovich M, Gilboa A. Long-term effects of brief hypoxia due to cardiac arrest: hippocampal reductions and memory deficits. Resuscitation. (2018) 126:65–71. 10.1016/j.resuscitation.2018.02.016 - DOI - PubMed