

Magnitude and time-course of excess mortality during COVID-19 outbreak: population-based empirical evidence from highly impacted provinces in northern Italy
- PMID: 33015145
- PMCID: PMC7520169
- DOI: 10.1183/23120541.00458-2020
Magnitude and time-course of excess mortality during COVID-19 outbreak: population-based empirical evidence from highly impacted provinces in northern Italy
Abstract
Background: The real impact of severe acute respiratory syndrome coronavirus 2 (SARS-CoV-2) on overall mortality remains uncertain as surveillance reports have attributed a limited number of deaths to novel coronavirus disease 2019 (COVID-19) during the outbreak. The aim of this study was to assess the excess mortality during the COVID-19 outbreak in highly impacted areas of northern Italy.
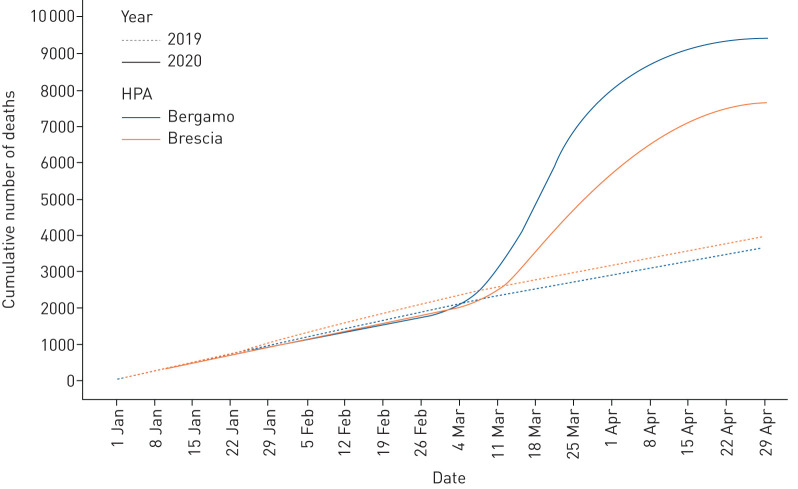
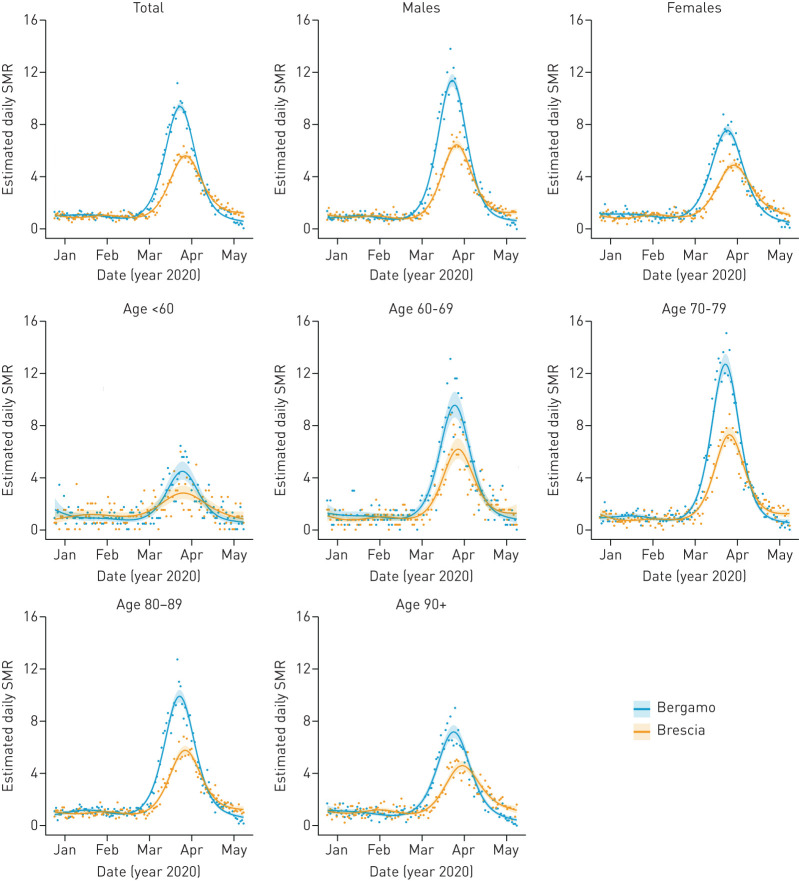
Methods: We analysed data on deaths that occurred in the first 4 months of 2020 provided by the health protection agencies (HPAs) of Bergamo and Brescia (Lombardy), building a time-series of daily number of deaths and predicting the daily standardised mortality ratio (SMR) and cumulative number of excess deaths through a Poisson generalised additive model of the observed counts in 2020, using 2019 data as a reference.
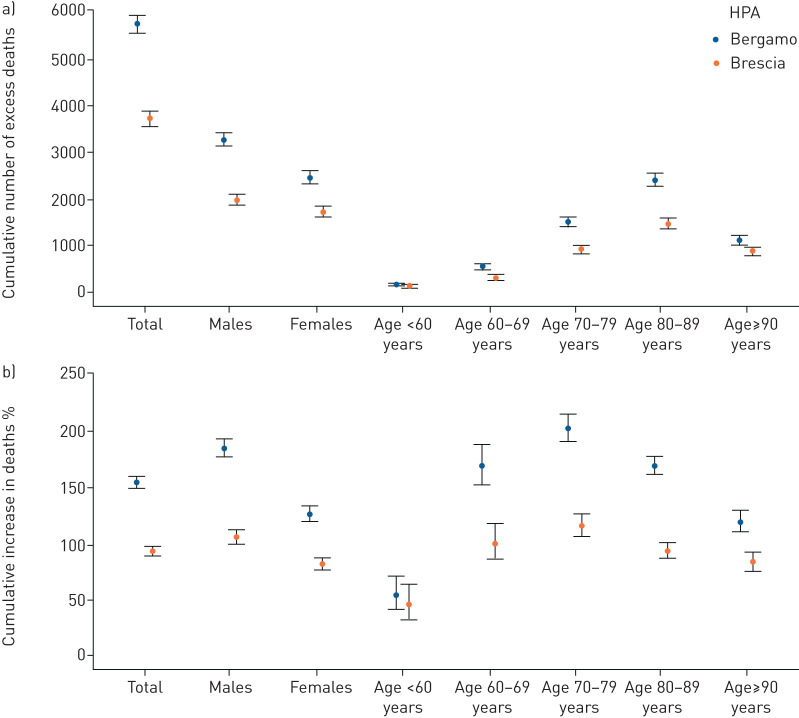
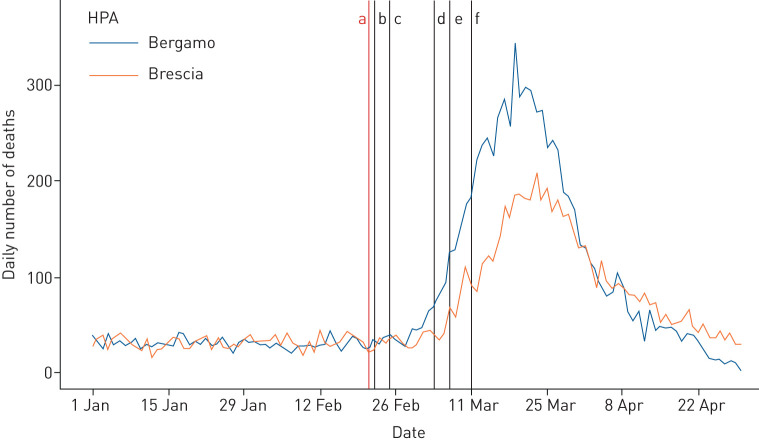
Results: We estimated that there were 5740 (95% credible set (CS) 5552-5936) excess deaths in the HPA of Bergamo and 3703 (95% CS 3535-3877) in Brescia, corresponding to a 2.55-fold (95% CS 2.50-2.61) and 1.93 (95% CS 1.89-1.98) increase in the number of deaths. The excess death wave started a few days later in Brescia, but the daily estimated SMR peaked at the end of March in both HPAs, roughly 2 weeks after the introduction of lockdown measures, with significantly higher estimates in Bergamo (9.4, 95% CI 9.1-9.7).
Conclusion: Excess mortality was significantly higher than that officially attributed to COVID-19, disclosing its hidden burden likely due to indirect effects on the health system. Time-series analyses highlighted the impact of lockdown restrictions, with a lower excess mortality in the HPA where there was a smaller delay between the epidemic outbreak and their enforcement.
Copyright ©ERS 2020.
Conflict of interest statement
Conflict of interest: S. Conti has nothing to disclose. Conflict of interest: P. Ferrara has nothing to disclose. Conflict of interest: G. Mazzaglia has nothing to disclose. Conflict of interest: M.I. D'Orso has nothing to disclose. Conflict of interest: R. Ciampichini has nothing to disclose. Conflict of interest: C. Fornari has nothing to disclose. Conflict of interest: F. Madotto has nothing to disclose. Conflict of interest: M. Magoni has nothing to disclose. Conflict of interest: G. Sampietro has nothing to disclose. Conflict of interest: A. Silenzi has nothing to disclose. Conflict of interest: C.V. Sileo has nothing to disclose. Conflict of interest: A. Zucchi has nothing to disclose. Conflict of interest: G. Cesana has nothing to disclose. Conflict of interest: L. Manzoli has nothing to disclose. Conflict of interest: L.G. Mantovani has nothing to disclose.
Figures
References
-
- Dipartimento della Protezione Civile www.opendatadpc.maps.arcgis.com/apps/opsdashboard/index.html#/b0c68bce2c... COVID-19 Italia – Monitoraggio della situazione. Date last accessed: July 2, 2020. Date last updated: July 2, 2020.
-
- Istituto Superiore di Sanità www.epicentro.iss.it/coronavirus/bollettino/Report-COVID-2019_25_giugno.pdf Caratteristiche dei pazienti deceduti positivi all'infezione da SARS-CoV-2 in Italia. Date last accessed: July 2, 2020.
-
- Istituto Superiore di Sanità www.epicentro.iss.it/coronavirus/sars-cov-2-sorveglianza-dati Sorveglianza integrata COVID-19. Date last accessed: July 2, 2020. Date last updated: June 25, 2020.
LinkOut - more resources
Full Text Sources
Miscellaneous