. 2020 Sep 28;6(3):00023-2020.
doi: 10.1183/23120541.00023-2020. eCollection 2020 Jul.

Current clinical methods of measurement of respiratory rate give imprecise values

Affiliations

Current clinical methods of measurement of respiratory rate give imprecise values

Gordon B Drummond et al. ERJ Open Res. .

Abstract

Background: Respiratory rate is a basic clinical measurement used for illness assessment. Errors in measuring respiratory rate are attributed to observer and equipment problems. Previous studies commonly report rate differences ranging from 2 to 6 breaths·min-1 between observers.

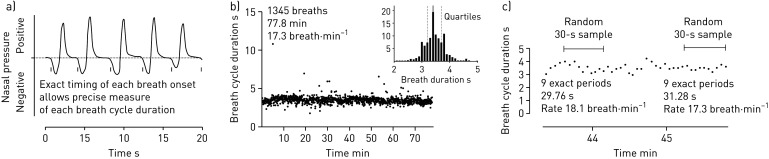
Methods: To study why repeated observations should vary so much, we conducted a virtual experiment, using continuous recordings of breathing from acutely ill patients. These records allowed each breathing cycle to be precisely timed. We made repeated random measures of respiratory rate using different sample durations of 30, 60 and 120 s. We express the variation in these repeated rate measurements for the different sample durations as the interquartile range of the values obtained for each subject. We predicted what values would be found if a single measure, taken from any patient, were repeated and inspected boundary values of 12, 20 or 25 breaths·min-1, used by the UK National Early Warning Score, for possible mis-scoring.

Results: When the sample duration was nominally 30 s, the mean interquartile range of repeated estimates was 3.4 breaths·min-1. For the 60 s samples, the mean interquartile range was 3 breaths·min-1, and for the 120 s samples it was 2.5 breaths·min-1. Thus, repeat clinical counts of respiratory rate often differ by >3 breaths·min-1. For 30 s samples, up to 40% of National Early Warning Scores could be misclassified.

Conclusions: Early warning scores will be unreliable when short sample durations are used to measure respiratory rate. Precision improves with longer sample duration, but this may be impractical unless better measurement methods are used.


Conflict of interest statement

Conflict of interest: G.B. Drummond reports a grant from the Edinburgh and Lothians Health Foundation for a previous study, not this one. Conflict of interest: D. Fischer has nothing to disclose. Conflict of interest: D.K. Arvind reports grants from the Edinburgh and Lothians Health Foundation during the conduct of the study, and patents on a “Method, Apparatus, Computer Program and System for Measuring Oscillatory Motion” issued in China (number ZL 2011 8 0027571.9, November 2015) and the USA (number US 9724019, August 2017).

Figures

FIGURE 1
FIGURE 1
a) Example of a nasal pressure trace. Nasal pressure decrease at the onset of each inspiration is detected automatically. Breath duration is calculated from the time between each mark. b) Each patient record consists of successive breath durations. The distribution of breath duration is shown in the insert, with the quartiles shown. c) Random samples are taken from this series, using a whole number of breath cycles, as close to 30 s as possible.
FIGURE 2
FIGURE 2
a) The distribution of separate rate value measurements (using 30 s samples) for the patient shown in figure 1, with median and quartile values, in relation to overall respiratory rate (shown as ●). b) Measurements from all subjects, with median and interquartile range, in relation to the overall respiratory rate for each subject, using a 30 s sample duration. c) The influence of a greater duration of sample on the interquartile range of the observations. Observations from each subject are linked.
FIGURE 3
FIGURE 3
Likelihood of repeat observations based on the entire observed population. The upper three distributions are based on 30 s samples, the lower three on 120 s samples. The histograms show the distribution of values that might be found if an initial observation of 12, 20 or 25 breaths·min−1 had been made, from any subject in the entire population, and this observation had been repeated. The open column indicates the chance that the first observation would be found again in a subsequent sample, and the blue columns the chances of observing values within 2 breaths min−1 of the initial observation. The variation of repeat measures is reduced when 120 s samples are used.
FIGURE 4
FIGURE 4
The proportion of measurements from each patient that would give a respiratory rate score the same as the score gained by the overall respiratory rate (the most precise measure) for that patient. The vertical dotted lines are the score cut-off values and the numbers above are the score values that are allocated for a rate in each zone. Panel (a) uses measurements made over 30 s, Panel (b) measurements made over 120 s. Scoring is much less consistent when the overall respiratory rate is between 20 and 25 breaths·min−1. Consistency improves when samples of longer duration are used. NEW: UK National Early Warning Score.

References

    1. Smith MEB, Chiovaro JC, Neil MO, et al. . early warning system scores for clinical deterioration in hospitalized patients: a systematic review. Ann Am Thorac Soc 2014; 11: 1454–1465. doi:10.1513/AnnalsATS.201403-102OC - DOI - PubMed
    1. Badawy J, Nguyen OK, Clark C, et al. . Is everyone really breathing 20 times a minute? Assessing epidemiology and variation in recorded respiratory rate in hospitalised adults. BMJ Qual Saf 2017; 26: 832–836. doi:10.1136/bmjqs-2017-006671 - DOI - PMC - PubMed
    1. Pedersen NE, Rasmussen LS, Petersen JA, et al. . A critical assessment of early warning score records in 168,000 patients. J Clin Monit Comput 2018; 32: 109–116. doi:10.1007/s10877-017-0003-5 - DOI - PubMed
    1. Brakenhoff TB, Mitroiu M, Keogh RH, et al. . Measurement error is often neglected in medical literature: a systematic review. J Clin Epidemiol 2018; 98: 89–97. doi:10.1016/j.jclinepi.2018.02.023 - DOI - PubMed
    1. Edmonds Z V, Mower WR, Lovato LM, et al. . The reliability of vital sign measurements. Ann Emerg Med 2002; 39: 233–237. doi:10.1067/mem.2002.122017 - DOI - PubMed

LinkOut - more resources