

A multi-scalar climatological analysis in preparation for extreme heat at the Tokyo 2020 Olympic and Paralympic Games
- PMID: 33015246
- PMCID: PMC7518767
- DOI: 10.1080/23328940.2020.1737479
A multi-scalar climatological analysis in preparation for extreme heat at the Tokyo 2020 Olympic and Paralympic Games
Abstract
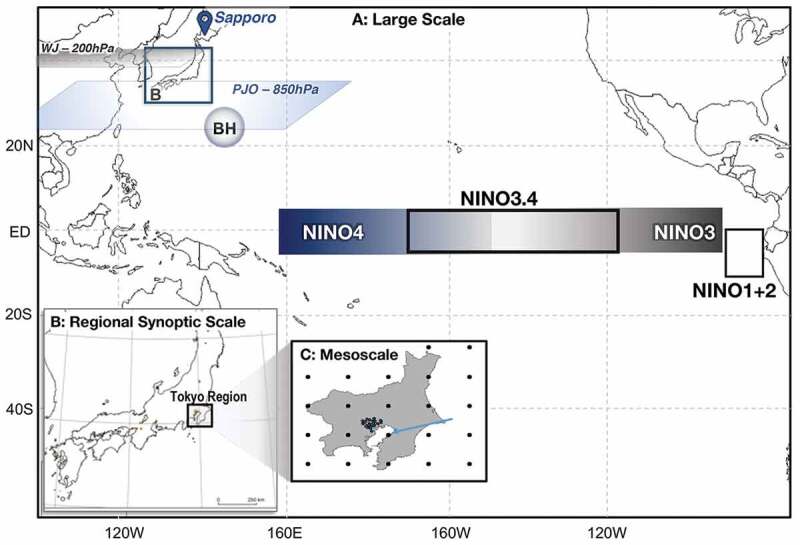
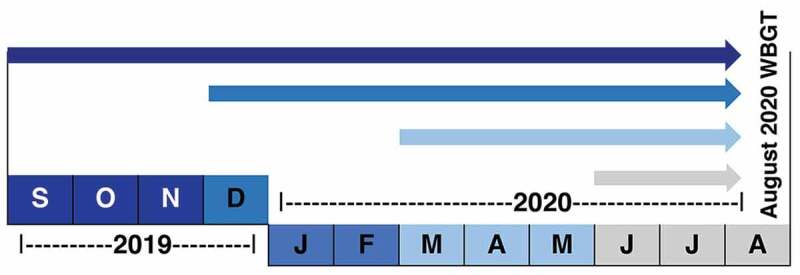
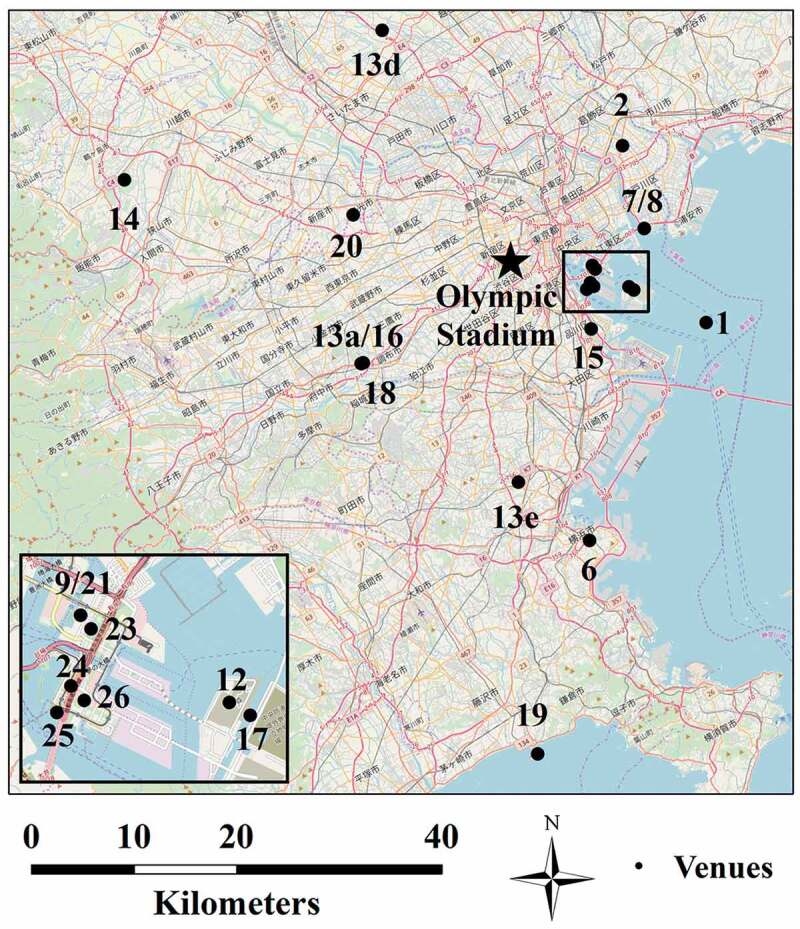
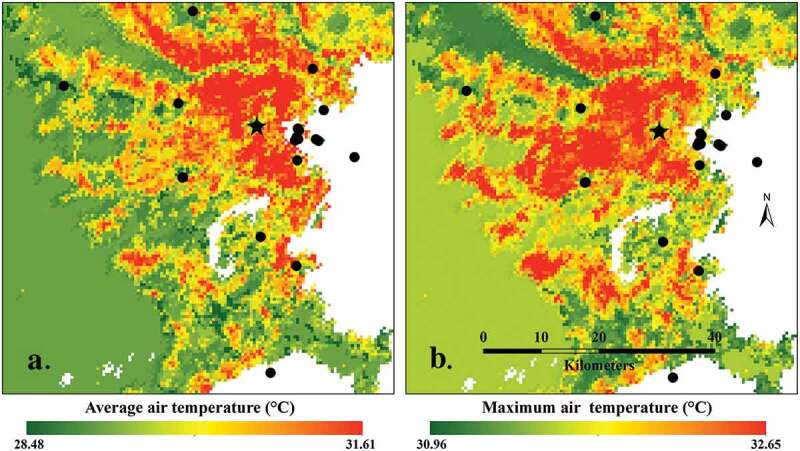
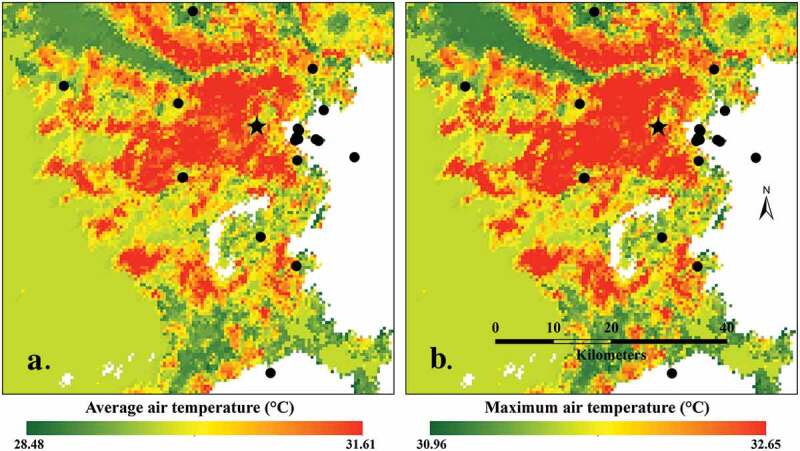
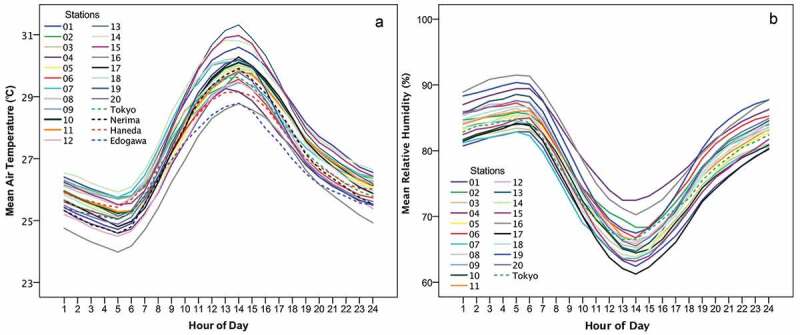
Extreme heat can be harmful to human health and negatively affect athletic performance. The Tokyo Olympic and Paralympic Games are predicted to be the most oppressively hot Olympics on record. An interdisciplinary multi-scale perspective is provided concerning extreme heat in Tokyo-from planetary atmospheric dynamics, including El Niño Southern Oscillation (ENSO), to fine-scale urban temperatures-as relevant for heat preparedness efforts by sport, time of day, and venue. We utilize stochastic methods to link daytime average wet bulb globe temperature (WBGT) levels in Tokyo in August (from meteorological reanalysis data) with large-scale atmospheric dynamics and regional flows from 1981 to 2016. Further, we employ a mesonet of Tokyo weather stations (2009-2018) to interpolate the spatiotemporal variability in near-surface air temperatures at outdoor venues. Using principal component analysis, two planetary (ENSO) regions in the Pacific Ocean explain 70% of the variance in Tokyo's August daytime WBGT across 35 years, varying by 3.95°C WGBT from the coolest to warmest quartile. The 10-year average daytime and maximum intra-urban air temperatures vary minimally across Tokyo (<1.2°C and 1.7°C, respectively), and less between venues (0.6-0.7°C), with numerous events planned for the hottest daytime period (1200-1500 hr). For instance, 45% and 38% of the Olympic and Paralympic road cycling events (long duration and intense) occur midday. Climatologically, Tokyo will present oppressive weather conditions, and March-May 2020 is the critical observation period to predict potential anomalous late-summer WBGT in Tokyo. Proactive climate assessment of expected conditions can be leveraged for heat preparedness across the Game's period.
Keywords: ENSO; Tokyo; athletes; extreme heat; wet bulb globe temperature.
© 2020 Informa UK Limited, trading as Taylor & Francis Group.
Conflict of interest statement
In accordance with Taylor & Francis policy and my ethical obligation as researchers, the following are potential COIs: DJC, AJG, YH: ● Have a potential COI as members of the IOC Adverse Weather Impact expert working Group for the Olympic Games Tokyo 2020; not receiving honorarium. WMT: ● Consultant interest that may arise from the research reported in the enclosed paper. Those interests are fully to Taylor & Francis with an approved plan for managing any potential conflicts arising from this reporting, such as publicly disclosing errors or corrections for the benefit of evolving the science and protecting it from error.
Figures
Comment in
-
Bracing for heat and humidity amidst new challenges in Tokyo: Comment on: Vanos JK, Thomas WM, Grundstein AJ, Hosokawa Y, Liu Y, Casa DJ. A multi-scalar climatological analysis in preparation for extreme heat at the Tokyo 2020 Olympic and Paralympic Games. Temperature 2020;7(2):191-214, DOI: 10.1080/23328940.2020.1737479.Temperature (Austin). 2021 Aug 17;8(3):206-208. doi: 10.1080/23328940.2021.1960104. eCollection 2021. Temperature (Austin). 2021. PMID: 34595324 Free PMC article. No abstract available.
Similar articles
-
Incidence and factor analysis for the heat-related illness on the Tokyo 2020 Olympic and Paralympic Games.BMJ Open Sport Exerc Med. 2023 Apr 7;9(2):e001467. doi: 10.1136/bmjsem-2022-001467. eCollection 2023. BMJ Open Sport Exerc Med. 2023. PMID: 37051574 Free PMC article.
-
Ambient Conditions Prior to Tokyo 2020 Olympic and Paralympic Games: Considerations for Acclimation or Acclimatization Strategies.Front Physiol. 2019 Apr 24;10:414. doi: 10.3389/fphys.2019.00414. eCollection 2019. Front Physiol. 2019. PMID: 31068829 Free PMC article.
-
Global warming and the Summer Olympic and Paralympic games: a perspective from the Tokyo 2020 Games.Environ Health Prev Med. 2022;27:7. doi: 10.1265/ehpm.21-00024. Environ Health Prev Med. 2022. PMID: 35288491 Free PMC article.
-
Heat-related issues and practical applications for Paralympic athletes at Tokyo 2020.Temperature (Austin). 2019 Jun 27;7(1):37-57. doi: 10.1080/23328940.2019.1617030. eCollection 2020. Temperature (Austin). 2019. PMID: 32166104 Free PMC article. Review.
-
Health risks and precautions for visitors to the Tokyo 2020 Olympic and Paralympic Games.Travel Med Infect Dis. 2018 Mar-Apr;22:3-7. doi: 10.1016/j.tmaid.2018.01.005. Epub 2018 Feb 15. Travel Med Infect Dis. 2018. PMID: 29360525 Review.
Cited by
-
Ethical dilemmas and validity issues related to the use of new cooling technologies and early recognition of exertional heat illness in sport.BMJ Open Sport Exerc Med. 2021 Apr 12;7(2):e001041. doi: 10.1136/bmjsem-2021-001041. eCollection 2021. BMJ Open Sport Exerc Med. 2021. PMID: 33927884 Free PMC article. Review.
-
Small changes in thermal conditions hinder marathon running performance in the tropics.Temperature (Austin). 2022 Jul 15;9(4):373-388. doi: 10.1080/23328940.2022.2086777. eCollection 2022. Temperature (Austin). 2022. PMID: 36339089 Free PMC article.
-
Increasing Health Risks During Outdoor Sports Due To Climate Change in Texas: Projections Versus Attitudes.Geohealth. 2022 Aug 9;6(8):e2022GH000595. doi: 10.1029/2022GH000595. eCollection 2022 Aug. Geohealth. 2022. PMID: 36254118 Free PMC article.
-
Bracing for heat and humidity amidst new challenges in Tokyo: Comment on: Vanos JK, Thomas WM, Grundstein AJ, Hosokawa Y, Liu Y, Casa DJ. A multi-scalar climatological analysis in preparation for extreme heat at the Tokyo 2020 Olympic and Paralympic Games. Temperature 2020;7(2):191-214, DOI: 10.1080/23328940.2020.1737479.Temperature (Austin). 2021 Aug 17;8(3):206-208. doi: 10.1080/23328940.2021.1960104. eCollection 2021. Temperature (Austin). 2021. PMID: 34595324 Free PMC article. No abstract available.
-
Beat the heat: How to become a gold medalist at the Tokyo Olympics.Temperature (Austin). 2021 Aug 19;8(3):203-205. doi: 10.1080/23328940.2021.1944005. eCollection 2021. Temperature (Austin). 2021. PMID: 34568516 Free PMC article. No abstract available.
References
-
- Ashie Y, Kono T.. Urban-scale CFD analysis in support of a climate-sensitive design for the Tokyo Bay area. Int J Climatol. 2011;31(2):174–188.
-
- Adachi SA, Kimura F, Kusaka H, et al. Comparison of the impact of global climate changes and urbanization on summertime future climate in the Tokyo metropolitan area. J Appl Meteorol Climatol. 2012;51(8):1441–1454.
-
- Enomoto T, Hoskins BJ, Matsuda Y. The formation mechanism of the Bonin high in August. Q J R Meteorol Soc. 2003;129(587):157–178.
-
- Mulcahy K. Public culture, cultural identity, cultural policy: comparative perspectives. In Galligan A editor. Patronizing mega-events to globalize identity: the Olympic opening ceremony as a cultural policy. New York (NY): Palgrave Macmillian; 2017. p. 65–92.
-
- de Freitas CR, Scott D, McBoyle G. A second generation climate index for tourism (CIT): specification and verification. Int J Biometeorol. 2008;52(5):399–407. - PubMed
LinkOut - more resources
Full Text Sources
Other Literature Sources