Systematic Assessment of Tumor Purity and Its Clinical Implications
- PMID: 33015524
- PMCID: PMC7529507
- DOI: 10.1200/PO.20.00016
Systematic Assessment of Tumor Purity and Its Clinical Implications
Abstract
Purpose: The tumor microenvironment is complex, comprising heterogeneous cellular populations. As molecular profiles are frequently generated using bulk tissue sections, they represent an admixture of multiple cell types (including immune, stromal, and cancer cells) interacting with each other. Therefore, these molecular profiles are confounded by signals emanating from many cell types. Accurate assessment of residual cancer cell fraction is crucial for parameterization and interpretation of genomic analyses, as well as for accurately interpreting the clinical properties of the tumor.
Materials and methods: To benchmark cancer cell fraction estimation methods, 10 estimators were applied to a clinical cohort of 333 patients with prostate cancer. These methods include gold-standard multiobserver pathology estimates, as well as estimates inferred from genome, epigenome, and transcriptome data. In addition, two methods based on genomic and transcriptomic profiles were used to quantify tumor purity in 4,497 tumors across 12 cancer types. Bulk mRNA and microRNA profiles were subject to in silico deconvolution to estimate cancer cell-specific mRNA and microRNA profiles.
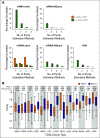
Results: We present a systematic comparison of 10 tumor purity estimation methods on a cohort of 333 prostate tumors. We quantify variation among purity estimation methods and demonstrate how this influences interpretation of clinico-genomic analyses. Our data show poor concordance between pathologic and molecular purity estimates, necessitating caution when interpreting molecular results. Limited concordance between DNA- and mRNA-derived purity estimates remained a general pan-cancer phenomenon when tested in an additional 4,497 tumors spanning 12 cancer types.
Conclusion: The choice of tumor purity estimation method may have a profound impact on the interpretation of genomic assays. Taken together, these data highlight the need for improved assessment of tumor purity and quantitation of its influences on the molecular hallmarks of cancers.
© 2020 by American Society of Clinical Oncology.
Conflict of interest statement
The following represents disclosure information provided by authors of this manuscript. All relationships are considered compensated unless otherwise noted. Relationships are self-held unless noted. I = Immediate Family Member, Inst = My Institution. Relationships may not relate to the subject matter of this manuscript. For more information about ASCO’s conflict of interest policy, please refer to www.asco.org/rwc or ascopubs.org/po/author-center. Open Payments is a public database containing information reported by companies about payments made to US-licensed physicians (Open Payments). Peter J. ParkHonoraria: Pfizer Consulting or Advisory Role: Neuroinflammation Newco Patents, Royalties, Other Intellectual Property: Patent on mutational signature-based detection of homologous recombination deficiencyPeter W. LairdConsulting or Advisory Role: Progenity, AnchorDx Patents, Royalties, Other Intellectual Property: Received royalties annually through 2018 for inventions licensed to Epigenomics AG by USC Travel, Accommodations, Expenses: AnchorDxWenyi WangStock and Other Ownership Interests: Genomic HealthFrancesca DemichelisPatents, Royalties, Other Intellectual Property: Co-inventor on a patent filed by the University of Michigan and the Brigham and Women’s Hospital covering the diagnostic and therapeutic fields for ETS fusions in prostate cancer. The diagnostic field has been licensed to Gen-Probe.Paul C. BoutrosConsulting or Advisory Role: BioSymetrics Patents, Royalties, Other Intellectual Property: Holds patents on multiple biomarkers No other potential conflicts of interest were reported.
Figures


References
-
- Hanahan D, Weinberg RA. Hallmarks of cancer: The next generation. Cell. 2011;144:646–674. - PubMed
-
- Junttila MR, de Sauvage FJ. Influence of tumour micro-environment heterogeneity on therapeutic response. Nature. 2013;501:346–354. - PubMed
-
- Smits AJ, Kummer JA, de Bruin PC, et al. The estimation of tumor cell percentage for molecular testing by pathologists is not accurate. Mod Pathol. 2014;27:168–174. - PubMed
Grants and funding
LinkOut - more resources
Full Text Sources
Molecular Biology Databases
Research Materials

