. 2020 Sep;2(3):lqaa078.
doi: 10.1093/nargab/lqaa078. Epub 2020 Sep 21.

ComBat-seq: batch effect adjustment for RNA-seq count data

Affiliations

ComBat-seq: batch effect adjustment for RNA-seq count data

Yuqing Zhang et al. NAR Genom Bioinform. 2020 Sep.

Abstract

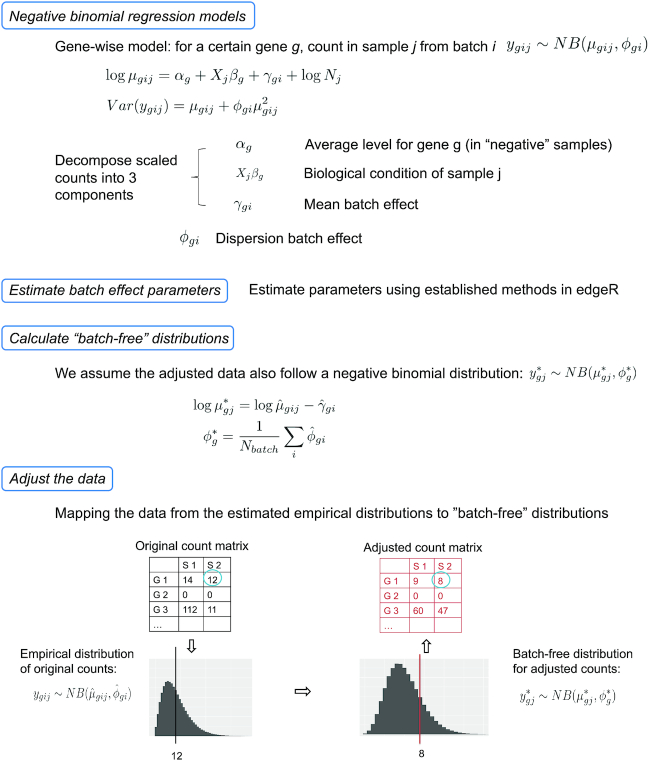
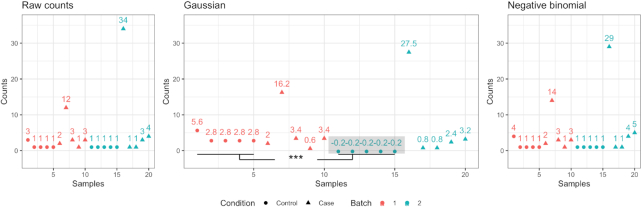
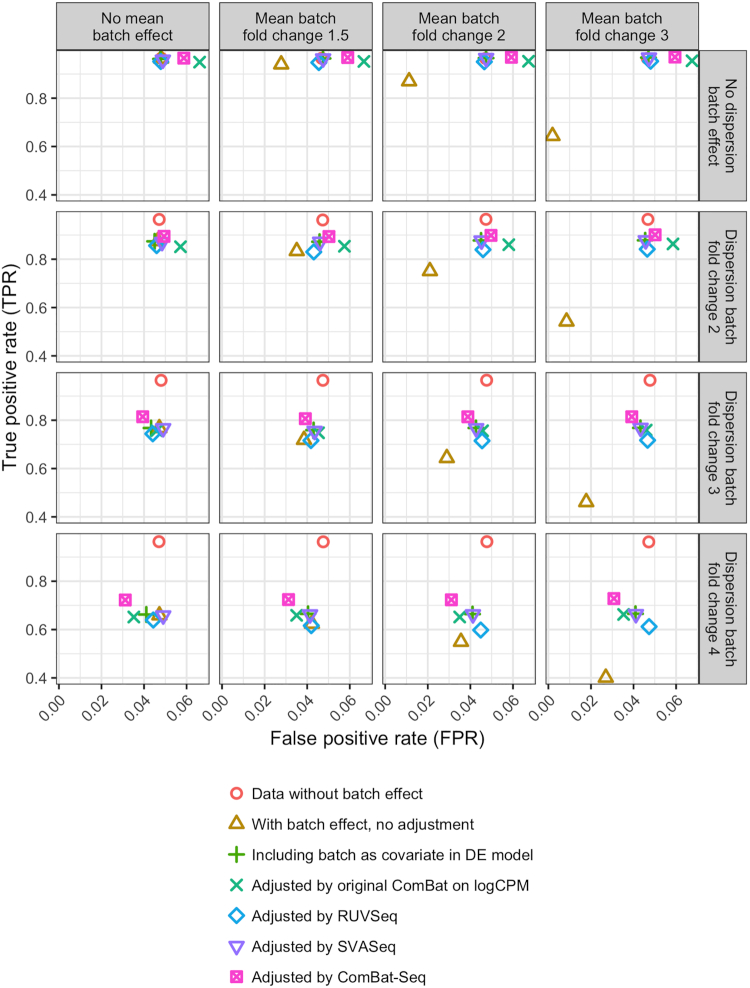
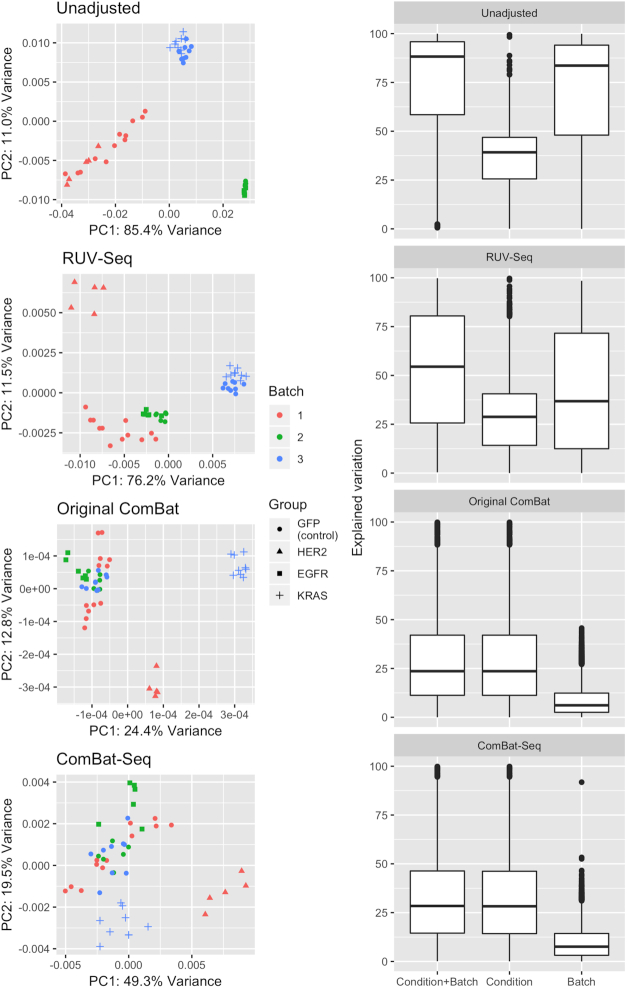
The benefit of integrating batches of genomic data to increase statistical power is often hindered by batch effects, or unwanted variation in data caused by differences in technical factors across batches. It is therefore critical to effectively address batch effects in genomic data to overcome these challenges. Many existing methods for batch effects adjustment assume the data follow a continuous, bell-shaped Gaussian distribution. However in RNA-seq studies the data are typically skewed, over-dispersed counts, so this assumption is not appropriate and may lead to erroneous results. Negative binomial regression models have been used previously to better capture the properties of counts. We developed a batch correction method, ComBat-seq, using a negative binomial regression model that retains the integer nature of count data in RNA-seq studies, making the batch adjusted data compatible with common differential expression software packages that require integer counts. We show in realistic simulations that the ComBat-seq adjusted data results in better statistical power and control of false positives in differential expression compared to data adjusted by the other available methods. We further demonstrated in a real data example that ComBat-seq successfully removes batch effects and recovers the biological signal in the data.


Figures

Figure 1.
Figure 1.
A diagram for the ComBat-seq modeling and adjustment workflow.
Figure 2.
Figure 2.
Problematic results caused by applying a Gaussian-based batch adjustment on count data. We simulated a count matrix with a balanced case-control design and two batches. The first panel shows the counts for a simulated gene which is expressed at low levels in most cases and control samples. However, one case sample in each batch, especially in the second batch, contains a large value. Adjustment based on a Gaussian distribution brings the mean of the two batches to the same level, causing artificially induced differences across control samples from the two batches (P-value = 0.0033). When applying ComBat-seq based on negative binomial distribution, the adjusted data no longer contain the negative values (shown in gray box) or the erroneous significant difference between control samples from the two batches.
Figure 3.
Figure 3.
Simulation results under increasing level of differences across batch in the mean and variance of expression. Batch effects in the mean or the variance will cause a loss of power for differential expression detection. While all methods are able to increase the power for analysis, ComBat-seq generally achieves the best power. Also, when there is a sufficient level of dispersion differences across batch, ComBat-seq is able to better control false positives than the other methods.
Figure 4.
Figure 4.
Application of ComBat-seq for removing batch effects in a pathway activation dataset. The unadjusted data contains a strong batch effect, as samples clearly separated by batch in the principal components (top left panel, ‘Unadjusted’). An effective adjustment is expected to bring control samples from the three batches to the same level, while maintaining biological signals from the different treated samples, each of which is only present in a single batch. We observed that in the PCA plots, ComBat-seq is able to recover the expected biological pattern, while RUV-seq was not able to fully address the batch effect. This is further shown in the analysis of explained variation in unadjusted data, and in data adjusted by ComBat-seq and RUV-seq. In the ComBat-seq adjusted data, variation explained by batch is greatly reduced compared to that in unadjusted data. Though ComBat-seq does not show improved results in this example than the current model used on logCPM, we emphasize its benefits in increased statistical power in differential expression than the current ComBat, as we have shown in the simulation studies.

References

    1. Leek J.T., Scharpf R.B., Bravo H.C., Simcha D., Langmead B., Johnson W.E., Geman D., Baggerly K., Irizarry R.A.. Tackling the widespread and critical impact of batch effects in high-throughput data. Nat. Rev. Genet. 2010; 11:733–739. - PMC - PubMed
    1. Robinson M.D., Oshlack A.. A scaling normalization method for differential expression analysis of rna-seq data. Genome Biol. 2010; 3:R25. - PMC - PubMed
    1. Risso D., Ngai J., Speed T.P., Dudoit S.. Normalization of rna-seq data using factor analysis of control genes or samples. Nat. Biotechnol. 2014a; 32:896–902. - PMC - PubMed
    1. Johnson W.E., Li C., Rabinovic A.. Adjusting batch effects in microarray expression data using empirical bayes methods. Biostatistics. 2007; 8:118–127. - PubMed
    1. Leek J.T. Svaseq: removing batch effects and other unwanted noise from sequencing data. Nucleic Acids Res. 2014; 42:e161. - PMC - PubMed