. 2020 Sep;2(3):zcaa028.
doi: 10.1093/narcan/zcaa028. Epub 2020 Sep 25.

DDX5 resolves R-loops at DNA double-strand breaks to promote DNA repair and avoid chromosomal deletions

Affiliations

DDX5 resolves R-loops at DNA double-strand breaks to promote DNA repair and avoid chromosomal deletions

Zhenbao Yu et al. NAR Cancer. 2020 Sep.

Abstract

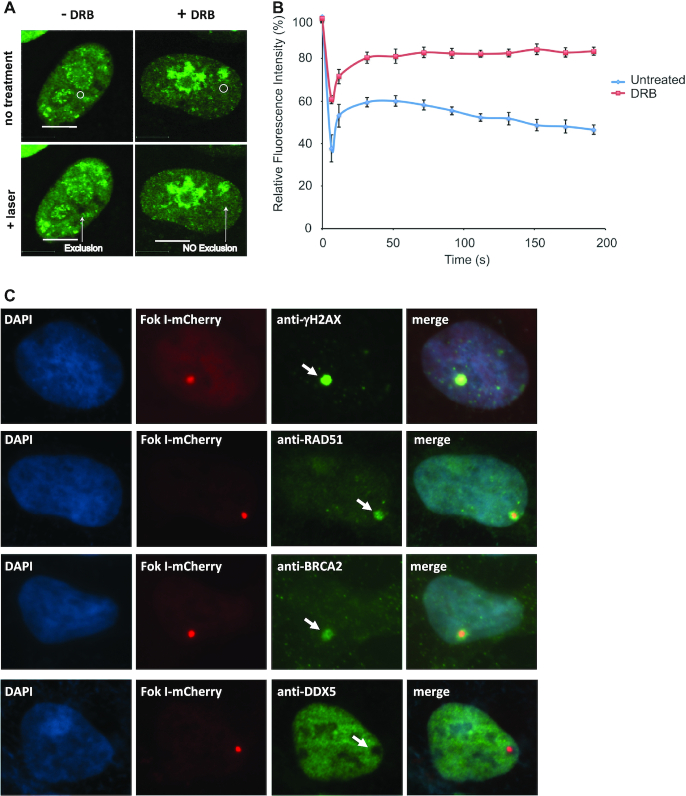
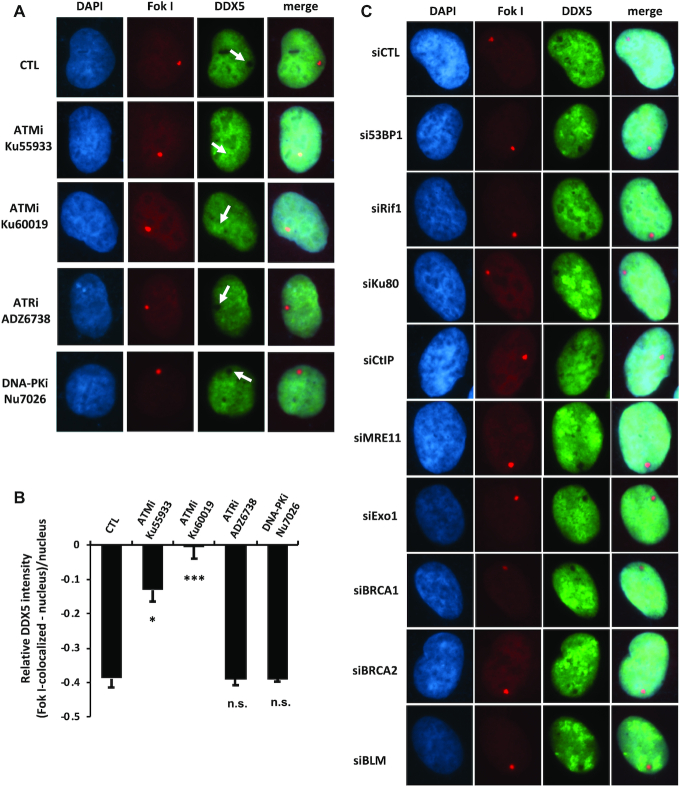
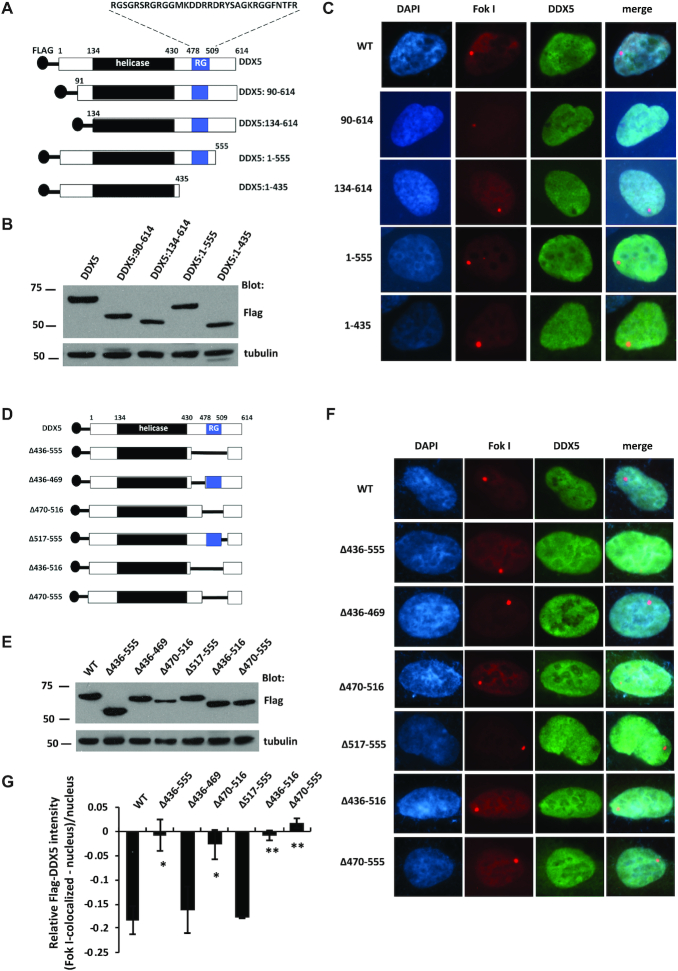
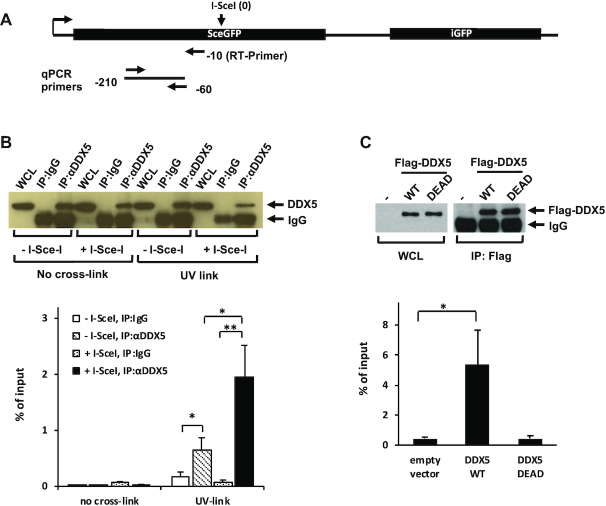
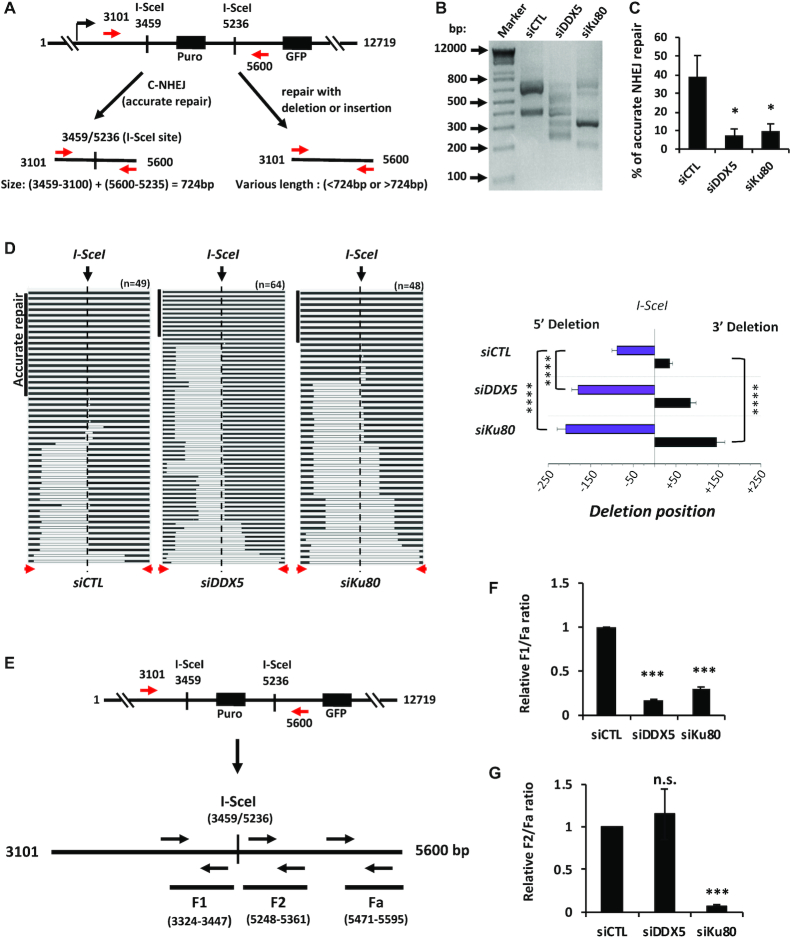
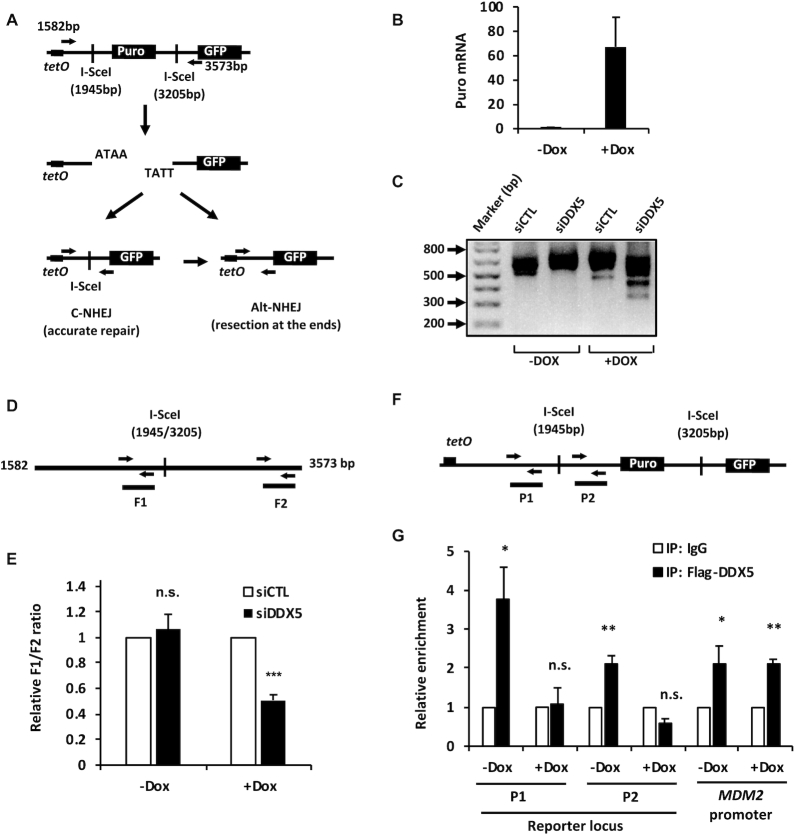
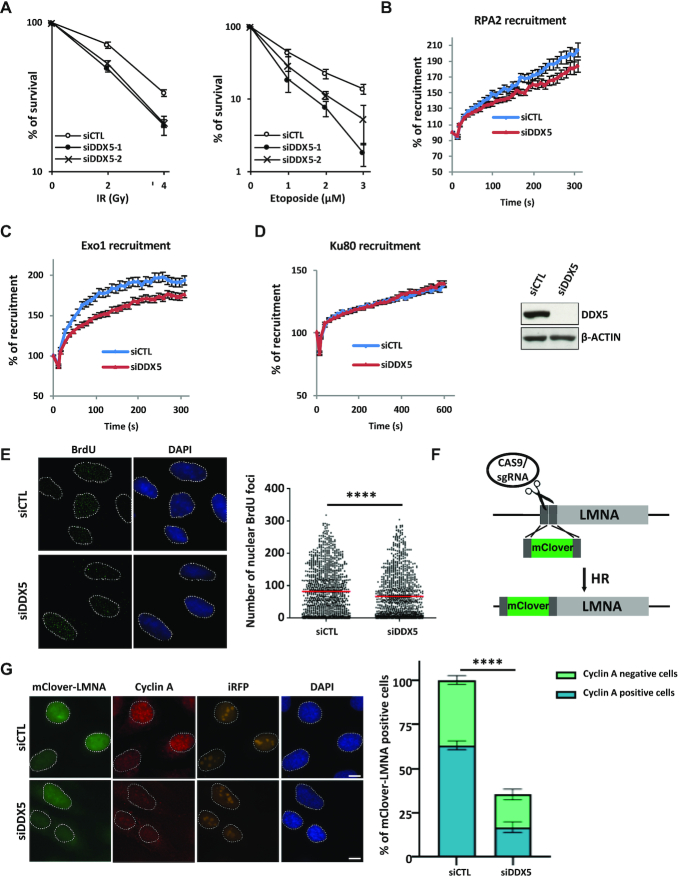
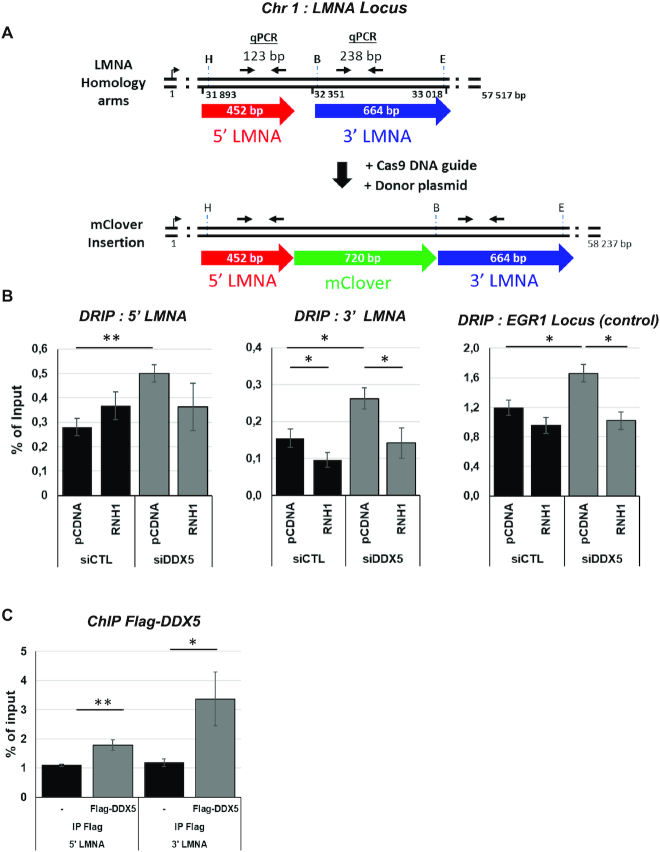
R-loops are three-stranded structures consisting of a DNA/RNA hybrid and a displaced DNA strand. The regulatory factors required to process this fundamental genetic structure near double-strand DNA breaks (DSBs) are not well understood. We previously reported that cellular depletion of the ATP-dependent DEAD box RNA helicase DDX5 increases R-loops genome-wide causing genomic instability. In this study, we define a pivotal role for DDX5 in clearing R-loops at or near DSBs enabling proper DNA repair to avoid aberrations such as chromosomal deletions. Remarkably, using the non-homologous end joining reporter gene (EJ5-GFP), we show that DDX5-deficient U2OS cells exhibited asymmetric end deletions on the side of the DSBs where there is overlap with a transcribed gene. Cross-linking and immunoprecipitation showed that DDX5 bound RNA transcripts near DSBs and required its helicase domain and the presence of DDX5 near DSBs was also shown by chromatin immunoprecipitation. DDX5 was excluded from DSBs in a transcription- and ATM activation-dependent manner. Using DNA/RNA immunoprecipitation, we show DDX5-deficient cells had increased R-loops near DSBs. Finally, DDX5 deficiency led to delayed exonuclease 1 and replication protein A recruitment to laser irradiation-induced DNA damage sites, resulting in homologous recombination repair defects. Our findings define a role for DDX5 in facilitating the clearance of RNA transcripts overlapping DSBs to ensure proper DNA repair.


Figures

Figure 1.
Figure 1.
DDX5 is excluded from DNA damage sites in a transcription-dependent manner. U2OS cells transfected with GFP-DDX5 were untreated or treated with 100 μM of DRB for 3 h. The cells were then micro-irradiated and imaged every 20 s for 3.5 min as described in the ‘Materials and Methods’ section. (A) A typical image was shown for each sample. (B) The fluorescence intensity of GFP-DDX5 at DNA damage sites relative to an unirradiated area was quantified and plotted over time. Data show the mean relative fluorescence intensity ± SE of ∼50 cells per condition from at least three independent experiments. (C) The cells transfected with the mCherry-LacI-FokI reporter system were treated with OHT and shield 1 for 4 h and the cells were fixed and stained with specific antibodies as described in the ‘Materials and Methods’ section.
Figure 2.
Figure 2.
ATM activity regulates DDX5 at DSBs. Cells harboring the mCherry-LacI-FokI reporter system were treated with the inhibitors of the three PIKK family of kinases (ATM, ATR or DNA-PK) (A, B) or transfected with indicated siRNAs (C). DDX5 exclusion from the FokI-induced DSBs was analyzed as described in the ‘Materials and Methods’ section. A typical image is shown for each sample. The fluorescence intensity of DDX5 at DNA damage sites relative to an unirradiated area was quantified. Data show the mean relative fluorescence intensity ± SE of ∼120 cells per condition from three independent experiments. Statistical significance was assessed using Student’s t-test: *P < 0.05; ***P < 0.001; n.s., not significant.
Figure 3.
Figure 3.
The region containing the RGG/RG motif is required for DDX5 exclusion from DSBs. (A, D) A scheme of DDX5 functional domains and mutant constructs. (B, E) Cells harboring the mCherry-LacI-FokI reporter system were transfected with Flag-tagged DDX5 mutants. The whole cell lysates were subjected to western blotting with the indicated antibodies. (C, F, G) DDX5 exclusion from the FokI-induced DSBs was analyzed as described in the ‘Materials and Methods’ section. A typical image is shown for each sample. The fluorescence intensity of DDX5 at DNA damage sites relative to an unirradiated area was quantified. Data show the mean relative fluorescence intensity ± SE of ∼120 cells per condition from three independent experiments. Statistical significance was assessed using Student’s t-test: *P < 0.05 and **P < 0.01.
Figure 4.
Figure 4.
I-SceI-mediated DSBs increase DDX5 binding to the RNA of the DRGFP reporter gene. (A) Illustration of primers used for reverse transcription (RT) and qPCR analysis. The RT primer is 10 bp upstream of the I-SceI cleavage site (−10). The qPCR primers amplify a 150 bp length of fragment at 60 bp upstream of the I-SceI cleavage site (−60). (B) DRGFP cells were transfected with empty vector (−I-SceI) and the I-SceI-expressing vector (+I-SceI), respectively, and then subjected to CLIP analysis as described in the ‘Materials and Methods’ section. The results were expressed as percentage of input. The graph shows the average and SEM from four independent experiments performed in triplicates. A typical western blot analysis shows the DDX5 immunoprecipitated with the antibodies. (C) DRGFP cells were co-transfected with the I-SceI-expressing vector, siDDX5 siRNA and siRNA-resistant Flag-tagged wild-type DDX5 or its catalytic inactive mutant (DDX5 DEAD). Cells were subjected to CLIP analysis. The graph shows the average and SEM from three independent experiments performed in triplicates. A typical western blot analysis shows the Flag-DDX5 immunoprecipitated with the anti-Flag antibody. Statistical significance was assessed using Student’s t-test: *P < 0.05 and **P < 0.01.
Figure 5.
Figure 5.
Deficiency of DDX5 causes extended deletions at DSB sites. (A) Illustration of the EJ5-GFP reporter system for NHEJ repair analysis and demonstration of the PCR reaction for amplification of the reporter DNA rejoined after cleavage of the two I-SceI sites. The PCR primers amplify a DNA fragment with a size of 724 bp if the two ends are accurately repaired. Under the PCR reaction condition, the DNA (2500 bp) without cleavage cannot be amplified. The U2OS-EJ5-GFP reporter cells were transfected with indicated siLuc control siRNA (siCTL), siDDX5 #1 (siDDX5) and siKu80, respectively. Forty to forty-four hours after the siRNA transfection, the cells were then transfected with I-SceI-expressing vector (pCAG-I-SceI). Forty-eight hours after the plasmid transfection, the cells were harvested and genomic DNA extracted for PCR and sequencing analysis. (B) A representative agarose gel analysis of the PCR products. (C) The PCR products were subcloned in pGEM-T vector and individual clones were subjected to sequencing analysis. The graph shows the percentage of clones with accurate repair performed from four independent experiments. (D) Graphical representation of the extended deletions flanking the I-SceI cut site in siCTL, siDDX5 and siKu80 cells. On the left side is a schematic representation of the sequence alignment obtained with the cloned PCR products from panel (B). The horizontal black boxes indicate matched reads, while the white boxes indicate deletions. The red arrowheads indicated the position of the PCR primers. The top left vertical black box indicated reads with accurate repair. On the right is the quantification of deletions identified by DNA sequencing individual clones (n represents the number of individual clones sequenced: n = 49 for siCTL, n = 64 siDDX5 and n = 48 for siKu80). ****P < 0.0001. (E–G) The PCR products amplified with the primers as in (A) were subjected to qPCR analysis targeting different regions surrounding the I-SceI sites. The ratio of each fragments to the fragment Fa was normalized to the one in the siCTL sample. SEM from two independent experiments performed in triplicates. Statistical significance was assessed using Student’s t-test: *P < 0.05; **P < 0.01; ***P < 0.001; n.s., not significant.
Figure 6.
Figure 6.
Increased DNA end deletions in DDX5-deficient cells are associated with local gene transcription. (A) Illustration of a tetracycline-induced (tetO) reporter system for NHEJ repair analysis in HEK293. The reporter construct is similar to the one described in Figure 4A except that the reporter expression is controlled by a tet-on promoter. (B) RT-qPCR analysis of the expression of puromycin in the absence (−Dox) or presence (+Dox) of 1 μg/ml Dox. (C) The HEK293-tetO-puro-GFP reporter cells were transfected with indicated siLuc control siRNA (siCTL) and siDDX5 #3 (siDDX5), respectively, in the absence (−Dox) or presence (+Dox) of 1 μg/ml Dox. Forty to forty-four hours after the siRNA transfection, the cells were then transfected with I-SceI-expressing vector (pCAG-I-SceI). Seventy hours after the plasmid transfection, the cells were harvested and the genomic DNA was extracted for PCR analysis using the primers shown in (A). The PCR primers amplify a DNA fragment with a size of 733 bp if the two ends are accurately repaired. Under the PCR reaction condition, the DNA (3573–1581 equals 1992 bp) without cleavage cannot be amplified. A representative agarose gel was shown for the analysis of the PCR products. (D) The PCR products amplified with the primers as in (A) were subjected to qPCR analysis targeting different regions surrounding the I-SceI sites. The ratio of F1/F2 that was normalized to the one in the siCTL sample. (E) The graph shows the average and SEM from three independent experiments performed in triplicates. (F, G) The HEK293-tetO-puro-GFP reporter cells were co-transfected with Flag-DDX5 and I-SceI-expressing plasmids in the absence (−Dox) or presence (+Dox) of 1 μg/ml Dox. ChIP-qPCR was performed to determine DDX5 occupancy near the I-SceI-cleaved DNA breaks (P1 and P2). MDM2 promoter region was used as a positive control. The results were normalized to IgG control at each condition. The graph shows the average and SEM from four independent experiments. Statistical significance was assessed using Student’s t-test: *P < 0.05; *P < 0.01; ***P < 0.001; n.s., no significant.
Figure 7.
Figure 7.
DDX5 deficiency affects HDR. (A) U2OS cells were transfected with the siCTL, siDDX5-1 or siDDX5-2. Three days after transfection, the cells were treated with different dosage of IR or etoposide (3 h) as indicated or left untreated. Colony survival analysis was performed as described in the ‘Materials and Methods’ section. The graph shows the average and SEM from three independent experiments performed in triplicates. (B–D) Seventy-two hours after siRNA transfection, recruitment of GFP-RPA2 (B), GFP-EXO1 (C) or GFP-Ku80 (D) to laser-induced DNA damage was analyzed for indicated times after damage. The graph shows the mean ± SEM from at least three independent experiments totalizing at least 75 cells. (E) Seventy-two hours after siRNA transfection, irradiated U2OS cells (10 Gy, 4 h release) were subjected to BrdU staining. Graph shows mean ± SEM from three replicates. (F) The LMNA assay: a specific Lamina sgRNA induced targeted cutting of the Lamin A gene by the Cas9, creating a DSB. When the DSB is repaired by HDR, the donor DNA, which includes mClover sequence flanked by two homology regions corresponding to each side of the site of cutting, is inserted in the Lamin A gene, leading to an mClover LMNA fluorescent protein. (G) Forty-eight hours after siRNA transfection, U2OS cells were transfected with the CRISPR–Cas LMNA HDR system and iRFP plasmids. Twenty-four hours later, cells were fixed and subjected to immunofluorescence against cyclin A. Clover-positive cells among iRFP-positive cells were quantified and cyclin A status (positive or negative) was assigned to each cell. The experiment was performed three times, with at least 250 cells counted for each replicate. ****P < 0.0001.
Figure 8.
Figure 8.
The CRISPR–Cas LMNA HDR system accumulates R-loops in a DDX5-dependent manner. (A) Illustration of the Cas9-directed knock-in of the Clover in the LMNA coding sequence. The red and the blue arrows represent both arms used for HDR. Cells were transfected with plasmids for CRISPR–Cas LMNA HDR analysis. B, E and H denote the location of the BsrGI, EcoRI and HindIII restriction sites. qPCR amplification region is shown at the top of the red homology arm of the LMNA used for the DRIP-qPCR. (B) HEK293 cells were transfected with pcDNA or RNAse H1 (RNH1) expressing vector along with the siRNAs. Cells were then transfected with the CRISPR–Cas LMNA HDR system and iRFP plasmids and subjected to DRIP-qPCR analysis at both LMNA homology arms and the EGR1 control locus. (C) HEK293 cells were transfected with Flag-DDX5 and subjected to ChIP-qPCR analysis. The bar graphs are the average and SEM from three independent experiments. Statistical significance was assessed using t-test: *P < 0.05 and **P < 0.01.

Similar articles

Cited by

References

    1. Chedin F., Benham C.J. Emerging roles for R-loop structures in the management of topological stress. J. Biol. Chem. 2020; 295:4684–4695. - PMC - PubMed
    1. Proudfoot N.J. Transcriptional termination in mammals: stopping the RNA polymerase II juggernaut. Science. 2016; 352:aad9926. - PMC - PubMed
    1. Crossley M.P., Bocek M., Cimprich K.A. R-loops as cellular regulators and genomic threats. Mol. Cell. 2019; 73:398–411. - PMC - PubMed
    1. García-Muse T., Aguilera A. R loops: from physiological to pathological roles. Cell. 2019; 179:604–618. - PubMed
    1. Cohen S., Puget N., Lin Y.L., Clouaire T., Aguirrebengoa M., Rocher V., Pasero P., Canitrot Y., Legube G. Senataxin resolves RNA:DNA hybrids forming at DNA double-strand breaks to prevent translocations. Nat. Commun. 2018; 9:533. - PMC - PubMed