. 2020 Sep 22;1(6):100096.
doi: 10.1016/j.xcrm.2020.100096.

Treatment with Commonly Used Antiretroviral Drugs Induces a Type I/III Interferon Signature in the Gut in the Absence of HIV Infection

Affiliations

Treatment with Commonly Used Antiretroviral Drugs Induces a Type I/III Interferon Signature in the Gut in the Absence of HIV Infection

Sean M Hughes et al. Cell Rep Med. .

Abstract

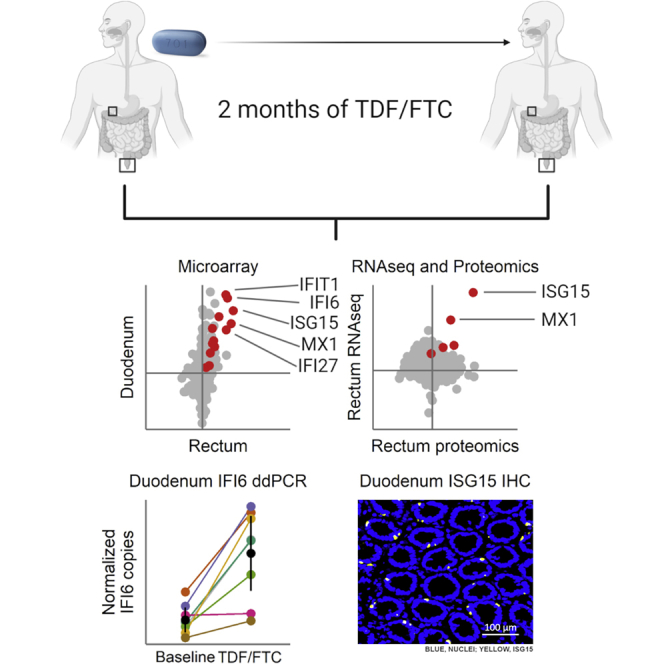
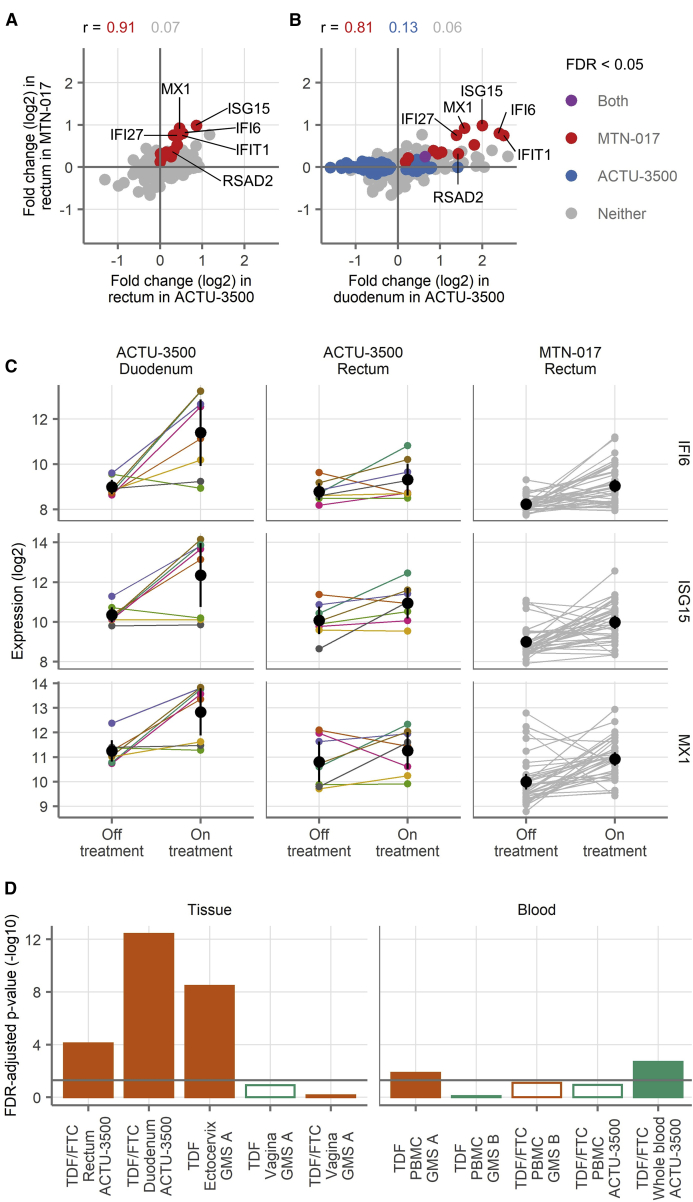
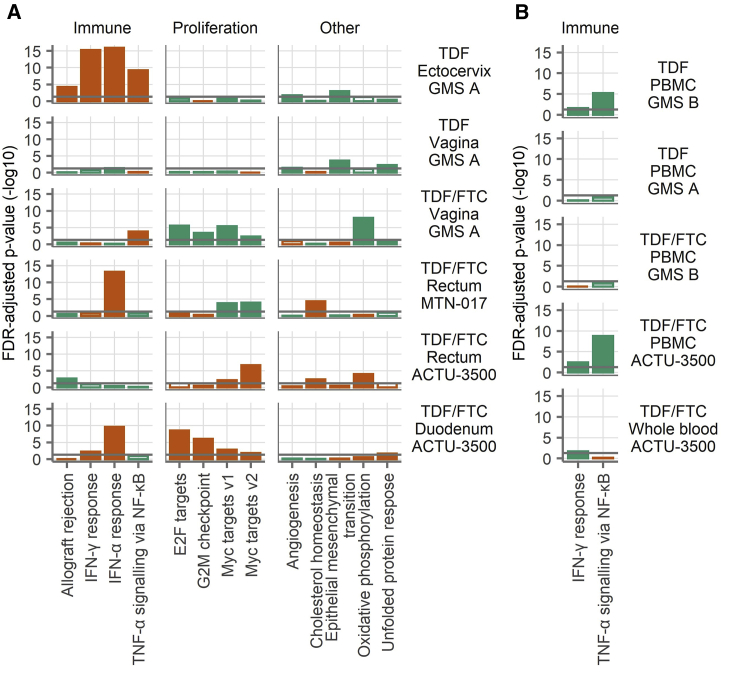
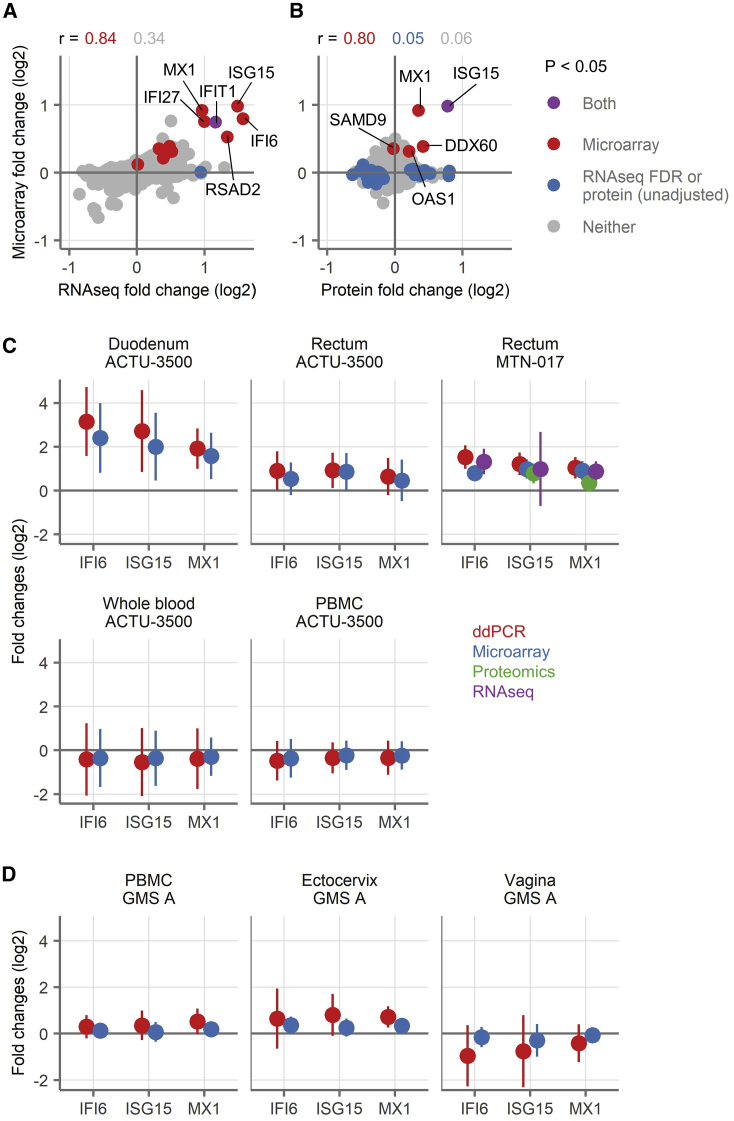
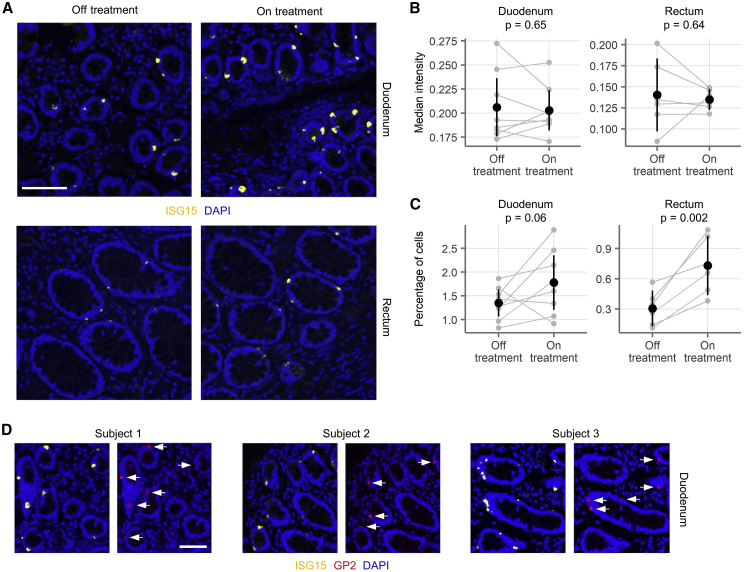
Tenofovir disoproxil fumarate (TDF) and emtricitabine (FTC) are used for HIV treatment and prevention. Previously, we found that topical rectal tenofovir gel caused immunological changes in the mucosa. Here, we assess the effect of oral TDF/FTC in three HIV pre-exposure prophylaxis trials, two with gastrointestinal and one with cervicovaginal biopsies. TDF/FTC induces type I/III interferon-related (IFN I/III) genes in the gastrointestinal tract, but not blood, with strong correlations between the two independent rectal biopsy groups (Spearman r = 0.91) and between the rectum and duodenum (r = 0.81). Gene set testing also indicates stimulation of the type I/III pathways in the ectocervix and of cellular proliferation in the duodenum. mRNA sequencing, digital droplet PCR, proteomics, and immunofluorescence confirm IFN I/III pathway stimulation in the gastrointestinal tract. Thus, oral TDF/FTC stimulates an IFN I/III signature throughout the gut, which could increase antiviral efficacy but also cause chronic immune activation in HIV prevention and treatment settings.

Keywords: ART; HIV; HIV cure; ISG15; antiretroviral treatment; chronic immune activation; gut; interferon; tenofovir.


Conflict of interest statement

J.M.B. is on the advisory boards of Gilead Sciences, Merck, and Janssen. I.M. is the Chief Medical Officer of Orion Biotechnology. All of the other authors declare no competing interests.

Figures

None
Graphical abstract
Figure 1
Figure 1
Gene Expression across Study Arms by Microarray Analysis (A and B) Fold changes of all genes detected in the rectal samples in MTN-017 compared to the rectal samples from ACTU-3500 (A) and the duodenal samples from ACTU-3500 (B). The colors indicate genes with FDR-adjusted p < 0.05 in MTN-017 (red), ACTU-3500 (blue), both (purple), or neither (gray). Spearman correlation coefficients for the genes falling into each subset are shown. (C) Expression levels of IFI6, ISG15, and MX1 in individual samples. Small points indicate measurements from a single biopsy, with lines connecting the matching observation from the same donor. For ACTU-3500, the color of the lines and symbols indicate the participant and are consistent across the panels. The black symbols and vertical lines show the means and 95% confidence intervals of the mean. (D) Gene set testing of a custom gene set composed of differentially expressed genes from the rectum in MTN-017 performed in the other study arms in the mucosa (left) and blood (right), comparing the expression of genes in the set to all of the other detected genes within each study arm. The bars indicate the result of a test against the study labeled on the x axis. The filled bars indicate an FDR-adjusted p < 0.05 and open symbols the opposite, with the bar height showing the −log10 of the FDR-adjusted p value. The colors indicate the direction of change, with orange indicating more expression during product use and green indicating the opposite. The horizontal gray line shows an FDR-adjusted p = 0.05. The sample sizes are shown in Table 1. Each sample was run in singlicate by microarray.
Figure 2
Figure 2
Hallmark Gene Sets (A and B) Gene set testing was performed on the Hallmark gene sets in the mucosa (A) and the blood (B). To reduce the number of gene sets displayed and focus on those gene sets that were affected in multiple studies, we show only those gene sets that had an FDR-adjusted p < 0.05 in at least two of the mucosa (A) or blood (B) study arms. The bars indicate the result of a gene set test for the gene set shown on the x axis tested against the study shown at right. The filled bars indicate an FDR-adjusted p < 0.05 and open bars the opposite, with the bar length proportional to the −log10 of the FDR-adjusted p value. The colors indicate the direction of change, with orange indicating more expression during product use and green indicating less expression. The horizontal gray lines show an FDR-adjusted p = 0.05. The gene sets are grouped into categories as labeled at top. The sample sizes are shown in Table 1. Each sample was run in singlicate by microarray.
Figure 3
Figure 3
Comparison of Gene Expression Changes Measured by ddPCR, RNA-Seq, Proteomics, and Microarray (A and B) Correlation of fold changes of genes as detected by microarray (y axis) with genes detected by RNA-seq (A) or proteins detected by proteomics (B) from the rectal samples from MTN-017. The colors indicate genes with FDR-adjusted p < 0.05 in microarray transcripts (red), RNA-seq genes (blue, by FDR, A) or proteins (blue, unadjusted p value, B), both (purple, FDR for microarray and RNA-seq, unadjusted p value for protein), or neither (gray). Spearman correlation coefficients for the genes falling into each subset are shown. Selected genes are labeled. (C and D) Fold changes in gene expression of three genes (IFI6, ISG15, or MX1) as detected by ddPCR (red), microarray (blue), proteomics (green), and RNA-seq (purple) after treatment with TDF/FTC (C) or TDF alone (D). The symbols show the mean across all of the participants and vertical lines show the 95% confidence intervals of the mean. ISG15, ISG15 ubiquitin-like modifier; MX1, MX dynamin-like GTPase 1. A positive fold change means higher expression during treatment, and a negative fold change means higher expression off treatment. For ddPCR, the expression of each gene of these three genes was normalized to the expression of ubiquitin C (UBC), which was chosen as reference due to the stability of its expression across tissues and treatments in the microarray data. The sample sizes are shown in Table 1. Each sample was run in singlicate by RNA-seq, proteomics, and microarray, while samples were run in duplicate technical replicates by ddPCR.
Figure 4
Figure 4
Immunofluorescence Microscopy Staining for ISG15 (A) 20× magnification images of duodenal (top) and rectal (bottom) biopsies, stained for ISG15 (yellow) and DAPI (blue). Biopsies from pre-treatment (left) and at the end of 2 months of treatment (right) are shown. Scale bar, 100 μm. The duodenal biopsies came from one donor and the rectal biopsies came from a second donor. (B) ISG15 intensity on ISG15+ cells was measured in paired duodenal (n = 8 donors) and rectal (n = 6) biopsies from ACTU-3500. The median intensity of all of the cells measured is shown. (C) The percentage of ISG15+ cells out of all epithelial cells is shown for the same biopsies as in (B). In (B) and (C), gray points indicate measurements from a single biopsy, with gray lines connecting the matching observation from the same donor. The black symbols and vertical lines show the means and 95% confidence intervals of the mean. p values are indicated from one-sided paired t tests. (D) Co-staining of duodenal biopsies from three individuals for ISG15 and glycoprotein 2 (GP2). Anti-GP2 was raised against a peptide component of pancreatic secretory (zymogen) granules and has some cross-reactivity with microfold (M) cells. GP2+ cells co-express ISG15 (white arrows), but not all ISG15+ cells are GP2+. Scale bar, 100 μm.

References

    1. Lerner A.M., Eisinger R.W., Fauci A.S. Comorbidities in Persons With HIV: The Lingering Challenge. JAMA. 2019;323:19–20. - PubMed
    1. Alzahrani J., Hussain T., Simar D., Palchaudhuri R., Abdel-Mohsen M., Crowe S.M., Mbogo G.W., Palmer C.S. Inflammatory and immunometabolic consequences of gut dysfunction in HIV: Parallels with IBD and implications for reservoir persistence and non-AIDS comorbidities. EBioMedicine. 2019;46:522–531. - PMC - PubMed
    1. Okwundu C.I., Uthman O.A., Okoromah C.A. Antiretroviral pre-exposure prophylaxis (PrEP) for preventing HIV in high-risk individuals. Cochrane Database Syst. Rev. 2012;(7):CD007189. - PMC - PubMed
    1. Owens D.K., Davidson K.W., Krist A.H., Barry M.J., Cabana M., Caughey A.B., Curry S.J., Doubeni C.A., Epling J.W., Jr., Kubik M., US Preventive Services Task Force Preexposure Prophylaxis for the Prevention of HIV Infection: US Preventive Services Task Force Recommendation Statement. JAMA. 2019;321:2203–2213. - PubMed
    1. Estes J.D., Kityo C., Ssali F., Swainson L., Makamdop K.N., Del Prete G.Q., Deeks S.G., Luciw P.A., Chipman J.G., Beilman G.J. Defining total-body AIDS-virus burden with implications for curative strategies. Nat. Med. 2017;23:1271–1276. - PMC - PubMed

Publication types

MeSH terms