

Respiratory supercomplexes enhance electron transport by decreasing cytochrome c diffusion distance
- PMID: 33016568
- PMCID: PMC7726804
- DOI: 10.15252/embr.202051015
Respiratory supercomplexes enhance electron transport by decreasing cytochrome c diffusion distance
Abstract
Respiratory chains are crucial for cellular energy conversion and consist of multi-subunit complexes that can assemble into supercomplexes. These structures have been intensively characterized in various organisms, but their physiological roles remain unclear. Here, we elucidate their function by leveraging a high-resolution structural model of yeast respiratory supercomplexes that allowed us to inhibit supercomplex formation by mutation of key residues in the interaction interface. Analyses of a mutant defective in supercomplex formation, which still contains fully functional individual complexes, show that the lack of supercomplex assembly delays the diffusion of cytochrome c between the separated complexes, thus reducing electron transfer efficiency. Consequently, competitive cellular fitness is severely reduced in the absence of supercomplex formation and can be restored by overexpression of cytochrome c. In sum, our results establish how respiratory supercomplexes increase the efficiency of cellular energy conversion, thereby providing an evolutionary advantage for aerobic organisms.
Keywords: bioenergetics; competitive fitness; cryo-EM; mitochondria; respiratory chain supercomplexes.
© 2020 The Authors. Published under the terms of the CC BY 4.0 license.
Conflict of interest statement
The authors declare that they have no conflict of interest.
Figures
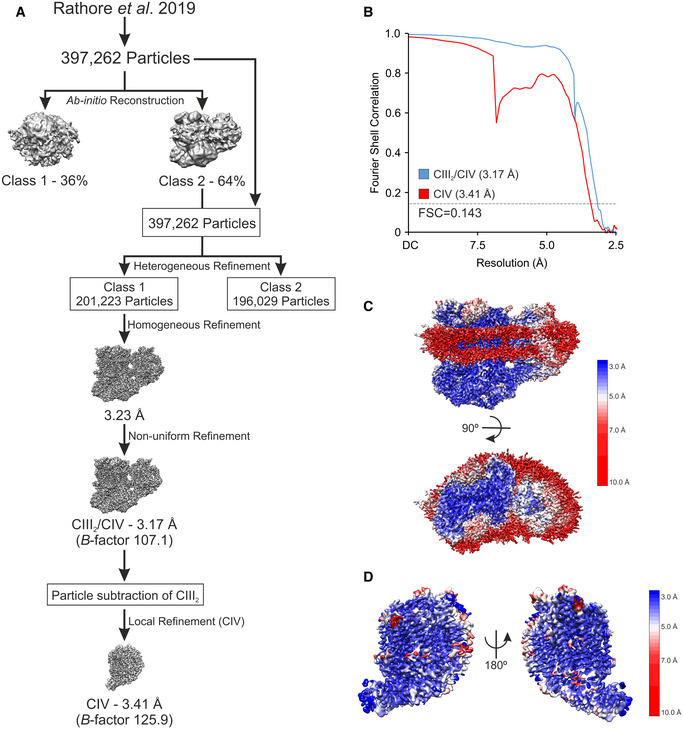
- A
Schematic illustration of Workflow of cryo‐EM processing.
- B
Gold‐standard Fourier shell correlation (FSC) of the CIII2/CIV supercomplex and the CIV density maps after final refinements. FSC = 0.143 is presented as dashed line.
- C, D
Local resolution maps of the CIII2/CIV supercomplex viewed along the mitochondrial inner membrane (IM) and from the mitochondrial intermembrane space (IMS) side (C), and the CIV density after particle subtraction of CIII2 and the digitonin micelle viewed from two rotations along the mitochondrial inner membrane (D).
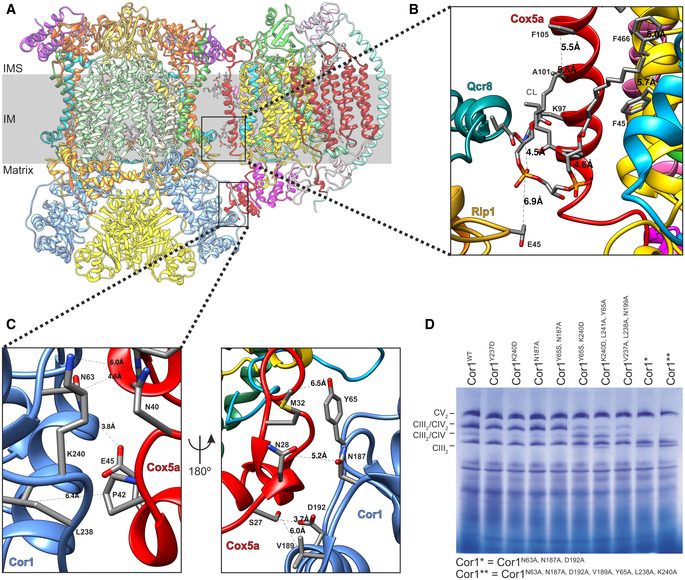
- A
Side view of the overall structure of the Saccharomyces cerevisiae CIII2/CIV supercomplex and its position in the mitochondrial inner membrane (IM). IMS: intermembrane space.
- B, C
Zoom‐in of the CIII2/CIV interaction sites with residues and distances annotated. The inner membrane protein–lipid–protein interactions (Rip1‐CL-Cox5a), where Rip1 is marked in gold, cardiolipin (CL) in gray, and Cox5a in red (B), and the mitochondrial matrix, protein–protein interaction of Cor1 (blue), and Cox5a (red) (C) are shown.
- D
Blue‐native gel electrophoresis of S. cerevisiae strains with indicated mutations in Cor1.
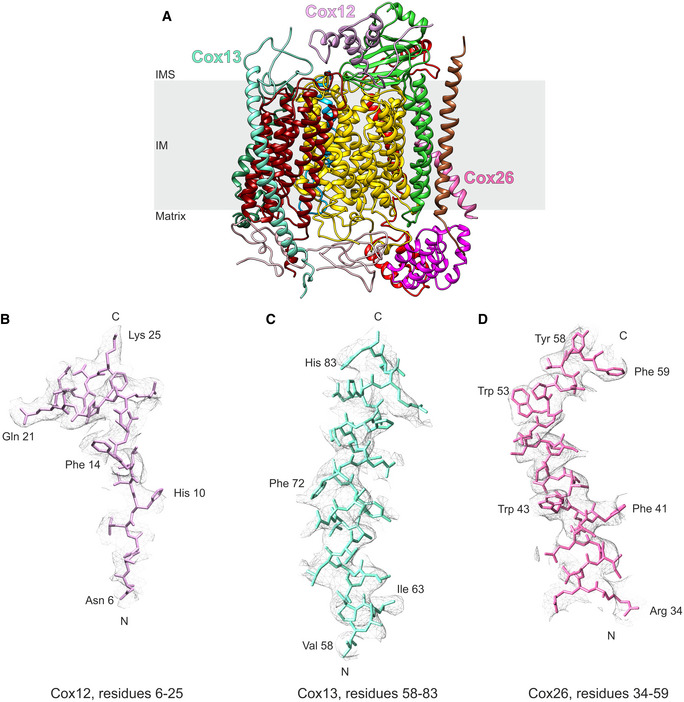
- A
Ribbon diagram of CIV with Cox12, Cox13, and Cox26 annotated. IM: inner membrane; IMS: intermembrane space.
- B–D
Example densities of Cox12 (B), Cox13 (C), and Cox26 (D) demonstrating parts of the subunits that improved due to the re‐processing of the data set.
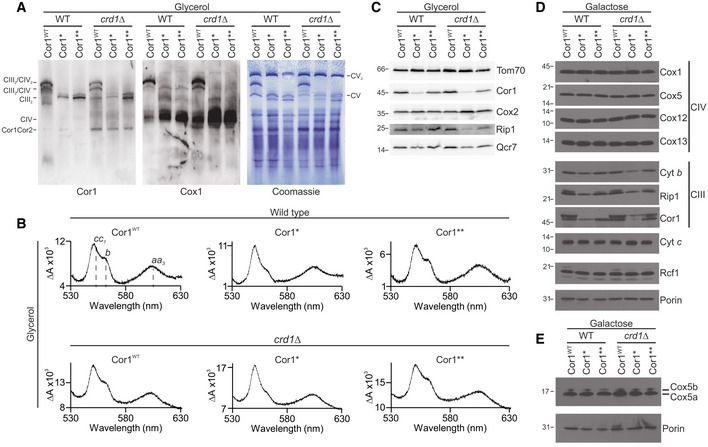
- A
Blue‐native gel electrophoresis and immunoblots of cells expressing the wild‐type form of Cor1 (Cor1WT), as well as the mutants Cor1N63A, N187A, D192A (Cor1*) and Cor1N63A, N187A, D192A, V189A, Y65A, L238A, K240A (Cor1**) in wild‐type (WT) background as well as in cells lacking CRD1 (crd1Δ). Blots were probed with antibodies against Cor1 to visualize Complex III (CIII), as well as Cox1, to monitor Complex IV (CIV). CV: Complex V; Cor1Cor2: multimer consisting of Cor1 and Cor2.
- B
Reduced‐minus‐oxidized difference spectra of strains described in (A). Heme peaks are indicated for Cor1WT in WT background.
- C–E
Steady‐state protein levels of strains as described in (A) cultivated on YP media containing glycerol (C) or CM media with galactose as carbon source (D, E).
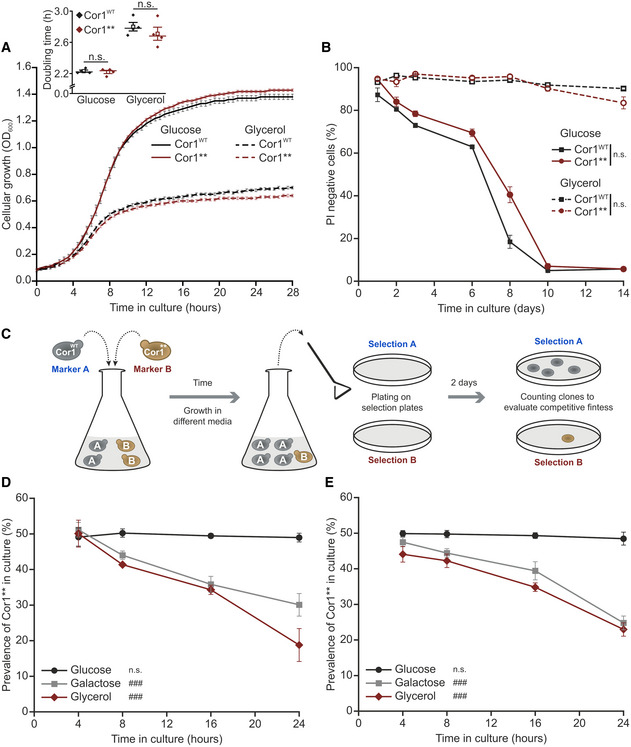
- A
Growth analysis of strains expressing the wild‐type form of Cor1 (Cor1WT) or the mutant Cor1N63A, N187A, D192A, V189A, Y65A, L238A, K240A (Cor1**). Growth curves and calculated doubling times from the exponential phase (insert) are presented. Cells were cultivated in media containing either glucose or glycerol as carbon source.
- B
Determination of chronological lifespan via propidium iodide (PI) staining of cells described above.
- C
Scheme of the experimental setup to evaluate competitive fitness.
- D, E
Analysis of competitive fitness as described in (C). Cor1WT strains harbored a chromosomally integrated hygromycin selection cassette, whereas Cor1** contained a clonNAT selection cassette (D). Subsequently, selection markers were switched as a control (E).
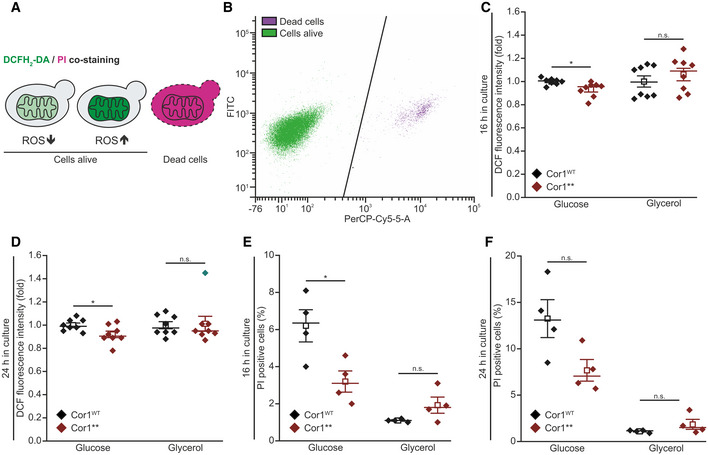
- A, B
Scheme of 2′,7′‐dichlorodihydrofluorescein diacetate (DCFH2‐DA), and propidium iodide (PI) staining and gating strategy for flow cytometry. PI is taken up by cells upon loss of membrane integrity, thus indicating dead cells. Non‐fluorescent DCFH2‐DA is oxidized to fluorescent 2′,7′‐dichlorofluorescein (DCF) upon oxidative stress (A). Hence, the DCF mean fluorescence intensity of PI‐negative cells was applied as a measure for oxidative stress. The threshold used to separate PI‐negative and PI‐positive cells is shown as black line in (B).
- C, D
Flow cytometric quantification of oxidative stress indicated via DCFH2‐DA/PI counterstaining of cells expressing the wild‐type form of Cor1 (Cor1WT), as well as the mutant Cor1N63A, N187A, D192A, V189A, Y65A, L238A, K240A (Cor1**). Cells were analyzed 16 h (C) and 24 h (D) after inoculation in media either containing glucose or galactose as indicated. To visualize fold values, normalization was performed to Cor1WT cells of the respective medium used.
- E, F
Analysis of cell death via flow cytometric quantification of PI stained cells as described above. Experiments were performed 16 h (E) and 24 h (F) after inoculation, and the percentages of PI‐positive cells are presented.
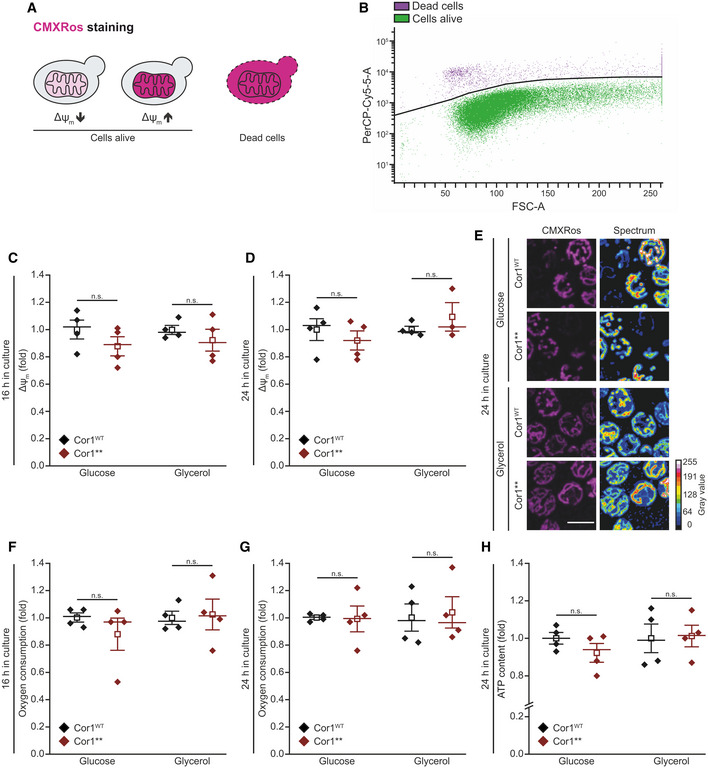
- A, B
Scheme of Mitotracker CMXRos staining and gating strategy for flow cytometric analysis. The fluorescence probe is taken up by mitochondria depending on the transmembrane potential (Δψm,). Dead cells accumulate the dye due to a lack of membrane integrity (A) and are excluded from the analysis. The threshold used to separate dead and living cells is shown as black line in (B). The mean fluorescence intensity of cells alive is quantified as a readout for Δψm.
- C–E
Analysis of Δψm via Mitotracker CMXRos staining of cells expressing the wild‐type form of Cor1 (Cor1WT), as well as the mutant Cor1N63A, N187A, D192A, V189A, Y65A, L238A, K240A (Cor1**). Cells were cultivated in CM media containing indicated carbon sources. Flow cytometric quantification 16 h (C) and 24 h (D) after inoculation are shown, as well as representative confocal micrographs (Z‐projections) after 24 h (E). Normalization in (C) and (D) was performed to Cor1WT cells of the respective medium used.
- F, G
Oxygen consumption quantified in intact cells. Strains described in (C) were analyzed 16 h (F) and 24 h (G) after inoculation. Normalization of data was performed as stated in (C) to present fold values.
- H
Cellular ATP content measured from cells described in (C). The measurement was performed with cells cultivated for 24 h in CM media containing the indicated carbon sources. Normalization was performed as stated in (C).
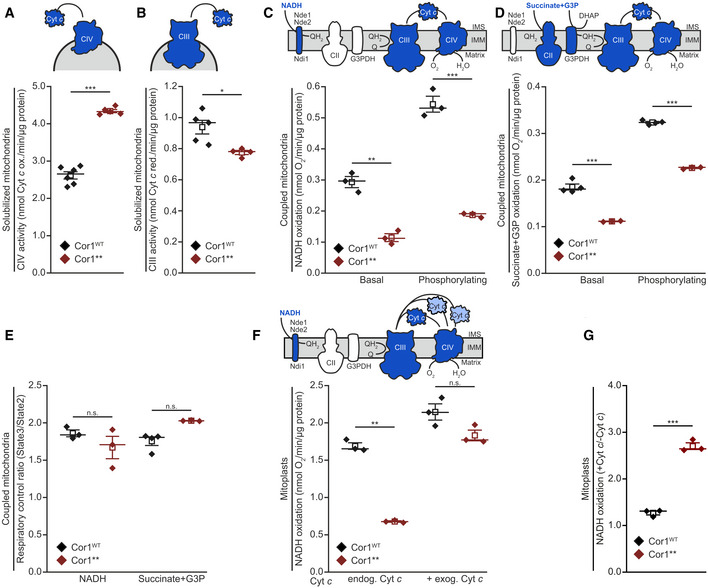
- A, B
Spectrophotometric measurement of Cyt c oxidase (CIV; A) and NADH Cyt c reductase (CIII; B) activities in solubilized mitochondrial extracts. Mitochondria were isolated from cells expressing the wild‐type form of Cor1 (Cor1WT) or the mutant Cor1N63A, N187A, D192A, V189A, Y65A, L238A, K240A (Cor1**).
- C, D
Polarographic measurement of KCN‐sensitive oxygen consumption, driven by NADH (C) or succinate + glycerol‐3-phosphate (G3P; D) in isolated coupled mitochondria of indicated strains. Measurements were performed in the absence (basal respiration) or presence (phosphorylating condition) of ADP.
- E
Respiratory control ratio calculated from polarographic measurements of KCN‐sensitive oxygen consumption driven by NADH and succinate + glycerol‐3-phosphate (G3P) in isolated coupled mitochondria of indicated strains.
- F, G
Polarographic measurement of KCN‐sensitive oxygen consumption driven by NADH in mitoplasts in the absence (endog. Cyt c) or presence (+ exog. Cyt c) of exogenous oxidized Cyt c. NADH oxidation (E) and the calculated ratio +Cyt c/−Cyt c of substrate oxidation (F) are visualized.
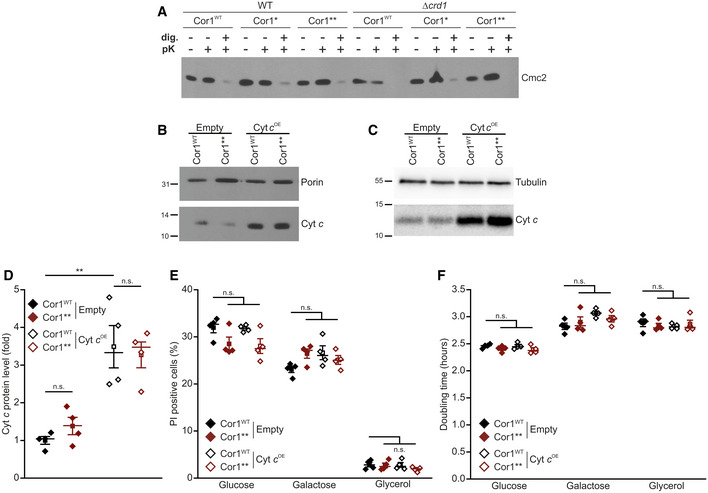
Assays to verify the intactness of the outer mitochondrial membrane. Mitochondria were isolated from strains expressing the wild‐type form of Cor1 (Cor1WT), as well as the mutants Cor1N63A, N187A, D192A (Cor1*) and Cor1N63A, N187A, D192A, V189A, Y65A, L238A, K240A (Cor1**) in wild‐type (WT) background as well as in cells lacking CRD1 (crd1Δ). Intactness of the outer mitochondrial membrane was tested by following the stability of the intermembrane protein Cmc2 1 h after treatment with 6 μg/ml proteinase K (pK). Negative control samples were created by membrane permeabilization with 0.5% digitonin (dig.).
Immunoblot analysis of isolated mitochondria from strains expressing the wild‐type form of Cor1 (Cor1WT) or the mutant Cor1N63A, N187A, D192A, V189A, Y65A, L238A, K240A (Cor1**). Cells either overexpressed cytochrome c (Cyt c OE) or contained the empty plasmid (Empty) as a control. Blots were probed with antibodies against Cyt c, as well as porin as loading control.
Immunoblot analysis as described in (B) from intact cells. Blots were probed with antibodies against Cyt c, as well as tubulin as loading control.
Densitometric quantification of immunoblots validating overexpression of cytochrome c (Cyt c OE) in strains expressing either the wild‐type form of Cor1 (Cor1WT) or the mutant Cor1N63A, N187A, D192A, V189A, Y65A, L238A, K240A (Cor1**). The Cyt c signal was normalized to tubulin intensities as a loading control, followed by normalization to Cor1WT strains harboring the empty vector to present fold values.
Flow cytometric quantification of loss of membrane integrity as visualized via propidium iodide (PI) staining of cells described in (D). Cells were cultivated in CM media either containing glucose, galactose or glycerol as carbon source.
Doubling time of strains described in (E).
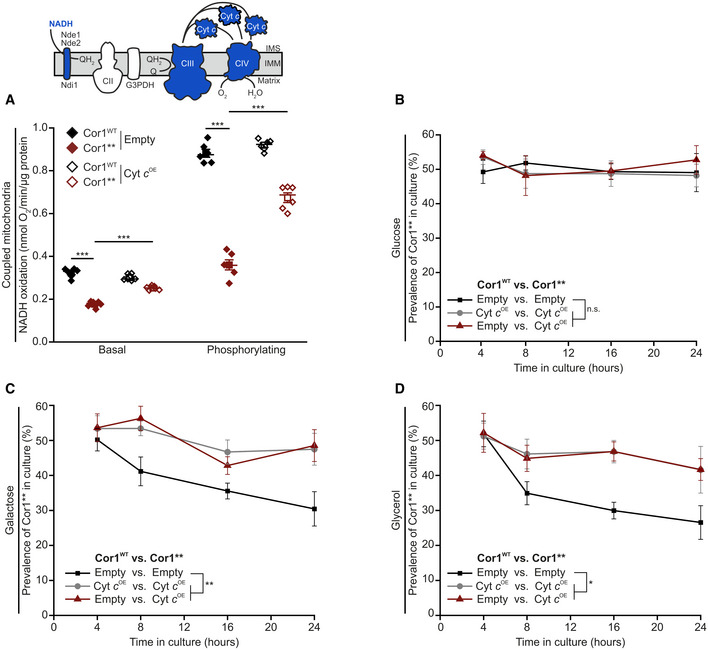
- A
Polarographic measurement of KCN‐sensitive oxygen consumption, driven by NADH in isolated coupled mitochondria. Mitochondria were isolated from cells expressing the wild‐type form of Cor1 (Cor1WT) or the mutant Cor1N63A, N187A, D192A, V189A, Y65A, L238A, K240A (Cor1**). Thereby, strains either overexpressed cytochrome c (Cyt c OE) or harbored the empty plasmid as a control (Empty). Measurements were performed in the absence (basal respiration) or presence (phosphorylating condition) of ADP.
- B–D
Analysis of competitive fitness of strains described in (A). Cor1WT strains harbored a chromosomally integrated clonNAT selection cassette, whereas Cor1** contained a hygromycin selection cassette. Strains were cultivated in CM media containing glucose (B), galactose (C), or glycerol (D) as carbon source.
Comment in
-
Supercomplex formation boosts respiration.EMBO Rep. 2020 Dec 3;21(12):e51830. doi: 10.15252/embr.202051830. Epub 2020 Dec 3. EMBO Rep. 2020. PMID: 33270972 Free PMC article.
References
-
- Acin‐Perez R, Enriquez JA (2014) The function of the respiratory supercomplexes: the plasticity model. Biochim Biophys Acta 1834: 444–450 - PubMed
-
- Acín‐Pérez R, Fernández‐Silva P, Peleato ML, Pérez‐Martos A, Enriquez JA (2008) Respiratory active mitochondrial supercomplexes. Mol Cell, 32: 529–539 - PubMed
-
- Balsa E, Marco R, Perales‐Clemente E, Szklarczyk R, Calvo E, Landázuri MO, Enríquez JA (2012) NDUFA4 is a subunit of complex IV of the mammalian electron transport chain. Cell Metab 16: 378–386 - PubMed
Publication types
MeSH terms
Substances
Associated data
- Actions
- Actions
Grants and funding
LinkOut - more resources
Full Text Sources
Molecular Biology Databases
