

Inhibition of fatty acid amide hydrolase prevents pathology in neurovisceral acid sphingomyelinase deficiency by rescuing defective endocannabinoid signaling
- PMID: 33016621
- PMCID: PMC7645369
- DOI: 10.15252/emmm.201911776
Inhibition of fatty acid amide hydrolase prevents pathology in neurovisceral acid sphingomyelinase deficiency by rescuing defective endocannabinoid signaling
Abstract
Acid sphingomyelinase deficiency (ASMD) leads to cellular accumulation of sphingomyelin (SM), neurodegeneration, and early death. Here, we describe the downregulation of the endocannabinoid (eCB) system in neurons of ASM knockout (ASM-KO) mice and a ASMD patient. High SM reduced expression of the eCB receptor CB1 in neuronal processes and induced its accumulation in lysosomes. Activation of CB1 receptor signaling, through inhibition of the eCB-degrading enzyme fatty acid amide hydrolase (FAAH), reduced SM levels in ASM-KO neurons. Oral treatment of ASM-KO mice with a FAAH inhibitor prevented SM buildup; alleviated inflammation, neurodegeneration, and behavioral alterations; and extended lifespan. This treatment showed benefits even after a single administration at advanced disease stages. We also found CB1 receptor downregulation in neurons of a mouse model and a patient of another sphingolipid storage disorder, Niemann-Pick disease type C (NPC). We showed the efficacy of FAAH inhibition to reduce SM and cholesterol levels in NPC patient-derived cells and in the brain of a NPC mouse model. Our findings reveal a pathophysiological crosstalk between neuronal SM and the eCB system and offer a new treatment for ASMD and other sphingolipidoses.
Keywords: Niemann-Pick; endocannabinoids; neurodegeneration; sphingomyelin.
© 2020 The Authors. Published under the terms of the CC BY 4.0 license.
Conflict of interest statement
MDL, AB, and EHS are co‐inventors on a patent describing the use of FAAHi for the treatment of lysosomal storage diseases.
Figures
- A
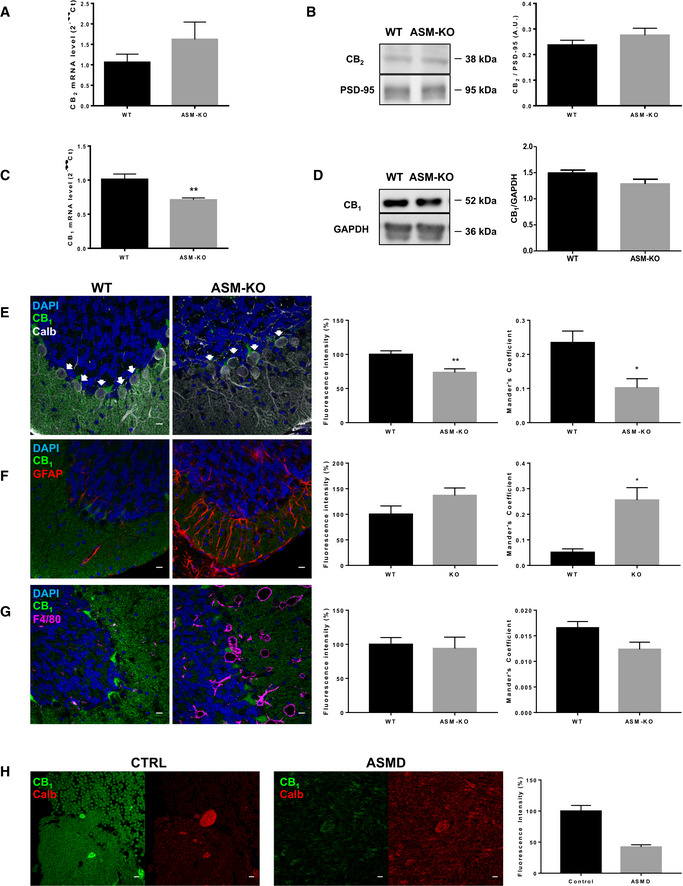
Mean ± SEM CB2 mRNA levels in cerebellar extracts of WT and ASM‐KO mice (n = 5 mice per group).
- B
Western blot against CB2 and PSD‐95 (used as loading control) and graph showing mean ± SEM CB2 protein levels in cerebellar extracts of WT and ASM‐KO mice (n = 6 mice per group).
- C
Mean ± SEM CB1 mRNA levels in cerebellar extracts of WT and ASM‐KO mice (**P = 0.0013, n = 6 mice per group, Student's t‐test).
- D
Western blot against CB1 and GAPDH (used as loading control) and graph showing mean ± SEM CB1 protein levels in cerebellar extracts of WT and ASM‐KO mice (n = 3 mice per group).
- E–G
Immunofluorescence images against CB1 and the following cellular markers: calbindin for Purkinje cells (E), GFAP for astrocytes (F), and F4/80 for microglia (G) in the cerebellum of WT and ASM‐KO mice. DAPI stains cell nuclei. Graphs to the left show mean ± SEM intensity associated with CB1 in the Purkinje cells (shown by white arrows, E), astrocytes (F), and microglia (G) expressed as percentage of the values obtained in WT mice. Graphs to the right show the Mander's coefficient that indicates degree of co‐localization between CB1 and the cellular markers for Purkinje cells (E), astrocytes (F), and microglia (G) (E: **P Fluorecence intensity = 0.0082, *P Mander's Coefficient = 0.0158; F: *P Mander's Coefficient = 0.0115; n = 5 mice per group, Student's t‐test). Scale bar, 100 μm.
- H
Immunofluorescence images against CB1 and the Purkinje cell marker calbindin in the cerebellum of age‐matched control and ASMD‐affected children. Graph shows mean ± SEM intensity associated with CB1 in the Purkinje cells expressed as percentage of the values obtained in the control child (16 and 15 replicates in control and ASMD, respectively). Scale bar, 10 μm.
- A
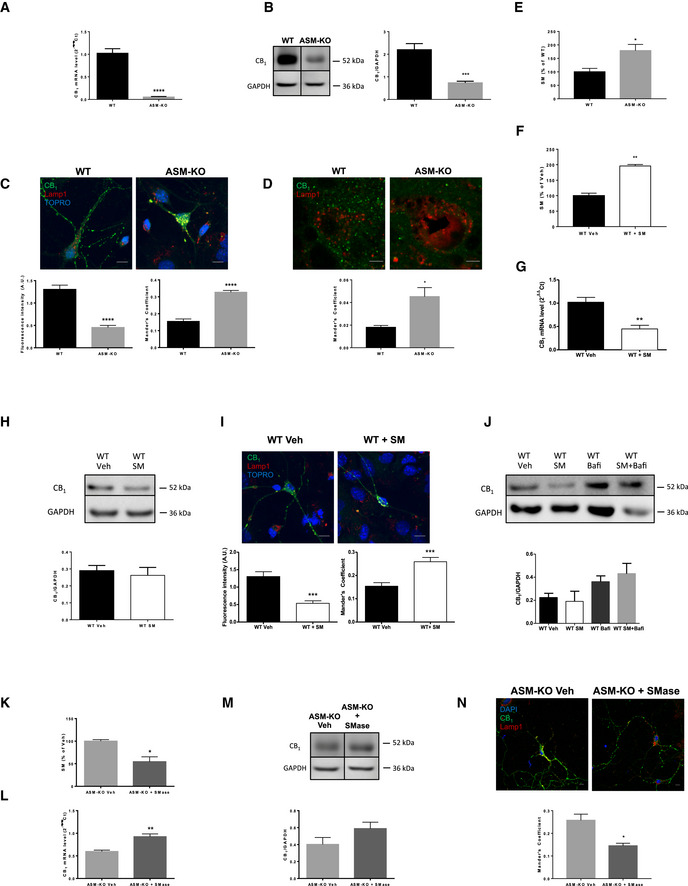
Mean ± SEM CB1 mRNA levels in cultured hippocampal neurons from WT and ASM‐KO mice (****P < 0.0001, n = 5 independent cultures, Student's t‐test).
- B
Western blot against CB1 and GAPDH (used as loading control). Images belong to the same blot but to non‐consecutive lanes as indicated by the boxes. Graph showing mean ± SEM CB1 protein levels in cultured neurons from WT and ASM‐KO mice (***P = 0.0009, n = 5 independent cultures, Student's t‐test).
- C
Immunofluorescence images against CB1 and the lysosomal marker Lamp1 in cultured neurons from WT and ASM‐KO mice. TOPRO stains cell nuclei. Graphs show mean ± SEM intensity associated with CB1 in the neuronal processes expressed in arbitrary units (left) or the Mander's coefficient for the co‐localization of CB1 with Lamp1 (right; ****P < 0.0001, n = 3 independent cultures, > 30 neurons per culture, Student's t‐test). Scale bar, 10 μm.
- D
Immunofluorescence images against CB1 and the lysosomal marker Lamp1 in Purkinje cells of the cerebellum from WT and ASM‐KO mice. Graph shows mean ± SEM Mander's coefficient indicative of the degree of co‐localization of CB1 and Lamp1 (*P = 0.0213, n = 4 mice per group, Student's t‐test). Scale bar, 5 μm.
- E, F
Graphs show mean ± SEM SM levels, expressed as percentage of WT values, in extracts containing the same amount of protein of cultured neurons from WT and ASM‐KO mice (E) or from WT mice incubated or not with 40μΜ SM (F). (E: *P = 0.0405; F: **P = 0.0100, n = 2 independent cultures, Student's t‐test).
- G
Mean ± SEM CB1 mRNA levels in cultured neurons from WT mice incubated or not with 40 μM SM (**P = 0.0021, n = 5 independent cultures, Student's t‐test).
- H
Western blot against CB1 and GAPDH (used as loading control) and graph showing mean ± SEM CB1 protein levels in cultured neurons from WT mice incubated or not with 40 μΜ SM (n = 2 independent cultures, Student's t‐test)
- I
Immunofluorescence images against CB1 and Lamp1 in cultured neurons from WT mice incubated or not with 40 μΜ SM. Graphs show mean ± SEM intensity associated with CB1 in the neuronal processes expressed in arbitrary units (left) or the Mander's coefficient for the co‐localization of CB1 with Lamp1 (right; ***P < 0.0001, n = 3 independent cultures, > 30 neurons per culture, Student's t‐test). Scale bar, 10 μm.
- J
Western blot against CB1 and GAPDH (used as loading control) and graph showing mean ± SEM CB1 protein levels in cultured neurons from WT mice treated with vehicle (veh), with 40 μM SM (SM), with 0.1 μM bafilomycin (BafA1), or with 40 μM SM and 0.1 μM bafilomycin (SM + BafA1). Graph shows mean ± SEM CB1 levels normalized to GAPDH in arbitrary units (n = 2 independent cultures, one‐way ANOVA).
- K
Mean ± SEM SM levels in cultured neurons from ASM‐KO mice incubated or not with exogenous SMase (*P = 0.0157, n = 3 independent cultures, Student's t‐test).
- L
Mean ± SEM CB1 mRNA levels in cultured neurons from ASM‐KO mice incubated or not with exogenous SMase (**P = 0.0015, n = 5 independent cultures, Student's t‐test).
- M
Western blot against CB1 and GAPDH (used as loading control). Images belong to the same blot but to non‐consecutive lanes as indicated by the boxes. Graph showing mean ± SEM CB1 protein levels normalized to GAPDH in extracts from cultured neurons from ASM‐KO mice incubated or not with exogenous SMase (n = 5 independent cultures, Student's t‐test).
- N
Immunofluorescence images against CB1 and the lysosomal marker Lamp1 in cultured neurons from ASM‐KO mice incubated or not with exogenous SMase. DAPI stains cell nuclei. Graph shows mean ± SEM Mander's coefficient for the co‐localization of CB1 with Lamp1 (*P = 0.0189, n = 3 independent cultures, > 30 neurons per culture, Student's t‐test). Scale bar, 10 μm.
- A
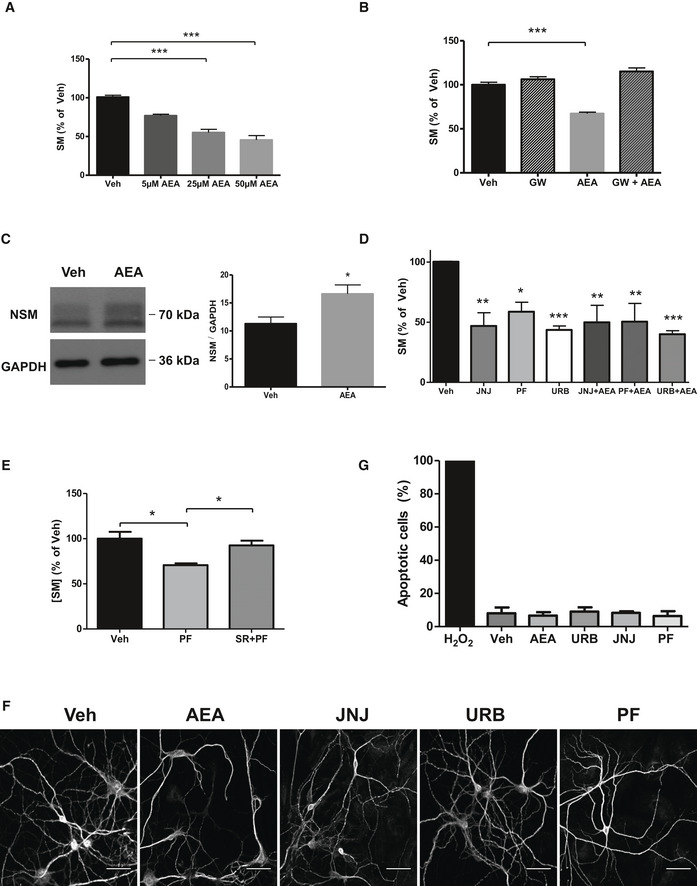
Mean ± SEM SM levels, expressed as percentage of vehicle values, in cultured neurons from ASM‐KO mice treated with vehicle or with the indicated concentrations of AEA (***P < 0.0001, n = 3 independent cultures, one‐way ANOVA, Bonferroni post hoc).
- B
Mean ± SEM SM levels, expressed as percentage of vehicle values, in cultured neurons from ASM‐KO mice treated with vehicle, the inhibitor of NSM GW, AEA, or the combination of GW and AEA (***P < 0.0001, n = 3 independent cultures, one‐way ANOVA, Bonferroni post hoc).
- C
Western blot against NSM and GAPDH (used as loading control) and graph showing mean ± SEM NSM protein levels in extracts from cultured neurons treated with vehicle or with 50 μM AEA (*P = 0.0230, n = 6 independent cultures, Student's t‐test).
- D
Mean ± SEM SM levels, expressed as percentage of vehicle values, in cultured neurons from ASM‐KO mice treated with vehicle, or with JNJ, PF, or URB in the presence or absence of AEA (**P JNJ = 0.0013, *P PF = 0.0143, ***P URB = 0.0002, **P JNJ + AEA = 0.0069, **P PF + AEA = 0.0077, ***P URB + AEA < 0.0001, n = 3 independent cultures, one‐way ANOVA, Bonferroni post hoc).
- E
Mean ± SEM SM levels, expressed as percentage of vehicle values, in cultured neurons from ASM‐KO mice treated with vehicle, with PF, or with SR141716 + PF (*P PF = 0.0109, *P SR + PF = 0.0343, n = 3 independent cultures, one‐way ANOVA, Bonferroni post hoc).
- F
Immunofluorescences against the dendritic marker MAP2 of cultured neurons from ASM‐KO mice treated with vehicle, AEA, JNJ, PF, or URB. Scale bar, 50 μm.
- G
Mean ± SEM number of apoptotic cells measured by TUNEL assays in cultured neurons from ASM‐KO mice treated with H2O2 (as positive control), vehicle, AEA, JNJ, PF, or URB (n = 3 independent cultures).
- A
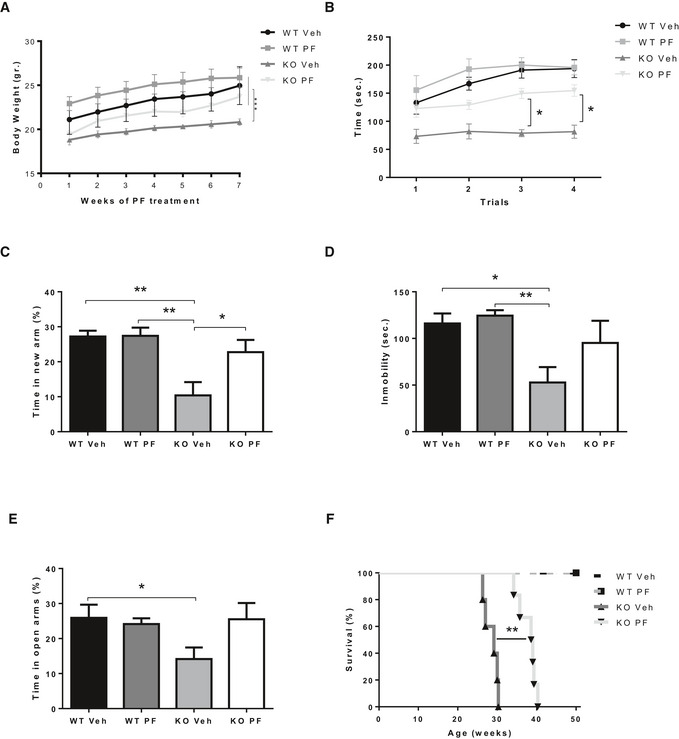
Weekly mean ± SEM body weight of WT and ASM‐KO mice treated or not with PF (***P < 0.0001, n = 7 mice per group, statistics reflect the significant difference between the slope of the data in the PF‐treated ASM‐KO with respect to the other three groups, linear regression test).
- B
Mean ± SEM time spent on the rod in the 4 trials of the rotarod test by WT and ASM‐KO mice after 2 months of vehicle or PF treatment (*P T3 = 0.0488, *P T4 = 0.361, n = 4 mice per group, two‐way ANOVA, Bonferroni post hoc).
- C
Mean ± SEM time spent in the new arm of the Y‐maze test by WT and ASM‐KO mice after 2 months of vehicle or PF treatment (**P WTVeh Vs KO Veh = 0.0024, **P WT PF Vs KO Veh = 0.0016, *P KO PF Vs KO Veh = 0.0391, n = 9 mice per group, two‐way ANOVA, Bonferroni post hoc).
- D
Mean ± SEM time of immobility in the tail suspension test of WT and ASM‐KO mice after 2 months of vehicle or PF treatment (*P WTVeh Vs KO Veh = 0.0198, **P WT PF Vs KO Veh = 0.0067, n = 6 mice per group, two‐way ANOVA, Bonferroni post hoc).
- E
Mean ± SEM time spent in the open arms of the elevated plus maze by WT and ASM‐KO mice after 2 months of vehicle or PF treatment (*P WTVeh Vs KO Veh = 0.0342, n = 7 mice per group, two‐way ANOVA, Bonferroni post hoc).
- F
Percentage of survival with respect to weeks of age in WT and ASM‐KO mice treated with vehicle or PF (**P = 0.0031, n = 5 mice in WT vehicle, WT PF‐treated and KO vehicle, 6 mice in KO PF‐treated, Mantel–Cox)
- A
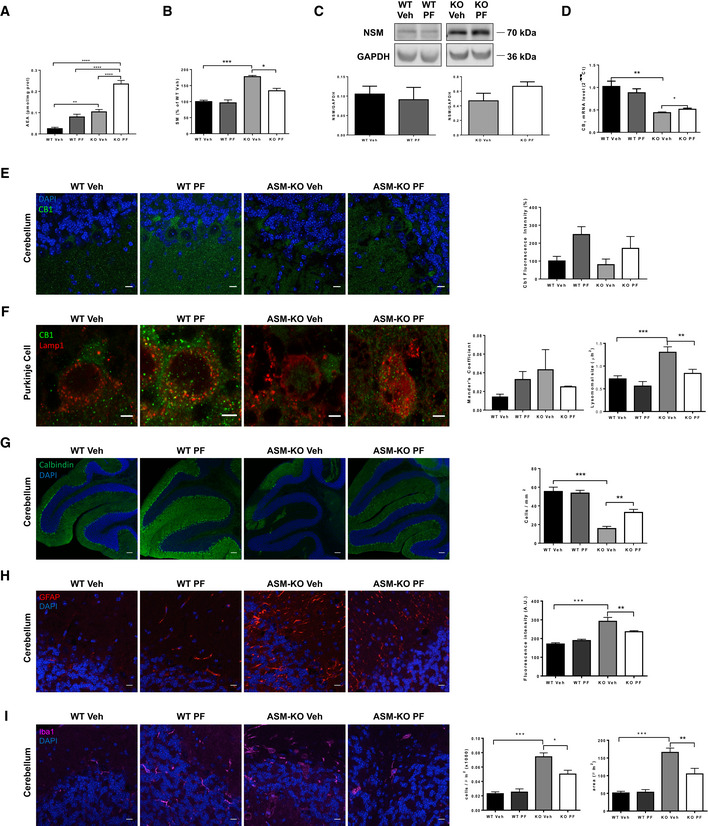
Mean ± SEM AEA levels in cerebellar extracts from WT and ASM‐KO mice after 2 months of vehicle or PF treatment (**P WT Veh vs KO Veh = 0.0063; ****P WT Veh vs KO PF < 0.0001; ****P WT PF vs KO PF < 0.0001; ****P KO Veh vs KO PF < 0.0001, n = 4 mice per group, one‐way ANOVA, Bonferroni post hoc).
- B
Mean ± SEM SM levels, expressed as percentage of vehicle values, in cerebellar extracts from WT and ASM‐KO mice after 2 months of vehicle or PF treatment (***P WTVeh Vs KO Veh < 0.0001, *P KO Veh Vs KO PF = 0.0465), n = 4 mice per group, one‐way ANOVA, Bonferroni post hoc).
- C
Western blot against NSM and GAPDH (used as loading control) and graph showing mean ± SEM NSM protein levels in cerebellar extracts from WT and ASM‐KO mice after 2 months of vehicle or PF treatment (n = 3 mice per group, one‐way ANOVA, Bonferroni post hoc).
- D
Mean ± SEM CB1 mRNA levels in cerebellar extracts from WT and ASM‐KO mice after 2 months of vehicle or PF treatment (**P WTVeh Vs KO Veh = 0.0026, *P KO Veh Vs KO PF = 0.0345), n = 4 mice per group, one‐way ANOVA, Bonferroni post hoc).
- E
Immunofluorescence against CB1 in Purkinje cells of the cerebellum of WT and ASM‐KO mice after 2 months of vehicle or PF treatment. Graph shows mean ± SEM intensity associated with CB1, expressed as percentage of values in vehicle‐treated mice (n = 4 mice per group, > 20 Purkinje cells per mouse, one‐way ANOVA, Bonferroni post hoc). Scale bar, 10 μm.
- F
Immunofluorescence against CB1 and Lamp1 in the Purkinje cell layer of the cerebellum of WT and ASM‐KO mice after 2 months of vehicle or PF treatment. Graphs show Mander's coefficient for the co‐localization of CB1 with Lamp1 (left) and mean ± SEM lysosomal size (right; ***P WT Veh vs KO Veh = 0.0002; **P KO Veh vs KO PF = 0.0052, n = 4 mice per group, > 20 lysosomes per mouse, one‐way ANOVA, Bonferroni post hoc). Scale bar, 5 μm.
- G
Immunofluorescence against the Purkinje cell marker calbindin in the cerebellum of WT and ASM‐KO mice after 2 months of vehicle or PF treatment. Graph shows mean ± SEM number of calbindin‐positive cells per area (***P WTVeh Vs KO Veh < 0.0001, **P KO PF Vs KO Veh = 0.00642), n = 4 mice per group, one‐way ANOVA, Bonferroni post hoc). Scale bar, 100 μm.
- H
Immunofluorescence against the astrocytic marker GFAP in the cerebellum of WT and ASM‐KO mice after 2 months of vehicle or PF treatment. Graph shows mean ± SEM intensity associated with GFAP in arbitrary units (***P WTVeh Vs KO Veh < 0.0001, **P KO PF Vs KO Veh = 0.0083), n = 4 mice per group, one‐way ANOVA, Bonferroni post hoc). Scale bar, 10 μm.
- I
Immunofluorescence against the microglia marker Iba1 in the cerebellum of WT and ASM‐KO mice after 2 months of vehicle or PF treatment. Graph shows mean ± SEM number (left) and area (right) of Iba1‐positive cells (left: ***P WTVeh Vs KO Veh < 0.0001, **P KO PF Vs KO Veh = 0.0034; right: ***P WTVeh Vs KO Veh < 0.0001, P KO PF Vs KO Veh = 0.00123, n = 4 mice per group, > 20 cells analyzed per mouse, one‐way ANOVA, Bonferroni post hoc). Scale bar, 10 μm.
- A
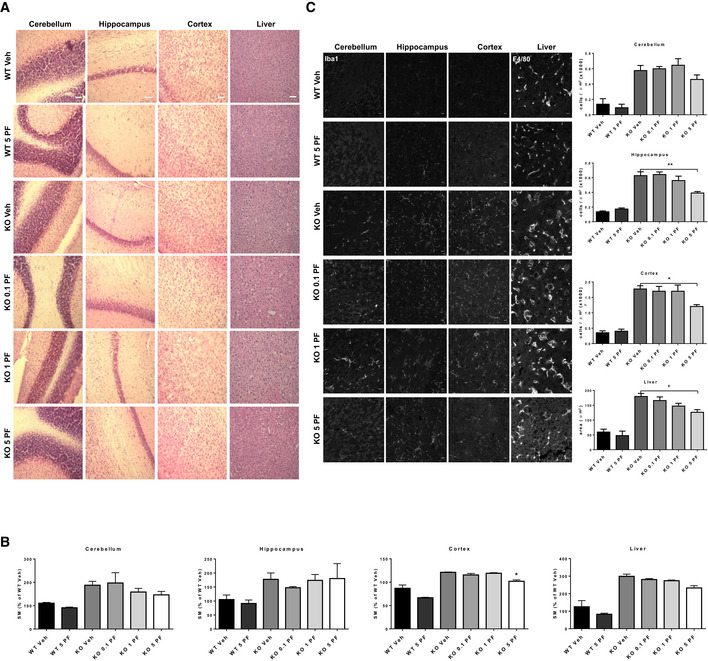
H&E staining of cerebellum, hippocampus, cortex, and liver from WT and ASM‐KO mice 48 h after one single administration of vehicle or the indicated doses of PF. Scale bar, 100 μm.
- B
Mean ± SEM SM levels, expressed as percentage of vehicle values, in cerebellar, hippocampal, cortical, and liver extracts from WT and ASM‐KO mice 48 h after one single administration of vehicle or the indicated doses of PF. (*P KOVeh Vs KO 5 = 0.0304, n = 3 mice per group, one‐way ANOVA, Bonferroni post hoc)
- C
Immunofluorescences against the microglia marker Iba1 in the cerebellum, hippocampus, and cortex or against the macrophage marker F4/80 in the liver from WT and ASM‐KO mice 48 h after one single administration of vehicle or the indicated doses of PF. Graphs show mean ± SEM number of microglia per area unit in cerebellum, hippocampus, and cortex or mean ± SEM area of macrophages in the liver (hippocampus: **P KOVeh Vs KO 5 = 0.0015; cortex: *P KOVeh Vs KO 5 = 0.0364; liver: *P KOVeh Vs KO 5 = 0.0152, n = 6 mice per group, > 20 cells analyzed per mouse, one‐way ANOVA, Bonferroni post hoc). Scale bar, 10 μm.
- A
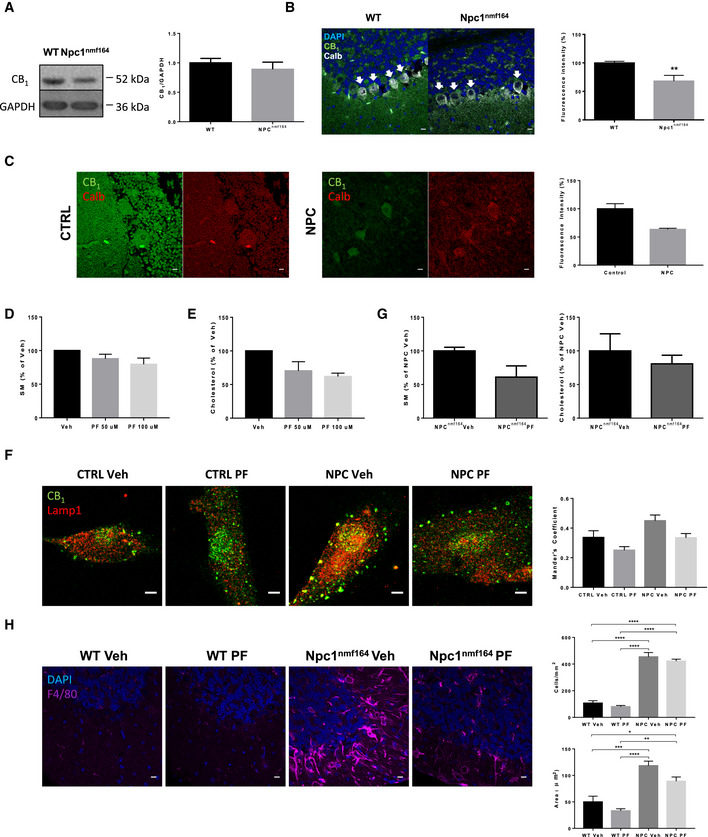
Western blot against CB1 and GAPDH (used as loading control) and graph showing mean ± SEM CB1 protein levels in cerebellar extracts from WT and Npc1nmf164 mice (n = 6).
- B
Immunofluorescence images against CB1 and calbindin in the cerebellum of WT and Npc1nmf164 mice. DAPI stains cell nuclei. Graphs show mean ± SEM intensity associated with CB1 in the Purkinje cells (indicated by arrows) expressed in arbitrary units (**P = 0.0085, n = 5 mice per group, Student's t‐test). Scale bar, 10 μm.
- C
Immunofluorescence images against CB1 in Purkinje cells of the cerebellum of age‐matched control and NPC‐affected children. Graph shows mean ± SEM intensity associated with CB1 in the Purkinje cells expressed as percentage of the control values (16 and 57 cells in control and NPC, respectively). Scale bar, 10 μm.
- D
Graph shows mean ± SEM SM levels, expressed as percentage of vehicle values, in cultured fibroblasts from a NPC patient treated with vehicle or with PF at 50 or 100 μM (n = 2 different cultures)
- E
Graph shows mean ± SEM cholesterol levels, expressed as percentage of vehicle values, in cultured fibroblasts from a NPC patient treated with vehicle or with PF at 50 or 100 μM (n = 2 different cultures)
- F
Immunofluorescence images of CB1 and Lamp1 in cultured fibroblasts from control subject and NPC patient treated with vehicle or with PF at 100 μM. Graph shows mean ± SEM Mander's coefficient for the co‐localization of CB1 with Lamp1 (n = 2 different cultures). Scale bar, 5 μm.
- G
Graphs show mean ± SEM SM and cholesterol levels expressed as percentage of the values obtained in the vehicle‐treated mice in the cerebellum of Npc1nmf164 after 48 h of a single dose of 5 mg/kg PF (n = 3 mice)
- H
Immunofluorescence images against the microglia marker F4/80 in the cerebellum of WT and Npc1nmf164 after 48 h of a single dose of 5 mg/kg PF. Graphs show mean ± SEM number (upper) and area (lower) of F4/80-positive cells (upper graph: ****P < 0.0001; lower graph: ***P WT Veh vs NPC Veh = 0.0008; *P WT Veh vs NPC PF = 0.0286; ****P WT PF vs NPC Veh < 0.0001; **P WT PF vs NPC PF = 0.0022, n = 3 mice per group, > 20 cells analyzed per mouse, one‐way ANOVA, Bonferroni post hoc). Scale bar, 10 μm.
Similar articles
-
Modulation of Dietary Choline Uptake in a Mouse Model of Acid Sphingomyelinase Deficiency.Int J Mol Sci. 2023 Jun 5;24(11):9756. doi: 10.3390/ijms24119756. Int J Mol Sci. 2023. PMID: 37298714 Free PMC article.
-
Sphingomyelin 16:0 is a therapeutic target for neuronal death in acid sphingomyelinase deficiency.Cell Death Dis. 2023 Apr 6;14(4):248. doi: 10.1038/s41419-023-05784-2. Cell Death Dis. 2023. PMID: 37024473 Free PMC article.
-
Sphingomyelin-induced inhibition of the plasma membrane calcium ATPase causes neurodegeneration in type A Niemann-Pick disease.Mol Psychiatry. 2017 May;22(5):711-723. doi: 10.1038/mp.2016.148. Epub 2016 Sep 13. Mol Psychiatry. 2017. PMID: 27620840
-
Cause of death in patients with chronic visceral and chronic neurovisceral acid sphingomyelinase deficiency (Niemann-Pick disease type B and B variant): Literature review and report of new cases.Mol Genet Metab. 2016 Jul;118(3):206-213. doi: 10.1016/j.ymgme.2016.05.001. Epub 2016 May 11. Mol Genet Metab. 2016. PMID: 27198631 Review.
-
Brain pathology in Niemann Pick disease type A: insights from the acid sphingomyelinase knockout mice.J Neurochem. 2011 Mar;116(5):779-88. doi: 10.1111/j.1471-4159.2010.07034.x. Epub 2011 Jan 7. J Neurochem. 2011. PMID: 21214563 Free PMC article. Review.
Cited by
-
Quality of Life and a Surveillant Endocannabinoid System.Front Neurosci. 2021 Oct 28;15:747229. doi: 10.3389/fnins.2021.747229. eCollection 2021. Front Neurosci. 2021. PMID: 34776851 Free PMC article. Review.
-
The Multiple Roles of Sphingomyelin in Parkinson's Disease.Biomolecules. 2021 Sep 5;11(9):1311. doi: 10.3390/biom11091311. Biomolecules. 2021. PMID: 34572524 Free PMC article. Review.
-
New paradigms for the treatment of lysosomal storage diseases: targeting the endocannabinoid system as a therapeutic strategy.Orphanet J Rare Dis. 2021 Mar 25;16(1):151. doi: 10.1186/s13023-021-01779-4. Orphanet J Rare Dis. 2021. PMID: 33766102 Free PMC article. Review.
-
The impact of sphingomyelin on the pathophysiology and treatment response to olipudase alfa in acid sphingomyelinase deficiency.Genet Med Open. 2024 Aug 23;2:101888. doi: 10.1016/j.gimo.2024.101888. eCollection 2024. Genet Med Open. 2024. PMID: 39669638 Free PMC article. Review.
-
Modulation of Dietary Choline Uptake in a Mouse Model of Acid Sphingomyelinase Deficiency.Int J Mol Sci. 2023 Jun 5;24(11):9756. doi: 10.3390/ijms24119756. Int J Mol Sci. 2023. PMID: 37298714 Free PMC article.
References
-
- Ahn K, Smith SE, Liimatta MB, Beidler D, Sadagopan N, Dudley DT, Young T, Wren P, Zhang Y, Swaney S et al (2011) Mechanistic and pharmacological characterization of PF‐04457845: a highly potent and selective fatty acid amide hydrolase inhibitor that reduces inflammatory and noninflammatory pain. J Pharmacol Exp Ther 338: 114–124 - PMC - PubMed
-
- Aymerich MS, Aso E, Abellanas MA, Tolon RM, Ramos JA, Ferrer I, Romero J, Fernandez‐Ruiz J (2018) Cannabinoid pharmacology/therapeutics in chronic degenerative disorders affecting the central nervous system. Biochem Pharmacol 157: 67–84 - PubMed
-
- Bari M, Battista N, Fezza F, Finazzi‐Agro A, Maccarrone M (2005a) Lipid rafts control signaling of type‐1 cannabinoid receptors in neuronal cells. Implications for anandamide‐induced apoptosis. J Biol Chem 280: 12212–12220 - PubMed
Publication types
MeSH terms
Substances
Grants and funding
LinkOut - more resources
Full Text Sources
Molecular Biology Databases
Research Materials
