Case Reports
. 2021 Sep;17(9):2449-2464.
doi: 10.1080/15548627.2020.1831800. Epub 2020 Oct 20.

Essential role of autophagy in restricting poliovirus infection revealed by identification of an ATG7 defect in a poliomyelitis patient

Affiliations
Case Reports

Essential role of autophagy in restricting poliovirus infection revealed by identification of an ATG7 defect in a poliomyelitis patient

Nanna-Sophie Brinck Andersen et al. Autophagy. 2021 Sep.

Abstract

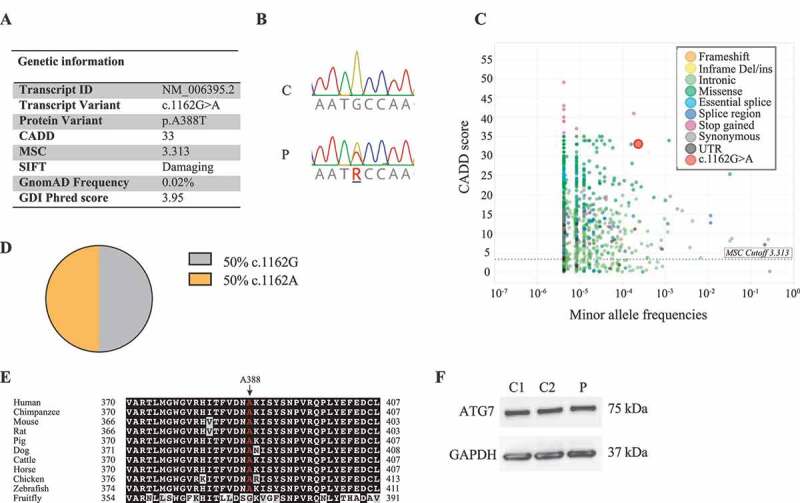
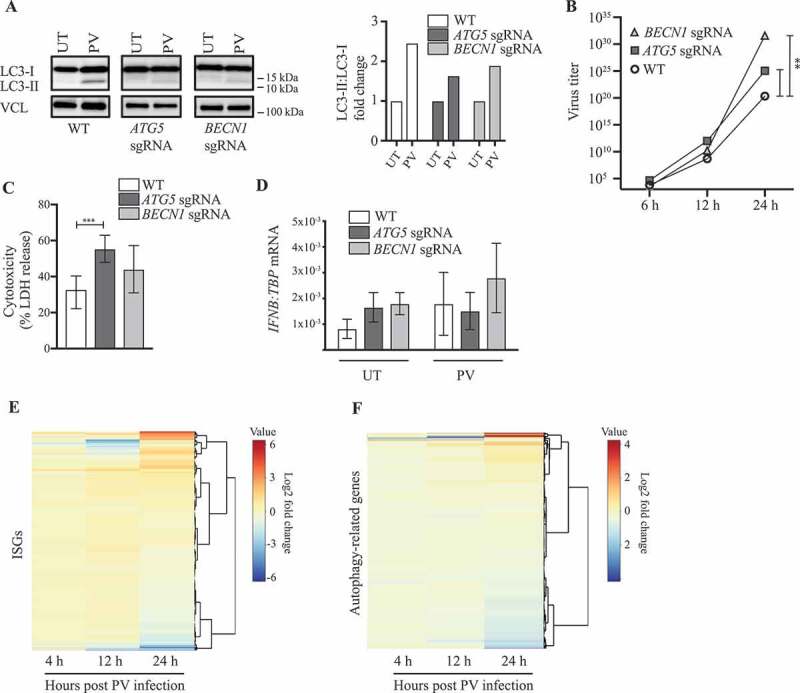
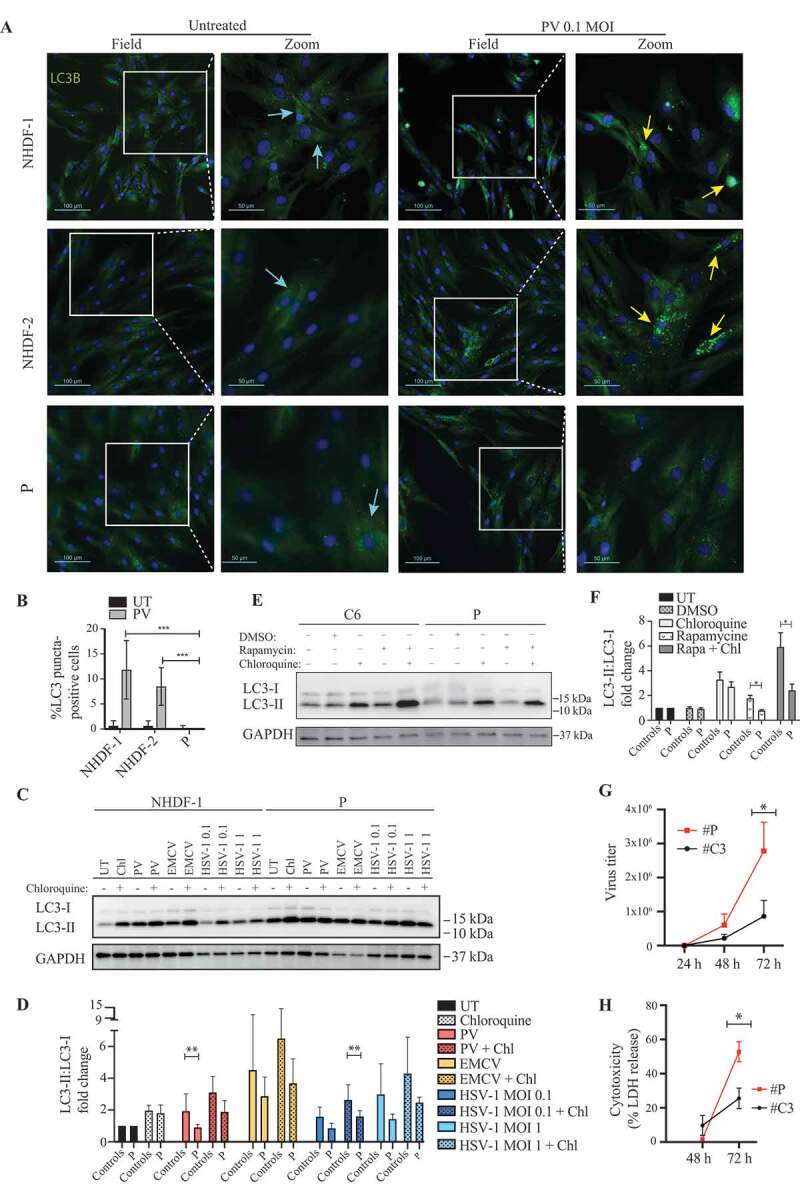
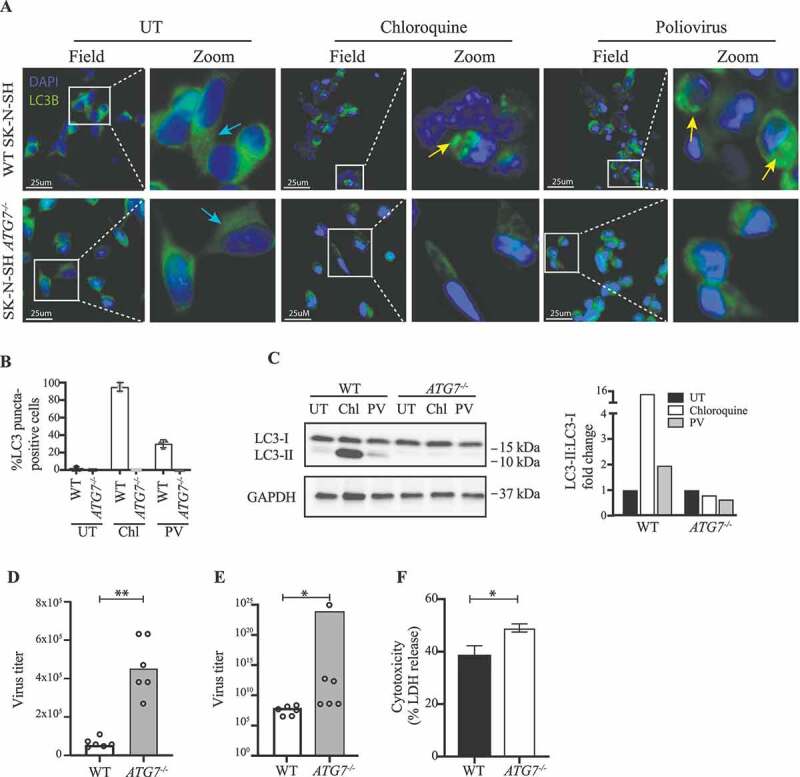
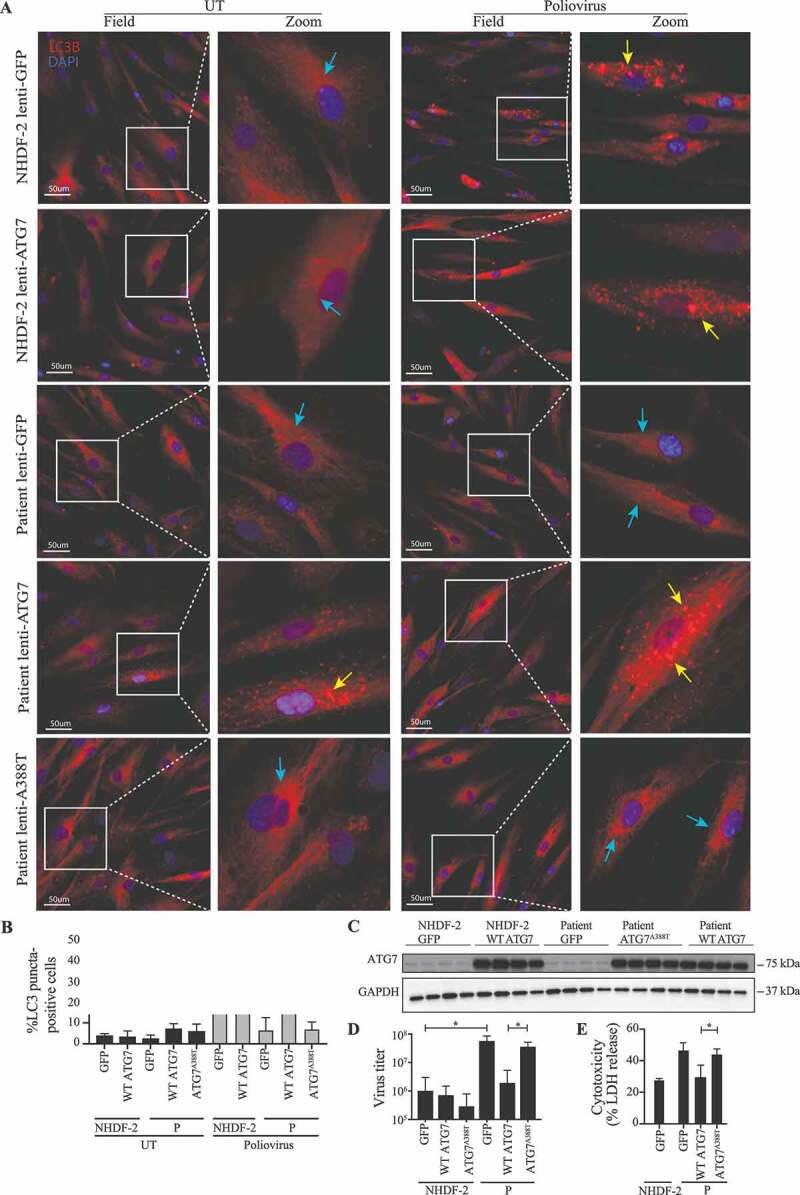
Paralytic poliomyelitis is a rare disease manifestation following poliovirus (PV) infection. The disease determinants remain largely unknown. We used whole exome sequencing to uncover possible contributions of host genetics to the development of disease outcome in humans with poliomyelitis. We identified a patient with a variant in ATG7, an important regulatory gene in the macroautophagy/autophagy pathway. PV infection did not induce a prominent type I interferon response, but rather activated autophagy in neuronal-like cells, and this was essential for viral control. Importantly, virus-induced autophagy was impaired in patient fibroblasts and associated with increased viral burden and enhanced cell death following infection. Lack of ATG7 prevented control of infection in neuronal-like cells, and reconstitution of patient cells with wild-type ATG7 reestablished autophagy-mediated control of infection. Collectively, these data suggest that ATG7 defect contributes to host susceptibility to PV infection and propose autophagy as an unappreciated antiviral effector in viral infection in humans.

Keywords: ATG7; autophagy; host genetics; innate immunity; neuronal-like cells; poliomyelitis; poliovirus; whole exome sequencing.


Conflict of interest statement

The authors declare that they have no competing interests.

Figures

Figure 1.
Figure 1.
ATG7A388T is a rare variant with high CADD score. (A) Table showing characteristics of the ATG7A388T variant identified in the patient. The gene damage index (GDI) for ATG7 is 3.96, which is well below the suggested cutoff of 12.4. (B) Sanger sequencing confirming the ATG7A388T variant in P compared to a healthy control (C). (C) Frequency and combined anotation dependent depletion (CADD) score for all variants reported in the Genome Aggregation Database (gnomAD). The dotted line corresponds to the mutation significance cutoff (MSC). The CADD score of 33 for the ATG7A388T variant is well above the MSC of 3.31 for ATG7, and among the highest CADD scores identified for variants within ATG7. (D) Expression of ATG7 c.1162 G/A mRNA in PBMCs from P. mRNA from patient PBMCs was reverse transcribed into cDNA, from which ATG7 was amplified and inserted into pJET1.2 and transformed into NEB 5-alpha cells. Eight bacteria colonies were Sanger sequenced for the expression of c.1162 G or c. 1162A, n = 14. (E) Conservation of the A388 amino acid in 11 species. The amino acids conserved across species are highligthed in black. The amino acids highlighted in gray indicate that the sequence contains a residue with similar properties as those in the same position across species, whereas white indicates an amino acid whith different properties. A388 is marked in red. (F) ATG7 protein expression measured in patient and controls (NHDF-1 [C1] and NHDF-2 [C2]) primary fibroblasts by western blotting. CADD, Combined anotation dependent depletion; GDI, gene damage index; MSC; mutation significance cutoff; SIFT, sorting intolerant from tolerant
Figure 2.
Figure 2.
Impaired viral control in the neuronal-like cell lines SK-N-SH ATG5 sgRNA and BECN1 sgRNA. (A) Neuronal-like SK-N-SH cells were infected with poliovirus (PV) at an MOI of 0.1. Western blots and quantification representative of three different experiments are shown. (B) Cells were infected with PV at an MOI of 0.1, and supernatants were harvested at the indicated time points. Data are shown with SEM, n = 3, and nonparametric Mann-Whitney rank sum test was used for statistical analysis. (C) Following 24 h of infection, supernatants were subjected to LDH cytotoxicity assay Data are shown with SD, n = 2, Students t-test. (D) Cells were infected with PV at an MOI of 0.1 for 6 h and total RNA was purified for measurement of IFNB mRNA by RT-qPCR. Data are shown with SD, n = 3, Students t-test. (E-F) Heat maps clustered by rows representing color-coded expression levels of 599 interferon stimulated genes (ISGs) [79] (E) or 598 human autophagy genes [80] and HADb (http://autophagy.lu/) (F) in the SH-SY5Y cell line infected with PV at an MOI of 1. Expression levels were normalized relative to uninfected cells as control group to accommodate probable technical or cell line specific effects. All experiments were performed three times, except data shown in C) which were performed twice. Table S3 and S4 show the expression values of the annotated ISGs or human autophagy genes in the heat maps. UT, Untreated; PV, Poliovirus; IFNB, Interferon beta. ISGs, Interferon signature genes. *, p ≤ 0.05; **, p ≤ 0.01; ***, p ≤ 0.001; ****, p ≤ 0.0001
Figure 3.
Figure 3.
Impaired LC3-I to LC3-II conversion and viral control in patient fibroblasts heterozygous for the ATG7A388T variant. (A) Immunofluorescence images of primary fibroblasts stained for LC3 (green), and 49-6-diamidino-2-phenylindole dihydrochloride (DAPI) (blue) following 24 h of PV infection at 0.1 MOI. Turquoise arrows indicate cytoplasmic LC3 (LC3-I), and yellow arrows indicate autophagosome-associated LC3 (LC3-II). (B) Quantification of the data shown in (A). Similar results were obtained following 48 h (Figure S2A-B), data are shown with SD, n = 3, nonparametric Mann-Whitney rank sum test was used for statistical analysis. The number of LC3 puncta-positive cells was quantified based on a minimum of three different pictures (from different regions of the slide) and 100 cells per slide. (C) Western blotting for LC3 and GAPDH on lysates from primary fibroblasts from P and three controls infected for 24 h with PV (MOI 50) EMCV (MOI 0.1), HSV-1 (MOI 0.1 or 1) and/or stimulated with 20 μm chloroquine 4 h prior to lysing. Western blot showing the patient and one control representative of the three independent experiments is shown. (D) Quantification of the three experiments from (C), data are shown with SEM, n = 3, nonparametric Mann-Whitney rank sum test was used for statistical analysis (E) Western blotting for LC3 and GAPDH on lysates from primary fibroblasts from P and 3 controls stimulated with 500 nM rapamycin for 12 h with and/or chloroquine 4 h prior to cell lysis l. Western blot showing the patient and one control representative of the three independent experiments is shown. (F) Quantification of the three experiments from (E), data are shown with SEM, n = 3, nonparametric Mann-Whitney rank sum test was used for statistical analysis. (G) SV40-immortalized fibroblasts were infected with PV at an MOI of 0.1 and supernatants were harvested at the indicated time points for measurement of viral yield. Data are shown with SEM, n = 3, nonparametric Mann-Whitney rank sum test was used for statistical analysis. Results were confirmed in primary fibroblast using four different controls (Figure S2G-H). (H) SV40-immortalized fibroblasts were infected with PV at an MOI of 0.1 and supernatants were isolated 48 and 72 h post infection and subjected to LDH release assay. Data are shown with SEM, n = 3, nonparametric Mann-Whitney rank sum test was used for statistical analysis. All experiments were performed at least three times. UT, untreated; Rapa, rapamycin; DMSO, dimethylsulfoxide; Chl, chloroquine; EMCV, encephalomyocarditis virus; HSV, herpes simplex virus; PV, poliovirus. # indicates SV40 immortalized cells. *, p ≤ 0.05; **, p ≤ 0.01; ***, p ≤ 0.001; ****, p ≤ 0.0001
Figure 4.
Figure 4.
Impaired viral control in SK-N-SH ATG7−/- neuronal-like cell line. (A) Immunofluorescence images of neuronal-like SK-N-SH cells stained for LC3 (green), and 49-6-diamidino-2-phenylindole dihydrochloride (DAPI) (blue). Cells were infected with PV at an MOI of 50 or stimulated with 50 nM chloroquine for 6 h. Turquoise arrows indicate cytosolic LC3 (LC3-I), and yellow arrows indicate autophagosome-associated LC3 (LC3-II). Images representative of the four different clones are shown. (B) Quantification of (A). The number of LC3 puncta-positive cells was quantified based on a minimum of three different pictures (from different regions of the slide) and 100 cells per slide. (C) Cell lysates were prepared from WT SK-N-SH and SK-N-SH ATG7−/- cells and immunoblotting for LC3 was performed. Western blots and quantification representative of 2 different clones. (D) Cell lines were infected with PV at an MOI of 10 and supernatants were harvested 8 h post infection. All data points are shown with bar line at mean, n = 2, nonparametric Mann-Whitney rank sum test was used for statistical analysis. (E) Cell lines were infected with PV at an MOI of 0.1 and supernatants were harvested 24 h post infection. Data representing all data points from two independent experiments are shown with bar line at mean, n = 3, nonparametric Mann-Whitney rank sum test was used for statistical analysis. Similar results were obtained for six different clones (Figure S4A). (F) Cell lines were infected with PV at an MOI of 0.1. Following 24 h supernatants were subjected to LDH release assay. Data are shown with SD, n = 2, nonparametric Mann-Whitney rank sum test was used for statistical analysis. Similar results were obtained in four different clones (Figure S4B). UT, untreated; Chl, chloroquine 50 nM; PV, poliovirus; WT, wild-type. *, p ≤ 0.05; **, p ≤ 0.01; ***, p ≤ 0.001; ****, p ≤ 0.0001
Figure 5.
Figure 5.
Rescue of WT ATG7 restores PV-induced autophagy and control of infection. (A) Immunofluorescence images of primary fibroblasts stained for LC3 (red), and 49-6-diamidino-2-phenylindole dihydrochloride (DAPI) (blue). The fibroblasts were transduced with lentiviral vectors encoding eGFP, WT ATG7 or ATG7A388T and infected with PV at an MOI of 0.1 for 24 h. Turquoise arrows indicate cytosolic LC3 (LC3-I), and yellow arrows indicate autophagosome-associated LC3 (LC3-II). (B) Quantification of the data shown in (A). The number of LC3 puncta-positive cells was quantified based on a minimum of three different pictures (from different regions of the slide) and 100 cells per slide. Data are shown with SD, n = 2, Students t-test was used for statistical analysis. (C) Western blotting for ATG7 and GAPDH on lysates from primary fibroblasts from P and the control transduced with lentiviral vectors encoding eGFP, WT ATG7 or ATG7A388T. (D) Primary fibroblasts were transduced with lentiviral vectors encoding eGFP, WT ATG7 or ATG7A388T and infected with PV at an MOI of 0.1. Supernatants were harvested following 72 h for measurement of viral yield. Data are shown with SD, n = 2, nonparametric Mann-Whitney rank sum test was used for statistical analysis. (E) Primary fibroblasts were transduced with lentiviral vectors encoding eGFP, WT ATG7 or ATG7A388T and infected with PV at an MOI of 0.1. Supernatants were harvested following 72 h for measurement of viral yield. Data are shown with SD, n = 2. All experiments were performed twice. Students t-test was used for statistical analysis. WT, wild-type; UT, untreated; P, patient; GFP, green fluorescent protein. *, p ≤ 0.05; **, p ≤ 0.01; ***, p ≤ 0.001; ****, p ≤ 0.0001

Similar articles

Cited by

References

    1. Nathanson N, Kew OM.. From emergence to eradication: the epidemiology of poliomyelitis deconstructed. Am J Epidemiol. 2010;172(11):1213–1229. - PMC - PubMed
    1. Nathanson N. The pathogenesis of poliomyelitis: what we don’t know. Adv Virus Res. 2008;71:1–50. - PubMed
    1. Kindberg E, Ax C, Fiore L, et al. Ala67Thr mutation in the poliovirus receptor CD155 is a potential risk factor for vaccine and wild-type paralytic poliomyelitis. J Med Virol. 2009;81(5):933–936. - PubMed
    1. Bucciol G, Moens L, Bosch B, et al. Lessons learned from the study of human inborn errors of innate immunity. J Allergy Clin Immunol. 2019;143(2):507–527. - PMC - PubMed
    1. Sabin AB. Pathogenesis of poliomyelitis; reappraisal in the light of new data. Science. 1956;123(3209):1151–1157. - PubMed

Publication types