. 2020 Oct 5:9:e59225.
doi: 10.7554/eLife.59225.

Ebola and Marburg virus matrix layers are locally ordered assemblies of VP40 dimers

Affiliations

Ebola and Marburg virus matrix layers are locally ordered assemblies of VP40 dimers

William Wan et al. Elife. .

Abstract

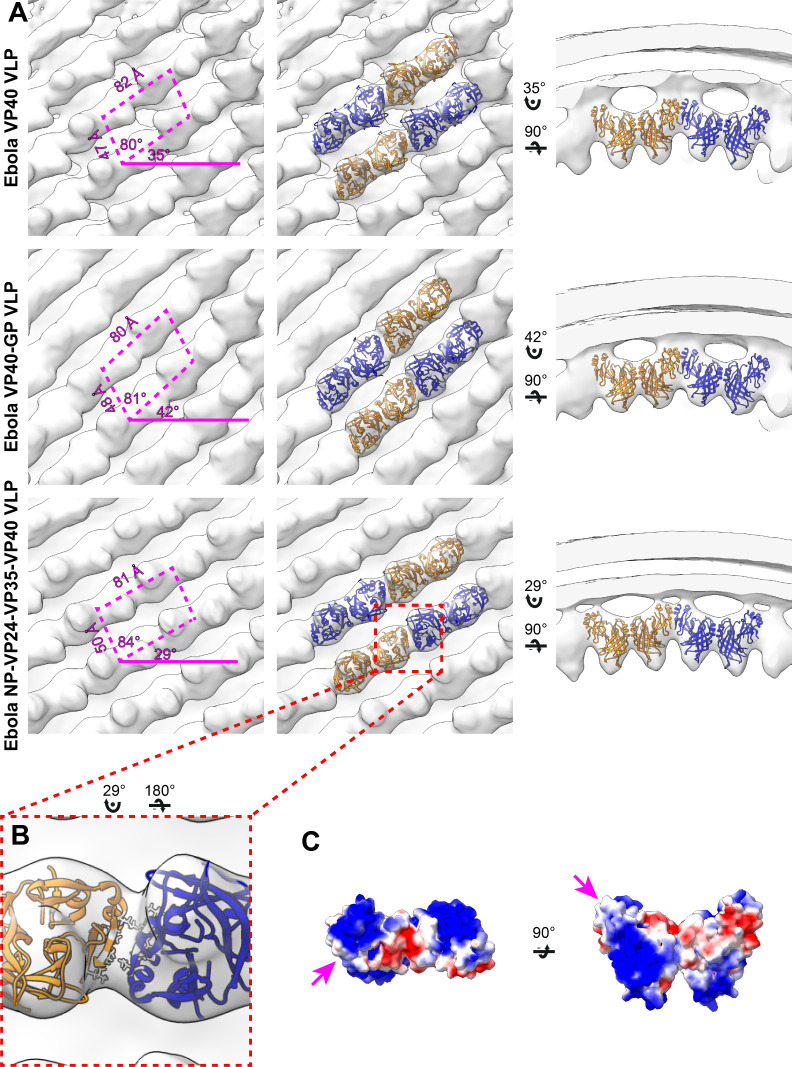
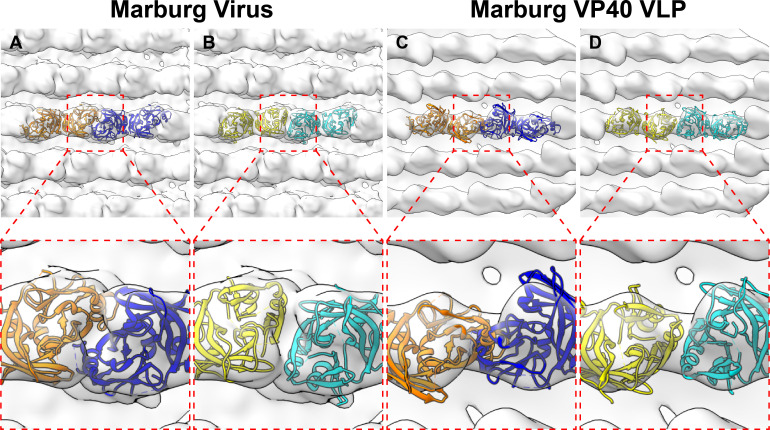
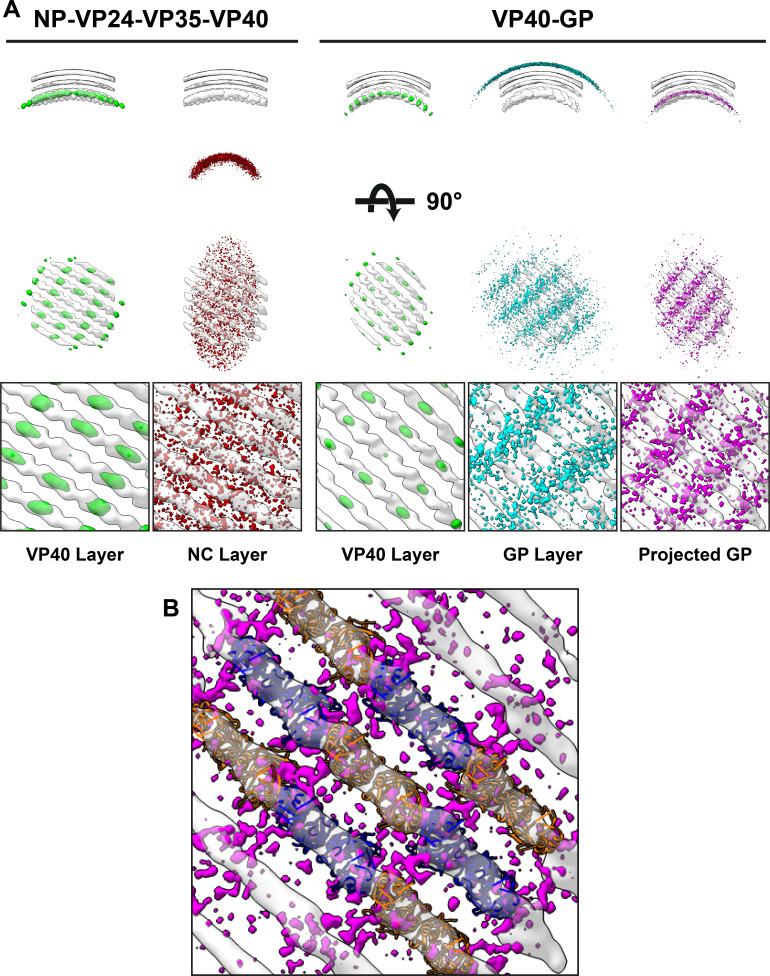
Filoviruses such as Ebola and Marburg virus bud from the host membrane as enveloped virions. This process is achieved by the matrix protein VP40. When expressed alone, VP40 induces budding of filamentous virus-like particles, suggesting that localization to the plasma membrane, oligomerization into a matrix layer, and generation of membrane curvature are intrinsic properties of VP40. There has been no direct information on the structure of VP40 matrix layers within viruses or virus-like particles. We present structures of Ebola and Marburg VP40 matrix layers in intact virus-like particles, and within intact Marburg viruses. VP40 dimers assemble extended chains via C-terminal domain interactions. These chains stack to form 2D matrix lattices below the membrane surface. These lattices form a patchwork assembly across the membrane and suggesting that assembly may begin at multiple points. Our observations define the structure and arrangement of the matrix protein layer that mediates formation of filovirus particles.

Keywords: Ebola virus; Marburg virus; infectious disease; matrix protein; microbiology; molecular biophysics; structural biology.


Conflict of interest statement

WW, MC, MN, LK, AK, ZB, SB, ES, JB No competing interests declared

Figures

Figure 1.
Figure 1.. Subtomogram averages of the eVP40 matrix layer in VLPs.
(A) The structure of the matrix layer in Ebola VP40, VP40-GP, and NP-VP24-VP35-VP40 VLPs. For these rows, the left column shows a portion of the subtomogram average from within the VLP; overlaid are the approximate unit-cell dimensions of the 2D lattice. eVP40 dimers are fitted as rigid bodies in the central column (PDB: 4ldb). The right column shows a cross-sectional view parallel to a VP40 linear chain. (B) A detailed view of the inter-dimeric CTD-CTD interface in Ebola NP-VP24-VP35-VP40 matrix, with hydrophobic residues at the inter-dimer interface shown in white; this interface is present in all three VLPs. (C) Electrostatic maps of the eVP40 dimer, with the hydrophobic patch forming the inter-dimer interface marked by an arrowhead.
Figure 1—figure supplement 1.
Figure 1—figure supplement 1.. Comparison of eVP40 assembly models.
Crystal structures of VP40 assembled by CTD-to-CTD interactions of VP40 dimers. NTDs are colored in blue, while CTDs are in orange. (A) eVP40, C2, with insets showing the residues of the hydrophobic CTD-CTD interface (magenta) and the CTD basic patch (green). (B) sVP40, C2; (C) mVP40; (D) eVP40 linear hexamer, (E) eVP40, P62, (F) eVP40, P6422. Views are from outside the membrane surface.
Figure 1—figure supplement 2.
Figure 1—figure supplement 2.. Fourier shell correlations of eVP40 subtomogram averages.
Arrows indicate resolution at FSC = 0.143.
Figure 1—figure supplement 3.
Figure 1—figure supplement 3.. Comparison of crystal packings observed in eVP40 structures.
(A) Zaire eVP40 (4ldb Bornholdt et al., 2013) crystallographic dimer. This dimer is then shown overlaid with: (B) Sudan eVP40 (3ctq Bornholdt et al., 2013), (C) Zaire eVP40 (1es6 Dessen et al., 2000), (D) Sudan eVP40 (4ld8 Bornholdt et al., 2013), (E) Zaire eVP40 P62 unit cell (this study), (F) Zaire eVP40 P6422 unit cell, (this study) (G) Zaire eVP40 linear hexamer (4ldd Bornholdt et al., 2013), (H) a superposition of all six structures.
Figure 1—figure supplement 4.
Figure 1—figure supplement 4.. Characterization of mutations that stabilize the CTD-CTD interface.
(A) Structure of side-by-side VP40 dimers. NTDs are colored blue and CTDs are colored orange. (B) Zoomed in view of the CTD-CTD interface. Modeling suggests that introduction of phenylalanine at positions 305 and 307 might stabilize the CTD-CTD interface. (C) Expression level of wild-type, R134A/I307R, I307F, and I307F/M305F VP40. R134A/I307R has been previously described to abolish VP40 dimerization and VLP release (Bornholdt et al., 2013). (D) Relative budding index of VLPs into the supernatant (ratio of supernatant to cell-lysate VP40, normalized to the WT values) from WT and mutant VP40. Three independent replicates. Values represent mean +/- SEM ns=P 0.05, *p≤0.05, ****p≤0.0001 by student’s t test. The M305F/I307F mutation, predicted to stabilize the CTD-CTD interface, shows enhanced budding compared to WT VP40.
Figure 2.
Figure 2.. Subtomogram averages of the mVP40 matrix layer in VLPs and virions.
(A) Top row shows the structure of the matrix layer in Marburg VP40 VLPs and bottom row shows Marburg virus. Left column shows a portion of the subtomogram average from within the filaments; overlaid are the approximate unit-cell dimensions of the 2D lattice. Center column shows the same view, but rigid-body fitted mVP40 dimers (PDB: 5b0v). Right column shows the same rigid-body fitting as in the center column, but as a cross-sectional view parallel to a VP40 linear chain. (B) A detailed view of the inter-dimeric CTD-CTD interface. (C) Electrostatic maps of mVP40 dimer.
Figure 2—figure supplement 1.
Figure 2—figure supplement 1.. Fourier shell correlations of mVP40 subtomogram averages.
Arrows indicate resolution at FSC = 0.143.
Figure 2—figure supplement 2.
Figure 2—figure supplement 2.. Rigid body fitting of crystal structures into mVP40 matrix layers.
(A and B) are densities from Marburg virus while (C and D) are densities from mVP40 VLPs. mVP40 crystal structures (PDB: 5b0v) are in blue and orange while eVP40 structures (PDB: 4ldb) are in cyan and yellow. For Marburg virus, both structures fit without clashing, while in Marburg VP40 VLPs only the eVP40 structures fit, suggesting a conformational change between the mVP40 crystal structure and the VLP.
Figure 3.
Figure 3.. Tomographic slices and lattice maps of matrix layers.
(A) Tomographic slice of the matrix layer protein density directly under the membrane bilayer; VP40 chains are seen as dark lines of density. (B) Central slice through each filament with lattice maps overlaid. VP40 dimers are visualized as rectangles, which connect into linear chains along the short sides. Colors are scaled from green to red, which denote high and low correlation scores, respectively. Low correlation scores are generally associated with regions where the local lattice is broken, thus correlating poorly with the strong lattice in the subtomogram average. Representative well-ordered regions are boxed in magenta, while representative poorly ordered regions are boxed in blue. Both are shown in detail in C.
Figure 3—figure supplement 1.
Figure 3—figure supplement 1.. Tomographic slices of Ebola virus matrix layers.
Left column shows regions that show ordered VP40 striations, center column shows virions with intact membranes but unstructured matrix layer, and right column shows matrix layer of moth-eaten membranes.
Figure 4.
Figure 4.. Plots of filament radii with respect to apparent helical pitch of linear VP40 chains.
Scatter points represent measurements for individual filaments. Dotted lines represent expected helical pitch for given radius, assuming a constant radius of curvature. The radii of curvature plotted from left to right are 30, 40, 50, and 60 nm.
Figure 5.
Figure 5.. Neighbor density maps of Ebola VLPs.
(A) First two columns are from NP-VP24-VP35-VP40 VLPs while last three columns are from VP40-GP VLPs, respective subtomogram averaging structures are shown as transparent densities. Each neighbor density map is shown as a colored isosurface indicating the preferred location of the named protein relative to the VP40 positions. Top row shows cross-sectional views through the filaments, center row shows view from outside the filaments, and bottom row shows detailed views from center row. In center and bottom rows, membrane is removed from subtomogram averages for easier viewing. The projected GP layer contains the same data as the GP layer, but projected on to the VP40 radius along the direction of the GP stalks. (B) A zoomed-in view of the low projected GP panel, showing the preferred positions of GP relative to a model of the VP40 layer.
Figure 5—figure supplement 1.
Figure 5—figure supplement 1.. Structure of Ebola GP from eVP40-GP VLPs.
(A) Top and (B) side view of Ebola GP subtomogram average. (C) FSC plot of Ebola GP subtomogram average; arrow indicates resolution at FSC = 0.143. Deposited as emd-11665.
Figure 6.
Figure 6.. The dimer-chain matrix model.
VP40 NTDs are shown in blue and CTDs are shown in orange. Our dimer-chain model, where VP40 dimers form linear chains directly below the membrane surface and an unknown non-VP40 component tethers the NC to the matrix layer. (A) Shows a cross-section view, while (B) Shows a surface view directly below the membrane surface.

Similar articles

Cited by

References

    1. Adams PD, Afonine PV, Bunkóczi G, Chen VB, Davis IW, Echols N, Headd JJ, Hung LW, Kapral GJ, Grosse-Kunstleve RW, McCoy AJ, Moriarty NW, Oeffner R, Read RJ, Richardson DC, Richardson JS, Terwilliger TC, Zwart PH. PHENIX: a comprehensive Python-based system for macromolecular structure solution. Acta Crystallographica Section D Biological Crystallography. 2010;66:213–221. doi: 10.1107/S0907444909052925. - DOI - PMC - PubMed
    1. Adu-Gyamfi E, Digman MA, Gratton E, Stahelin RV. Investigation of ebola VP40 assembly and oligomerization in live cells using number and brightness analysis. Biophysical Journal. 2012;102:2517–2525. doi: 10.1016/j.bpj.2012.04.022. - DOI - PMC - PubMed
    1. Adu-Gyamfi E, Soni SP, Xue Y, Digman MA, Gratton E, Stahelin RV. The ebola virus matrix protein penetrates into the plasma membrane: a key step in viral protein 40 (VP40) oligomerization and viral egress. The Journal of Biological Chemistry. 2013;288:5779–5789. doi: 10.1074/jbc.M112.443960. - DOI - PMC - PubMed
    1. Beniac DR, Melito PL, Devarennes SL, Hiebert SL, Rabb MJ, Lamboo LL, Jones SM, Booth TF. The organisation of ebola virus reveals a capacity for extensive, modular polyploidy. PLOS ONE. 2012;7:e29608. doi: 10.1371/journal.pone.0029608. - DOI - PMC - PubMed
    1. Bharat TA, Riches JD, Kolesnikova L, Welsch S, Krähling V, Davey N, Parsy ML, Becker S, Briggs JA. Cryo-electron tomography of marburg virus particles and their morphogenesis within infected cells. PLOS Biology. 2011;9:e1001196. doi: 10.1371/journal.pbio.1001196. - DOI - PMC - PubMed

Publication types

MeSH terms