Symbol Digit Modalities Test Variant in a Smartphone App for Persons With Multiple Sclerosis: Validation Study
- PMID: 33016886
- PMCID: PMC7573704
- DOI: 10.2196/18160
Symbol Digit Modalities Test Variant in a Smartphone App for Persons With Multiple Sclerosis: Validation Study
Abstract
Background: The decline of cognitive processing speed (CPS) is a common dysfunction in persons with multiple sclerosis (MS). The Symbol Digit Modalities Test (SDMT) is widely used to formally quantify CPS. We implemented a variant of the SDMT in MS sherpa, a smartphone app for persons with MS.
Objective: The aim of this study was to investigate the construct validity and test-retest reliability of the MS sherpa smartphone variant of the SDMT (sSDMT).
Methods: We performed a validation study with 25 persons with relapsing-remitting MS and 79 healthy control (HC) subjects. In the HC group, 21 subjects were matched to the persons with MS with regard to age, gender, and education and they followed the same assessment schedule as the persons with MS (the "HC matched" group) and 58 subjects had a less intense assessment schedule to determine reference values (the "HC normative" group). Intraclass correlation coefficients (ICCs) were determined between the paper-and-pencil SDMT and its smartphone variant (sSDMT) on 2 occasions, 4 weeks apart. Other ICCs were determined for test-retest reliability, which were derived from 10 smartphone tests per study participant, with 3 days in between each test. Seven study participants with MS were interviewed regarding their experiences with the sSDMT.
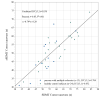
Results: The SDMT scores were on average 12.06% higher than the sSDMT scores, with a standard deviation of 10.68%. An ICC of 0.838 was found for the construct validity of the sSDMT in the combined analysis of persons with MS and HC subjects. Average ICCs for test-retest reliability of the sSDMT for persons with MS, the HC matched group, and the HC normative group were 0.874, 0.857, and 0.867, respectively. The practice effect was significant between the first and the second test of the persons with MS and the HC matched group and trivial for all other test-retests. The interviewed study participants expressed a positive attitude toward the sSDMT, but they also discussed the importance of adapting a smartphone cognition test in accordance with the needs of the individual persons with MS.
Conclusions: The high correlation between sSDMT and the conventional SDMT scores indicates a very good construct validity. Similarly, high correlations underpin a very good test-retest reliability of the sSDMT. We conclude that the sSDMT has the potential to be used as a tool to monitor CPS in persons with MS, both in clinical studies and in clinical practice.
Keywords: cognition; mobile phone; processing speed; relapsing-remitting multiple sclerosis.
©Pim van Oirschot, Marco Heerings, Karine Wendrich, Bram den Teuling, Marijn B Martens, Peter J Jongen. Originally published in JMIR mHealth and uHealth (http://mhealth.jmir.org), 05.10.2020.
Conflict of interest statement
Conflicts of Interest: PvO is employed by Orikami Digital Health Products. BdT is a founder and owner of Orikami Digital Health Products. PJJ is advisor to Orikami Digital Health Products and has received honoraria from Bayer Netherlands for consultancy activities.
Figures


Similar articles
-
Reliability, construct and concurrent validity of a smartphone-based cognition test in multiple sclerosis.Mult Scler. 2022 Feb;28(2):300-308. doi: 10.1177/13524585211018103. Epub 2021 May 26. Mult Scler. 2022. PMID: 34037472 Free PMC article.
-
A Two-Minute Walking Test With a Smartphone App for Persons With Multiple Sclerosis: Validation Study.JMIR Form Res. 2021 Nov 17;5(11):e29128. doi: 10.2196/29128. JMIR Form Res. 2021. PMID: 34787581 Free PMC article.
-
A New Smartphone-Based Cognitive Screening Battery for Multiple Sclerosis (icognition): Validation Study.J Med Internet Res. 2025 Jan 20;27:e53503. doi: 10.2196/53503. J Med Internet Res. 2025. PMID: 39832354 Free PMC article.
-
Symbol Digit Modalities Test in progressive multiple sclerosis.Neurol Neurochir Pol. 2024;58(3):221-232. doi: 10.5603/pjnns.98204. Epub 2024 Mar 21. Neurol Neurochir Pol. 2024. PMID: 38512126 Review.
-
Cognitive Relapse in Multiple Sclerosis: New Findings and Directions for Future Research.NeuroSci. 2022 Aug 26;3(3):510-520. doi: 10.3390/neurosci3030036. eCollection 2022 Sep. NeuroSci. 2022. PMID: 39483431 Free PMC article. Review.
Cited by
-
Electronic Health Interventions in the Case of Multiple Sclerosis: From Theory to Practice.Brain Sci. 2021 Feb 2;11(2):180. doi: 10.3390/brainsci11020180. Brain Sci. 2021. PMID: 33540640 Free PMC article. Review.
-
Feasibility, reliability, and validity of ambulatory smartphone-administered cognitive tests in multiple sclerosis.Mult Scler. 2025 Mar;31(3):363-375. doi: 10.1177/13524585251320814. Epub 2025 Feb 25. Mult Scler. 2025. PMID: 40001288 Free PMC article.
-
Reliability and Construct Validity of a Mobile Application for the Finger Tapping Test Evaluation in People with Multiple Sclerosis.Brain Sci. 2024 Apr 21;14(4):407. doi: 10.3390/brainsci14040407. Brain Sci. 2024. PMID: 38672056 Free PMC article.
-
Measuring Situational Cognitive Performance in the Wild: A Psychometric Evaluation of Three Brief Smartphone-Based Test Procedures.Assessment. 2024 Sep;31(6):1270-1291. doi: 10.1177/10731911231213845. Epub 2023 Dec 14. Assessment. 2024. PMID: 38097924 Free PMC article.
-
Cognitive fatigability assessment test (cFAST): Development of a new instrument to assess cognitive fatigability and pilot study on its association to perceived fatigue in multiple sclerosis.Digit Health. 2022 Aug 25;8:20552076221117740. doi: 10.1177/20552076221117740. eCollection 2022 Jan-Dec. Digit Health. 2022. PMID: 36046638 Free PMC article.
References
-
- Foley. Benedict Ralph H B, Gromisch Elizabeth S, Deluca John. The Need for Screening, Assessment, and Treatment for Cognitive Dysfunction in Multiple Sclerosis: Results of a Multidisciplinary CMSC Consensus Conference, September 24, 2010. Int J MS Care. 2012;14(2):58–64. doi: 10.7224/1537-2073-14.2.58. http://europepmc.org/abstract/MED/24453735 - DOI - PMC - PubMed
-
- van Geest Q, Douw L, van 't Klooster S, Leurs C, Genova H, Wylie G, Steenwijk M, Killestein J, Geurts J, Hulst H. Information processing speed in multiple sclerosis: Relevance of default mode network dynamics. Neuroimage Clin. 2018;19:507–515. doi: 10.1016/j.nicl.2018.05.015. https://linkinghub.elsevier.com/retrieve/pii/S2213-1582(18)30161-X - DOI - PMC - PubMed
Publication types
MeSH terms
LinkOut - more resources
Full Text Sources
Other Literature Sources
Medical

