. 2020 Nov 2;130(11):5782-5799.
doi: 10.1172/JCI127916.

Epigenetic modulator inhibition overcomes temozolomide chemoresistance and antagonizes tumor recurrence of glioblastoma

Affiliations

Epigenetic modulator inhibition overcomes temozolomide chemoresistance and antagonizes tumor recurrence of glioblastoma

Byoung-San Moon et al. J Clin Invest. .

Abstract

Glioblastoma multiforme (GBM) heterogeneity causes a greater number of deaths than any other brain tumor, despite the availability of alkylating chemotherapy. GBM stem-like cells (GSCs) contribute to GBM complexity and chemoresistance, but it remains challenging to identify and target GSCs or factors that control their activity. Here, we identified a specific GSC subset and show that activity of these cells is positively regulated by stabilization of methyl CpG binding domain 3 (MBD3) protein. MBD3 binds to CK1A and to BTRCP E3 ubiquitin ligase, triggering MBD3 degradation, suggesting that modulating this circuit could antagonize GBM recurrence. Accordingly, xenograft mice treated with the CK1A activator pyrvinium pamoate (Pyr-Pam) showed enhanced MBD3 degradation in cells expressing high levels of O6-methylguanine-DNA methyltransferase (MGMT) and in GSCs, overcoming temozolomide chemoresistance. Pyr-Pam blocked recruitment of MBD3 and the repressive nucleosome remodeling and deacetylase (NuRD) complex to neurogenesis-associated gene loci and increased acetyl-histone H3 activity and GSC differentiation. We conclude that CK1A/BTRCP/MBD3/NuRD signaling modulates GSC activation and malignancy, and that targeting this signaling could suppress GSC proliferation and GBM recurrence.

Keywords: Brain cancer; Drug therapy; Epigenetics; Oncology; Stem cells.


Conflict of interest statement

Conflict of interest: The authors have declared that no conflict of interest exists.

Figures

Figure 1
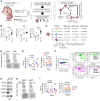
Figure 1. A CD44+CD133+CXCR4+ triple-positive GBM subpopulation exhibits previously uncharacterized GSC properties, and MBD3 regulates their marker expression and stemness.
(A) Schematic overview for identification of putative glioblastoma stem cell (GSC) populations. (B) TMA analysis (normal brain, n = 8; grade II [GII], n = 8; GIII, IV, n = 16). (C) The number of tumors for each condition is presented. (D) Relative sizes of secondary spheres. (E) Relative sizes and numbers of spheres in Supplemental Figure 3D. Numbers in the color key above the right panel indicate the ranges of sphere sizes (pixels) of CD133+CD44+CXCR4+ triple-positive (+) and -negative (–) populations; 2000 and 4000 refer to the number of cells used. (F) FACS analyses of the CD44+CD133+CXCR4+ triple-positive subpopulation in both MBD3hi and MBD3lo T98G GSCs. (G) Adherent MBD3+ or MBD3 T98G cells were harvested after culture for 2 days in N2 medium with bFGF, and lysates were immunoblotted with indicated antibodies. (H) FACS-isolated MBD3+ or MBD3 cells were seeded as single cells in ultra-low-attachment 96-well plates for 1, 3, or 5 days to allow sphere formation. Relative sizes of spheres shown in left panel. (I) Relative sizes and numbers of spheres shown in Supplemental Figure 3I. Numbers in the color key next to the right panel indicate the ranges of sphere sizes (pixels) of MBD3-positive (+) and -negative (–) populations; 2000 and 4000 refer to the number of cells used. In B, D, E, and GI, quantification was performed using ImageJ software (NIH). GBM, glioblastoma multiforme. Data are presented as the mean ± SD and are representative of at least 3 independent experiments. Statistical significance was tested with 1-way ANOVA with Tukey’s multiple-comparison test (B, D, and H) or unpaired, 2-tailed Student’s t test (E and I). *P < 0.05; **P < 0.005; ***P < 0.0005.
Figure 2
Figure 2. Degradation and ubiquitination of MBD3 in GSCs.
(A) Left: CD44+CD133+CXCR4+ triple-positive cells sorted by FACS from T98G GSCs at a purity of 99.8% were grown on coverslips to monitor differentiation capacity over 5 days. Right: Undifferentiated cells (Un) and cells after 5 days of differentiation (D5) were analyzed by immunofluorescence with the indicated antibodies. Nuclei were counterstained with DAPI. Scale bars: 50 μm. (B) qPCR analysis of the indicated mRNAs in samples from A (n = 3 or 4). (C) Immunoblot (IB) analysis of MBD3 and α-tubulin in lysates of T98G GSCs, treated with cycloheximide (CHX) for indicated times (h, hours) and with or without MG132. (D) T98G GSCs were treated with MG132 for 0, 3, 6, and 9 hours before harvesting. Whole-cell lysates (WCLs) were immunoblotted using the indicated antibodies. (E and F) Ubiquitination assay of overexpressed or endogenous MBD3 using indicated lysates of cells transfected with MBD3-Flag and HA-Ub expression vectors and treated 1 day later with MG132 for 6 hours before harvesting. After lysis, immunoprecipitation (IP) was performed with Flag-M2 beads or MBD3 antibody. WCLs were analyzed by IB with the indicated antibodies. Data are presented as the mean ± SD. *P < 0.05; **P < 0.005; ***P < 0.0005 by unpaired, 2-tailed Student’s t test.
Figure 3
Figure 3. BTRCP is an E3 ubiquitin ligase promoting MBD3 polyubiquitination and subsequent proteasomal degradation.
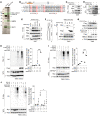
(A) Anti-Flag IPs from T98G-Flag-MBD3 cells were resolved by SDS-PAGE and visualized by silver staining. Specific bands were excised and analyzed using mass spectrometry. H, IgG heavy chain; L, IgG light chain. (B) Diagram of conserved domains of MBD3 protein (upper) and the 2 degron (DSGX(n)S) motifs of MBD3 orthologs (lower). MBD, methyl CpG binding domain. (C and D) IP with anti-Myc or Flag-M2 beads of respective lysates made from cells transfected with either HA-MBD3 with or without Myc-BTRCP or Myc-BTRCP plus control vector or Flag-MBD3. (E) IP using Myc-conjugated beads in lysates from cells transfected with BTRCP-Flag plus control vector or WT or SA double (S39A/S45A or S85A/S106A) or quadruple (SallA) mutant MBD3-Myc. Whole-cell lysates (WCLs) were immunoblotted using the indicated antibodies. (F) Diagram of BTRCP deletion mutants (left) and IP using Flag-M2 beads of lysates from cells transfected with MBD3-Myc plus control vector, WT BTRCP-Flag, or indicated BTRCP deletion mutants (right). WCLs were immunoblotted with the indicated antibodies. (G) T98G cells were transfected with empty vector or increasing levels of Flag-tagged BTRCP expression vector. WCLs were collected 48 hours later and immunoblotted (IB) with the indicated antibodies. (H and I) Effect of BTRCP overexpression or knockdown on MBD3 polyubiquitination. Sorted T98G GSCs were transfected with the indicated vectors and treated with MG132. Left: WCLs were immunoprecipitated with the indicated beads recognizing Myc. Right: Quantification of polyubiquitinated MBD3 normalized to α-tubulin (n = 3). (J) Ubiquitination of overexpressed MBD3 in lysates of T98G GSCs transfected with WT or SallA mutant Myc-MBD3 plus HA-Ub expression vectors and treated 1 day later with MG132 for 6 hours before harvest. After lysis, IP was performed with Flag-M2 beads. WCLs were analyzed by IB with indicated antibodies. Data are representative of at least 3 independent experiments. BTRCP, β-transducin repeats–containing protein. Data are presented as the mean ± SD. *P < 0.05; ***P < 0.0005 by 1-way ANOVA with Tukey’s multiple-comparison test.
Figure 4
Figure 4. CK1A-mediated phosphorylation of serine residues in MBD3 degron motif promotes MBD3 degradation.
(A) Group-based Prediction System software (version 2.1) predicts that CK1A phosphorylates MBD3 serines 39, 45, 85, and 106 at degron domains. (B) IP using Myc or Flag-M2 beads from respective lysates of HEK293T cells harboring Flag-tagged CK1A in the presence or absence of Myc-MBD3 or harboring HA-MBD3 plus either control vector or Flag-CK1A. Whole-cell lysates (WCLs) were immunoblotted (IB) with the indicated antibodies. (C) WCLs of T98G GSCs transfected with Myc-tagged MBD3 or control vectors plus increasing levels of Flag-tagged CK1A vector were immunoprecipitated with the indicated beads recognizing Myc. (D) Upper: USC02 GSCs were transfected with control (shCtrl) or shCK1A shRNA and treated with cycloheximide (CHX) for indicated times (h, hours) before harvest. Lower: HEK293T cells were treated with DMSO or the CK1A inhibitor D4476 (25 μM) and treated with CHX for indicated times before harvest. (E and F) Effect of CK1A activation or inhibition on MBD3 protein stability. T98G GSCs were treated with varying doses of pyrvinium pamoate (Pyr-Pam) (E) or 10 μM Pyr-Pam and 0–50 μM D4476 as indicated (F). WCLs were immunoblotted with the indicated antibodies. Data are presented as the mean ± SD and are representative of at least 3 independent experiments. **P < 0.005; ***P < 0.0005 by 2-way ANOVA with Bonferroni’s post hoc test.
Figure 5
Figure 5. CK1A facilitates BTRCP-mediated MBD3 polyubiquitination.
(AC) Effect of CK1A activation or inhibition on MBD3 polyubiquitination. T98G cells or T98G GSCs were transfected with the indicated vectors and/or treated with varying doses of either D4476 or Pyr-Pam. Whole-cell lysates (WCLs) were then immunoprecipitated with the indicated beads recognizing Myc. Quantification of polyubiquitinated MBD3 normalized to α-tubulin (n = 3). (D) Effect of BTRCP knockdown on CK1A-mediated MBD3 polyubiquitination. HEK293T cells were transfected with the indicated vector and then treated with MG132. WCLs were then immunoprecipitated with the indicated beads recognizing Myc. DN, dominant negative CK1A construct. Data are presented as the mean ± SD and are representative of at least 3 independent experiments. *P < 0.05; **P < 0.005; ***P < 0.0005 by 1-way ANOVA with Tukey’s multiple-comparison test.
Figure 6
Figure 6. MBD3 loss inhibits GBM proliferation and stemness activity in vitro.
(AF) T98G GSCs or USC02 GSCs infected with shScramble or shMBD3 lentivirus were seeded on 6-well plates and assayed for colony formation. Foci were photographed (left) and quantified (right). (G) qPCR analysis to detect the indicated mRNAs. *P < 0.05; **P < 0.005; ***P < 0.0005 by 2-way ANOVA with Bonferroni’s post hoc test (AF) or unpaired 2-tailed Student’s t test (G).
Figure 7
Figure 7. CK1A activation inhibits GBM cell proliferation in vitro.
(A) T98G cells were treated with the indicated concentrations of D4476 or Pyr-Pam for 96 hours, and proliferation was quantified using an MTT assay. (B) T98G GSCs were seeded at a density of 2 × 10⁴ cells/plate in ultra-low-attachment 96-well plates and then treated with the indicated concentrations of D4476 or Pyr-Pam for 3 days to allow sphere formation. Lower panel: Relative size of spheres of each group was measured by ImageJ software. (C) qPCR analysis of spheres shown in B to detect the indicated mRNAs. (D) LN229, U118MG, and U87MG (MGMT-low expressing) or U251MG and T98G (MGMT-high expressing) cells were seeded on 12-well plates and treated with the indicated concentrations of TMZ, Pyr-Patm, or both for 8 days. Colony-formation assays were performed. Foci were quantified using ImageJ software. Rel., relative; TMZ, temozolomide; Pyrp, Pyr-Pam (pyrvinium pamoate). Data are presented as the mean ± SD and are representative of at least 3 independent experiments. *P < 0.05; **P < 0.005; ***P < 0.0005 by 1-way ANOVA with Tukey’s multiple-comparison test.
Figure 8
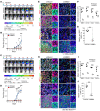
Figure 8. MBD3 loss inhibits progression of GBM with either low or high MGMT expression.
(AJ) pLuc-U118MG cells or pLuc-U251MG cells depleted of MBD3 by shMBD3 or shScramble lentiviral controls were intracranially injected into immunocompromised (NSG) mice. (AD) Serial bioluminescence imaging was used to monitor tumor volume (each group, n = 5). (B and D) Tumor volume was measured every 3 or 4 days. Quantification (total flux; p/s, photons per second) of the bioluminescent signal from tumor regions in A and C. (EJ) After 4 weeks, mice were sacrificed and analyzed immunohistochemically with the indicated antibodies. Expression of CD133, CD44, CXCR4, and MBD3 (F and I) or Ki67 and nestin (G and J) was quantified using ImageJ software. Images were captured using a Zeiss confocal microscope. Representative images were selected from at least 3 different fields. Data are presented as the mean ± SD. *P < 0.05; **P < 0.005; ***P < 0.0005 by 2-way ANOVA with Bonferroni’s post hoc test (B and D) or unpaired, 2-tailed Student’s t test (F, G, I, and J). Scale bars: 50 μm; and inset scale bars: 50 μm.
Figure 9
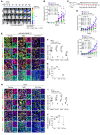
Figure 9. Stimulation of CK1A signaling inhibits progression of TMZ-resistant GBM with high MGMT expression and patient-derived primary GBM.
(A and C) pLuc-U251MG cells or human primary GBM cells were intracranially (i.c.) or subcutaneously (s.c.) injected into immunocompromised (NSG) mice (n = 4 or 5 per group). (A) Upper: Schematic showing injection of GBM cells and intrathecal infusion of drugs (vehicle, TMZ [5 mg/kg per day], Pyr-Pam [1 mg/kg per day]) for 22 days using implanted osmotic pump. Lower: Representative bioluminescence images of mice at indicated times after intracranial injection. (B) Quantification (total flux; p/s, photons per second) of the bioluminescent signal from tumor regions shown in A. mpk, mg/kg. (D) Tumor volumes of Supplemental Figure 8, A and B, were measured every 3 or 4 days. Tumor volumes were measured using Vernier calipers, applying the formula π/6 × length ×width × height. (EJ) After 4 weeks, mice were sacrificed and analyzed immunohistochemically with indicated antibodies. Expression of CD44, CD133, CXCR4, MBD3 (F and I), Ki67, and nestin (G and J) in the immunostained GBM tissues in each representative xenograft GBM tumor was quantified using ImageJ software. Images were captured using a Zeiss confocal microscope. Representative images were selected from at least 3 different fields. Pyr-Pam, pyrvinium pamoate. Data are presented as the mean ± SD. *P < 0.05; **P < 0.005; ***P < 0.0005 by 2-way ANOVA with Bonferroni’s post hoc test (B and D) or 1-way ANOVA with Tukey’s multiple-comparison test (F, G, I, and J). Scale bars: 50 μm; and inset scale bars: 50 μm.
Figure 10
Figure 10. MBD3 loss decreases recruitment of MBD3-NuRD transcription repressive complex components and increases acetyl–histone H3 activity on neural differentiation–associated gene promoters.
(AD) ChIP-qPCR analysis of MBD3, HDAC1, HDAC2, MTA1, and acetyl–histone H3 occupancy at MBD3-binding locus in U118MG or U251MG cells treated with shScramble (n = 3) and shMBD3 (n = 3) lentiviral vectors. Immunoglobulin G (IgG) ChIP served as a negative control. Values are normalized to input control and represent the mean ± SD. *P < 0.05; **P < 0.005; ***P < 0.0005 by unpaired 2-tailed Student’s t test.
Figure 11
Figure 11. CK1A and BTRCP/MBD3 signaling regulates enrichment of MBD3-NuRD transcription repressive complex components and acetyl–histone H3 activity on neural differentiation–associated gene promoters.
(AD) ChIP-qPCR analysis of MBD3, HDAC1, HDAC2, MTA1, and acetyl–histone H3 occupancy at the MBD3-binding locus in U118MG or U251MG cells treated with DMSO (n = 3) and Pyr-Pam (n = 3). Immunoglobulin G (IgG) ChIP served as a negative control. Values are normalized to input control and represent the mean ± SD. *P < 0.05; **P < 0.005; ***P < 0.0005 by unpaired, 2-tailed Student’s t test. (E) Graphical summary showing that activation of CK1A signaling by Pyr-Pam induces proteasomal degradation of MBD3 and neural differentiation of GSCs through inhibiting enrichment of the MBD3-NuRD complex on neurogenesis-associated gene loci, leading to decreased GBM recurrence and growth. NuRD, nucleosome-remodeling and deacetylation.

Similar articles

Cited by

References

    1. Legler JM, et al. Cancer surveillance series [corrected]: brain and other central nervous system cancers: recent trends in incidence and mortality. J Natl Cancer Inst. 1999;91(16):1382–1390. doi: 10.1093/jnci/91.16.1382. - DOI - PubMed
    1. Singh SK, et al. Identification of human brain tumour initiating cells. Nature. 2004;432(7015):396–401. doi: 10.1038/nature03128. - DOI - PubMed
    1. Bao S, et al. Glioma stem cells promote radioresistance by preferential activation of the DNA damage response. Nature. 2006;444(7120):756–760. doi: 10.1038/nature05236. - DOI - PubMed
    1. Beck B, Blanpain C. Unravelling cancer stem cell potential. Nat Rev Cancer. 2013;13(10):727–738. doi: 10.1038/nrc3597. - DOI - PubMed
    1. Sanai N, Alvarez-Buylla A, Berger MS. Neural stem cells and the origin of gliomas. N Engl J Med. 2005;353(8):811–822. doi: 10.1056/NEJMra043666. - DOI - PubMed

Publication types

MeSH terms