. 2020 Oct 1;20(10):8.
doi: 10.1167/jov.20.10.8.

Optic flow parsing in the macaque monkey

Affiliations

Optic flow parsing in the macaque monkey

Nicole E Peltier et al. J Vis. .

Abstract

During self-motion, an independently moving object generates retinal motion that is the vector sum of its world-relative motion and the optic flow caused by the observer's self-motion. A hypothesized mechanism for the computation of an object's world-relative motion is flow parsing, in which the optic flow field due to self-motion is globally subtracted from the retinal flow field. This subtraction generates a bias in perceived object direction (in retinal coordinates) away from the optic flow vector at the object's location. Despite psychophysical evidence for flow parsing in humans, the neural mechanisms underlying the process are unknown. To build the framework for investigation of the neural basis of flow parsing, we trained macaque monkeys to discriminate the direction of a moving object in the presence of optic flow simulating self-motion. Like humans, monkeys showed biases in object direction perception consistent with subtraction of background optic flow attributable to self-motion. The size of perceptual biases generally depended on the magnitude of the expected optic flow vector at the location of the object, which was contingent on object position and self-motion velocity. There was a modest effect of an object's depth on flow-parsing biases, which reached significance in only one of two subjects. Adding vestibular self-motion signals to optic flow facilitated flow parsing, increasing biases in direction perception. Our findings indicate that monkeys exhibit perceptual hallmarks of flow parsing, setting the stage for the examination of the neural mechanisms underlying this phenomenon.


Figures

Figure 1.
Figure 1.
The flow-parsing hypothesis explains how the visual system might compute an object's motion during self-motion. (A) During forward self-motion, optic flow expands radially outward from a central focus of expansion. The retinal motion of an independently moving object will be the vector sum of its motion relative to the world and the optic flow vector at its location. In this illustration, an object moving upward in the right visual field will have a rightward component added to its motion (red). (B) To compute the object's motion relative to the world, the visual system globally subtracts the optic flow that resulted from self-motion. A leftward component (blue) is added to the independently moving object's motion. (C) After parsing out the optic flow, any remaining motion is due to the motion of the object relative to the world (purple).
Figure 2.
Figure 2.
Schematic illustration of the object direction discrimination task. (A) The object moved in 1 of 11 linearly spaced directions centered on straight upward. Monkey M discriminated object direction within a range of ± 40°, while Monkey P discriminated object direction within a range of ± 20°. 0° denotes object motion straight upward (in screen coordinates). (B) Each trial initiated when a fixation target appeared and the monkey fixated on the target. The monkey was required to maintain fixation during the presentation of a stimulus, which consisted of an object moving upward obliquely and a global optic flow field simulating forward or backward self-motion. At the end of the stimulus presentation, two choice targets appeared. The monkey was required to make a saccade to one of the targets indicating whether the object's motion was rightward or leftward of vertical. (C) Top-down schematic illustrating motion of subject and object in depth over the course of the trial. Optic flow simulated the monkey's self-motion through a stationary cloud of dots. The object moved in depth relative to the world so that it stayed at a constant distance from the monkey. (D) Timeline of events within each trial.
Figure 3.
Figure 3.
Schematic illustration of visual stimuli and psychometric functions. (A–C) Illustration of visual stimuli under different self-motion conditions. The small patch of dots, which represents the object to be discriminated, moves to the right or left of straight upward. A circular mask surrounds the object to prevent local motion comparisons between the object and the background optic flow. (A) In the forward self-motion condition, optic flow expands radially outward from a central focus of expansion. (B) In the backward condition, optic flow contracts radially toward a central focus of contraction. (C) In the stationary condition, background dots were static. Note that the motion of the target object on the display is identical for each of the background motion conditions. (D–F) Schematic illustrations of psychometric functions illustrating different amounts of flow parsing. Functions illustrate the proportion of rightward judgments the subject made as a function of object direction in screen-relative coordinates. Line color indicates self-motion condition (blue: stationary, green: forward, red: backward). (D) If the subject does not flow parse at all, psychometric curves will lie on top of each other. (E) If the subject performs partial flow parsing, psychometric curves for forward and backward conditions will shift horizontally. (F) If the subject performs complete flow parsing, indicating object motion in world-centered coordinates, psychometric curves for forward and backward conditions will be substantially separated. The size of the shift predicted by flow parsing depends on self-motion speed and object location.
Figure 4.
Figure 4.
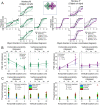
Perceived object motion is biased depending on the direction and speed of optic flow. (A, B) Summary psychometric curves from monkeys discriminating object direction in the presence of optic flow (6,930 trials from Monkey M; 5,313 trials from Monkey P). Smooth curves show fits of a cumulative Gaussian function to the data points. Symbols denote data from the stationary (squares), forward (filled circles), and backward (open circles) self-motion conditions. (A) For Monkey M, when the object was in the left visual field, perceived direction was biased rightward during forward self-motion and leftward during backward self-motion. The amount of bias increased with the amplitude of self-motion. (B) For Monkey P, when the object was in the right visual field, perceived direction was biased leftward during forward self-motion and rightward during backward self-motion. (C) PSEs for Monkey M are plotted as a function of self-motion amplitude. Colors denote the self-motion condition: stationary (blue), forward (green), and backward (red). Multiple points for each self-motion amplitude indicate results from individual sessions. (D) PSEs for Monkey P are plotted against self-motion amplitude; format as in panel C. (E, F) Psychophysical thresholds are plotted as a function of self-motion amplitude for Monkeys M and P, respectively. Format as in Panels C and D.
Figure 5.
Figure 5.
Summary of the relationship between measured and predicted PSE shifts. (A) Both monkeys show a strong, roughly linear relationship between measured PSE shifts and those predicted by flow parsing. Circles: PSE values from individual sessions for Monkey M (green) and Monkey P (purple). Asterisks: PSE shifts from psychometric data that were pooled across sessions. (B) Average flow-parsing gain (observed PSE shift divided by expected PSE shift), as a function of self-motion amplitude, for Monkey M (green) and Monkey P (purple). Error bars indicate 95% confidence intervals.
Figure 6.
Figure 6.
Dependence of discrimination performance on horizontal and vertical object location. (A) Psychometric functions (format as in Figure 4A and B) for each animal at five different object locations (17,382 trials from Monkey M; 16,996 trials from Monkey P). Inset: Schematic of object locations tested for Monkey M (green) and Monkey P (purple). (B) PSE shifts are plotted as a function of horizontal and vertical object location for each animal. Each datum represents a PSE shift from a single session. Circles and crosses denote two different amplitudes of self-motion that were tested. Lines show regression fits (see text for details). (C) Psychophysical thresholds are plotted as a function of horizontal and vertical object location. Symbol shape denotes self-motion amplitude, and symbol color denotes self-motion condition (blue: stationary; green: forward; red: backward).
Figure 7.
Figure 7.
Schematic of stimulus manipulations for simulating different object distances. (A) A top-down view of the stimulus. The far object was larger and farther away from the midline in world coordinates, relative to the near object. These changes kept the object's size and position constant in retinal coordinates. (B) Image view of the stimulus (background dots are not shown for clarity). The object's size, velocity, and position were kept constant in retinal coordinates such that binocular disparity was the only cue to depth.
Figure 8.
Figure 8.
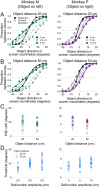
Dependence of direction discrimination performance on simulated distance. (A) Summary psychometric curves for Monkeys M (left, 9,350 trials) and P (right, 11,880 trials) for an object distance of 20 cm. Format as in Figure 4A and B. (B) Summary psychometric functions for the object distance of 50 cm. (C) PSE shifts are plotted as a function of object distance for each animal. Colors denote self-motion amplitude variations, as in Panels A and B. (D) Psychophysical thresholds are plotted as a function of self-motion amplitude. Lighter and darker colors denote near and far object distances, respectively.
Figure 9.
Figure 9.
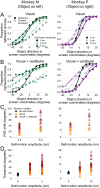
Adding vestibular self-motion cues to optic flow increases biases in perceived object direction. (A) Summary psychometric curves for Monkeys M (left, 15,730 trials) and P (right, 14,300 trials) when self-motion is indicated solely by optic flow. Format as in Figure 4A and B. (B) Summary psychometric curves for interleaved conditions in which self-motion is indicated by both optic flow and vestibular signals. Format as in Panel A. (C) PSE shifts are plotted as a function of self-motion amplitude. Each datum represents a PSE shift from a single session, and colors denote the modality of self-motion cues (orange: visual; red: visual + vestibular). (D) Psychophysical thresholds are plotted as a function of self-motion amplitude. Colors denote the self-motion condition (black: stationary; orange: visual; red: visual + vestibular).
Figure 10.
Figure 10.
Adding vestibular self-motion cues to optic flow increases flow-parsing gains. (A) Summary of flow-parsing gains for Monkey M. Symbol color denotes the modality of self-motion cues (orange: visual; red: visual + vestibular). Error bars indicate 95% confidence intervals. (B) Summary of flow-parsing gains for Monkey P. Format as in Panel A.
Figure 11.
Figure 11.
Flow-parsing gains decreased gradually over time. (A) Monkey M's flow-parsing gains over time. Horizontal reference lines at 0 and 1 indicate gains corresponding to no flow parsing (retinal coordinates) and complete flow parsing (world-centered coordinates), respectively. Colors indicate the experiment from which the flow-parsing gains resulted (red: Experiment 1, orange: Experiment 2, yellow: Experiment 3, green: Experiment 4). Additional flow-parsing gains were collected from training sessions (gray) and neural recordings (blue), to be described elsewhere. (B) Monkey P's flow-parsing gains over time. Colors and reference lines as in Panel A.
Figure 12.
Figure 12.
Reward paradigm may lead to decrease in flow-parsing gains over time. (A, B) Idealized psychometric functions corresponding to flow-parsing gains of 1.0 (A) and 0.7 (B). Shading indicates proportions of trials that are scored veridically as correct (green) or incorrect (red), as well as trials that are rewarded randomly (yellow; see Methods for details of reward regime). Psychometric curves for stationary (blue), forward (green), and backward (red) self-motion conditions are separated for clarity. The expected PSEs (assuming a flow-parsing gain of 1.0) for forward and backward self-motion are 10° and –10°, respectively. (A) Top row: When there is no self-motion, accuracy is determined by the proportion of trials in which the observer correctly indicates the object's motion in retinal (or screen) coordinates (green). Middle row: During forward self-motion, object directions between 0° and 10° are rewarded randomly, regardless of the subject's response (yellow). Bottom row: During backward self-motion, object directions between 0° and –10° are rewarded randomly (yellow). (B) When the flow-parsing gain is reduced to 0.7, the smaller PSE shifts lead to smaller areas in the forward and backward self-motion conditions that are marked as incorrect (red), resulting in an overall higher reward rate.

Similar articles

Cited by

References

    1. Albright T. D. (1989). Centrifugal directional bias in the middle temporal visual area (MT) of the macaque. Visual Neuroscience, 2(2), 177–188. - PubMed
    1. Albright T. D., Desimone R., & Gross C. G. (1984). Columnar organization of directionally selective cells in visual area MT of the macaque. Journal of Neurophysiology, 51(1), 16–31, doi:10.1152/jn.1984.51.1.16. - DOI - PubMed
    1. Benson A. J., Spencer M. B., & Stott J. R. (1986). Thresholds for the detection of the direction of whole-body, linear movement in the horizontal plane. Aviation, Space, and Environmental Medicine, 57(11), 1088–1096. - PubMed
    1. Bradley D. C., Maxwell M., Andersen R. A., Banks M. S., & Shenoy K. V. (1996). Mechanisms of heading perception in primate visual cortex. Science, 273(5281), 1544–1547. - PubMed
    1. Bremmer F., Kubischik M., Pekel M., Lappe M., & Hoffmann K. P. (1999). Linear vestibular self-motion signals in monkey medial superior temporal area. Annals of the New York Academy of Sciences, 871, 272–281, doi:10.1111/j.1749-6632.1999.tb09191.x. - DOI - PubMed

Publication types