. 2020 Oct 6;142(14):1374-1388.
doi: 10.1161/CIRCULATIONAHA.120.046528. Epub 2020 Oct 5.

Single-Cell Transcriptome Analysis Reveals Dynamic Cell Populations and Differential Gene Expression Patterns in Control and Aneurysmal Human Aortic Tissue

Affiliations

Single-Cell Transcriptome Analysis Reveals Dynamic Cell Populations and Differential Gene Expression Patterns in Control and Aneurysmal Human Aortic Tissue

Yanming Li et al. Circulation. .

Abstract

Background: Ascending thoracic aortic aneurysm (ATAA) is caused by the progressive weakening and dilatation of the aortic wall and can lead to aortic dissection, rupture, and other life-threatening complications. To improve our understanding of ATAA pathogenesis, we aimed to comprehensively characterize the cellular composition of the ascending aortic wall and to identify molecular alterations in each cell population of human ATAA tissues.

Methods: We performed single-cell RNA sequencing analysis of ascending aortic tissues from 11 study participants, including 8 patients with ATAA (4 women and 4 men) and 3 control subjects (2 women and 1 man). Cells extracted from aortic tissue were analyzed and categorized with single-cell RNA sequencing data to perform cluster identification. ATAA-related changes were then examined by comparing the proportions of each cell type and the gene expression profiles between ATAA and control tissues. We also examined which genes may be critical for ATAA by performing the integrative analysis of our single-cell RNA sequencing data with publicly available data from genome-wide association studies.

Results: We identified 11 major cell types in human ascending aortic tissue; the high-resolution reclustering of these cells further divided them into 40 subtypes. Multiple subtypes were observed for smooth muscle cells, macrophages, and T lymphocytes, suggesting that these cells have multiple functional populations in the aortic wall. In general, ATAA tissues had fewer nonimmune cells and more immune cells, especially T lymphocytes, than control tissues did. Differential gene expression data suggested the presence of extensive mitochondrial dysfunction in ATAA tissues. In addition, integrative analysis of our single-cell RNA sequencing data with public genome-wide association study data and promoter capture Hi-C data suggested that the erythroblast transformation-specific related gene(ERG) exerts an important role in maintaining normal aortic wall function.

Conclusions: Our study provides a comprehensive evaluation of the cellular composition of the ascending aortic wall and reveals how the gene expression landscape is altered in human ATAA tissue. The information from this study makes important contributions to our understanding of ATAA formation and progression.

Keywords: aortic aneurysm, thoracic; mitochondria; sequence analysis, RNA; transcriptional regulator ERG.


Conflict of interest statement

Disclosures

The authors report no conflicts of interest. Dr. LeMaire serves as a consultant for Terumo Aortic and Baxter Healthcare; serves as a principal investigator for clinical studies sponsored by Terumo Aortic and CytoSorbants; and serves as a co-investigator for clinical studies sponsored by W.L. Gore & Associates.

Figures
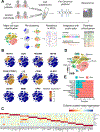
Figure 1.
Figure 1.. Eleven major cell types identified with sc-RNAseq analysis of human ascending aortic tissues.
A, Experimental approach and data analysis strategy. B, Relative expression of several marker genes in all cells from all samples. Cells were projected onto a t-SNE plot. C, The mean expression of selected genes in the major cell types. D, A t-SNE plot showing all cells colored according to the 11 major cell types. E, The composition of each cell type is shown in the horizontal bar plot. The dashed black line represents the expected proportion of cells from the control group (the total number of control cells divided by the total number of cells from all specimens). ATAA indicates ascending thoracic aortic aneurysm; GWAS, genome-wide association studies; MSC, mesenchymal stem cell; SMC, smooth muscle cell; EC, endothelial cell; MonoMaphDC, monocyte/macrophage/dendritic cell; NK, natural killer cell.
Figure 2.
Figure 2.. Heterogeneity of nonimmune cells in human ascending thoracic aortic wall.
A, A t-SNE plot of non-immune cells colored according to identified clusters. B, Relative expression of several marker genes in nonimmune cells projected onto a t-SNE plot. C, Mean expression of select genes in nonimmune cell clusters. D, Module scores of 8 features (or functions) in nonimmune cell clusters. E, Cell-cell junction scores between nonimmune cell clusters and cell-ECM scores between nonimmune cell clusters and ECM. SMC indicates smooth muscle cell; MSC, mesenchymal stem cell; EC, endothelial cell; MHC, major histocompatibility complex.
Figure 3.
Figure 3.. Heterogeneity of immune cells in human ascending aortic tissue.
A, Mean expression of selected genes in monocyte, DC, and macrophage clusters. B, A t-SNE plot of all macrophage-like cells colored according to cluster. C, Relative expression of IL1B and CD163 in macrophage-like cells projected onto a t-SNE plot. D, Mean expression of M1 macrophage and M2 macrophage marker genes in macrophage clusters. E, Mean expression of cytokine, proteinase, and MHC genes across macrophage-like cell clusters. Expression values were row scaled and shown by color. Genes with a special expression pattern are shown in a dashed-line box. F, Mean expression of selected genes in T lymphocyte cluster. G, A t-SNE plot of all T lymphocytes colored according to CD4 and CD8 expression. H, A t-SNE plot of all T lymphocytes colored according to cluster. I, Mean expression of cytokine genes in T lymphocyte cluster. Genes with a special expression pattern are shown in a dashed-line box. DC indicates dendritic cell; MHC, major histocompatibility complex.
Figure 4.
Figure 4.. Molecular and cellular alterations in ATAA.
A, Comparison between ATAA and control tissues according to cluster. The x-axis of the left panel represents DEG counts between the ATAA and control groups. Downregulated genes are shown in blue, and upregulated genes are shown in red. The x-axis of the right panel represents the log2-transformed proportion change. The red bar (value > 0) represents the proportion of the cell population increased in ATAA tissues, and the blue bar (value < 0) represents the proportion of the cell population decreased in ATAA tissues. Cell clusters are shown in the y-axis. B, Results of GSEA using a hallmark gene set shows enriched DEGs. C, Fold change of OXPHOS gene expression (ATAA/control) according to cell cluster. OXPHOS genes were separated according to whether they were chromatin or mitochondrial. Clusters with their names highlighted in a bold black box represent significantly increased chromatin OXPHOS genes and significantly decreased mitochondrial OXPHOS genes in ATAA tissues. D, Fold change in cytokine gene expression (ATAA/control) according to cell cluster. ATAA indicates ascending thoracic aortic aneurysm; DEG, differentially expressed gene; GSEA, gene set enrichment analysis; NES, normalized enrichment score; OXPHOS, oxidative phosphorylation.
Figure 5.
Figure 5.. Potential role for ERG in SMCs, endothelial cells, and fibroblasts in protecting against aortic aneurysm formation.
A, GSEA position analysis of DEGs. B, Distance from chromatin-enriched DEGs (red line) or randomized genes (grey lines) to aneurysm-associated SNPs. C, DEGs that were identified as the targets of aneurysm-associated SNPs according to cell cluster. D, Expression of ERG in control and ATAA tissues in nonimmune cell clusters. E, Potential targets of ERG in EC1. Top, the number of genes identified as potential targets of ERG in EC1. Bottom, the fold-change (ATAA/control) and enriched functions of select potential targets. F, Fold-change (ATAA/control) of potential targets of ERG in Fibroblast1. G, Fold-change (ATAA/control) of potential targets of ERG in Proliferating SMC2. GSEA stands for gene set enrichment analysis; NES, normalized enrichment score; SNPs, single nucleotide polymorphisms; MT, mitochondria; chr, chromatin; DEGs, differentially expressed genes; GWAS, genome-wide association studies; logFC, log10 transformed fold change.

References

    1. Lavall D, Schafers HJ, Bohm M, Laufs U. Aneurysms of the ascending aorta. Dtsch Arztebl Int. 2012;109:227–233. - PMC - PubMed
    1. Goldfinger JZ, Halperin JL, Marin ML, Stewart AS, Eagle KA, Fuster V. Thoracic aortic aneurysm and dissection. J Am Coll Cardiol. 2014;64:1725–1739. - PubMed
    1. Shen YH, LeMaire SA. Molecular pathogenesis of genetic and sporadic aortic aneurysms and dissections. Curr Probl Surg. 2017;54:95–155. - PMC - PubMed
    1. Kolodziejczyk AA, Kim JK, Svensson V, Marioni JC, Teichmann SA. The technology and biology of single-cell RNA sequencing. Mol Cell. 2015;58:610–620. - PubMed
    1. Zappia L, Phipson B, Oshlack A. Exploring the single-cell RNA-seq analysis landscape with the scRNA-tools database. PLoS Comput Biol. 2018;14:e1006245. - PMC - PubMed

Publication types