. 2020 Dec 1;319(6):E1084-E1100.
doi: 10.1152/ajpendo.00448.2020. Epub 2020 Oct 5.

Loss of CTRP4 alters adiposity and food intake behaviors in obese mice

Affiliations

Loss of CTRP4 alters adiposity and food intake behaviors in obese mice

Dylan C Sarver et al. Am J Physiol Endocrinol Metab. .

Abstract

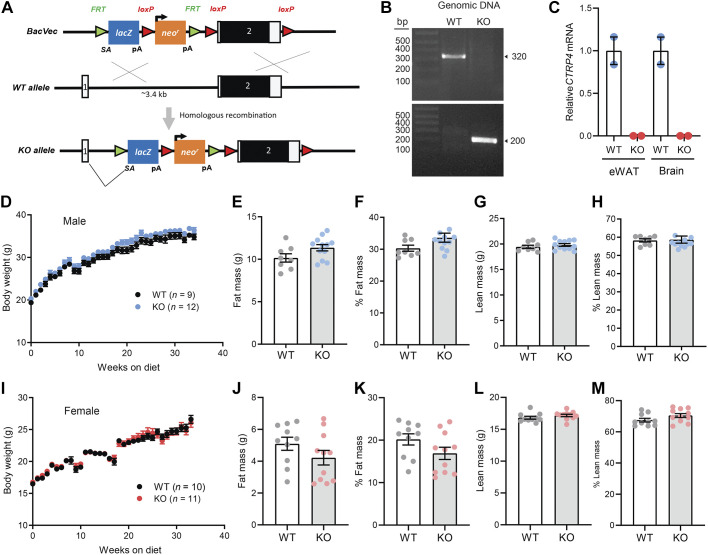
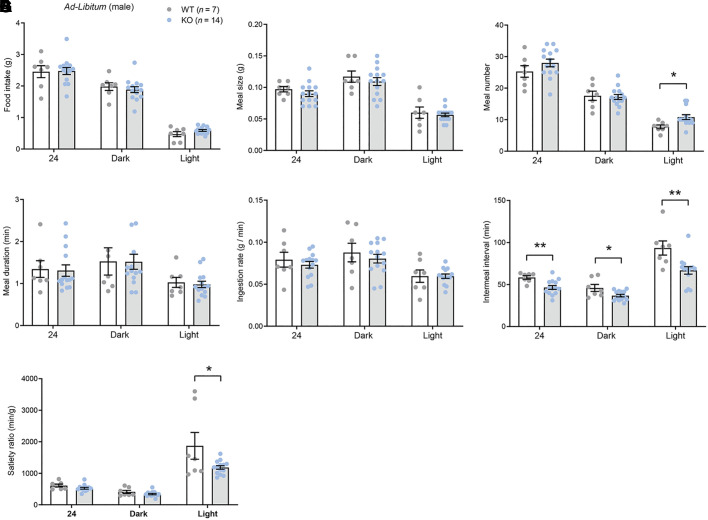
Central and peripheral mechanisms are both required for proper control of energy homeostasis. Among circulating plasma proteins, C1q/TNF-related proteins (CTRPs) have recently emerged as important regulators of sugar and fat metabolism. CTRP4, expressed in brain and adipose tissue, is unique among the family members in having two tandem globular C1q domains. We previously showed that central administration of recombinant CTRP4 suppresses food intake, suggesting a central nervous system role in regulating ingestive physiology. Whether this effect is pharmacological or physiological remains unclear. We used a loss-of-function knockout (KO) mouse model to clarify the physiological role of CTRP4. Under basal conditions, CTRP4 deficiency increased serum cholesterol levels and impaired glucose tolerance in male but not female mice fed a control low-fat diet. When challenged with a high-fat diet, male and female KO mice responded differently to weight gain and had different food intake patterns. On an obesogenic diet, male KO mice had similar weight gain as wild-type littermates. When fed ad libitum, KO male mice had greater meal number, shorter intermeal interval, and reduced satiety ratio. Female KO mice, in contrast, had lower body weight and adiposity. In the refeeding period following food deprivation, female KO mice had significantly higher food intake due to longer meal duration and reduced satiety ratio. Collectively, our data provide genetic evidence for a sex-dependent physiological role of CTRP4 in modulating food intake patterns and systemic energy metabolism.

Keywords: C1QTNF4; CTRP4; fasting refeeding; food intake; ingestive physiology; secreted hormone.


Figures

None
Graphical abstract
Fig. 1.
Fig. 1.
Body weights and composition of C1q/TNF-related protein-4 (Ctrp4) knockout (KO) and wild-type (WT) mice fed a control low-fat diet (LFD). A: schematic of gene targeting strategy to generate Ctrp4 KO mice. A LacZ reporter with a splice site acceptor was inserted upstream of exon 2. FRT, flippase recognition target; LacZ, β-galactosidase; LoxP, sequence recognized by Cre recombinase; Neo, neomycin-resistant cassette. B: PCR-based genotyping of Ctrp4 KO and WT alleles. C: quantitative real-time PCR analysis of Ctrp4 mRNA expression in epididymal white adipose tissue (eWAT) and brain of WT and KO male mice (n = 2). D: body weights of Ctrp4 KO and WT male mice fed an LFD starting at 5 wk of age (WT, n = 9; KO, n = 12). E–H: body composition analysis of fat mass (E), %fat mass (relative to body weight; F), lean mass (G), and %lean mass (relative to body weight; H) of Ctrp4 KO and WT male mice fed an LFD at 38 wk of age (WT, n = 9; KO, n = 12). I: body weights of Ctrp4 KO and WT female mice fed an LFD starting at 5 wk of age (WT, n = 10; KO, n = 11). J–M: body composition analysis of fat mass (J), %fat mass (relative to body weight; K), lean mass (L), and %lean mass (relative to body weight; M) of Ctrp4 KO and WT female mice fed an LFD at 37 wk of age (WT, n = 10; KO, n = 11).
Fig. 2.
Fig. 2.
C1q/TNF-related protein-4 (Ctrp4) knockout (KO) male, but not female, mice fed a control low-fat diet (LFD) develop mild insulin resistance and glucose intolerance. A–F: overnight-fasted body weight (A), blood glucose (B), serum triglyceride (TG; C), serum cholesterol (D), serum nonesterified free fatty acids (NEFA; E), and serum β-hydroxybutyrate (F) of LFD-fed wild-type (WT; n = 9) and KO (n = 12) male mice at 14 wk of age (9 wk on LFD). G–L: overnight-fasted body weight (G), blood glucose (H), serum triglyceride (I), serum cholesterol (J), serum NEFA (K), and serum β-hydroxybutyrate (L) of LFD-fed WT (n = 10) and KO (n = 12) female mice at 14 wk of age (9 wk on LFD). M: fasting serum insulin levels of WT (n = 9) and KO (n = 12) male mice. N: blood glucose levels over time of WT (n = 9) and KO (n = 12) male mice in response to glucose tolerance tests (GTT). Mice were fed LFD for 14 wk. *P < 0.05 (2-way ANOVA). O: quantification of area under curve as shown in N. ***P < 0.001 (2-tailed Student’s t tests). P: fasting serum insulin levels of WT (n = 5) and KO (n = 8) female mice. Q: blood glucose levels over time of WT (n = 10) and KO (n = 12) female mice (on LFD for 14 wk) in response to GTT. R: blood glucose levels of WT (n = 9) and KO (n = 12) male mice (on LFD for 15 wk) in response to insulin tolerance test (ITT). S: blood glucose levels of WT (n = 10) and KO (n = 11) female mice (on LFD for 15 wk) in response to ITT.
Fig. 3.
Fig. 3.
C1q/TNF-related protein-4 (CTRP4) deficiency does not affect metabolic phenotypes in male mice fed a high-fat diet (HFD). A: body weights over time of Ctrp4 knockout (KO) and wild-type (WT) male mice fed an HFD starting at 6 wk of age (WT, n = 9; KO, n = 15). B: total weight gained for WT and KO male mice after 14 wk on HFD. C–F: body composition analysis of fat mass (C), %fat mass (relative to body weight; D), lean mass (E), and %lean mass (relative to body weight; F) of Ctrp4 KO and WT male mice fed HFD (WT, n = 9; KO, n = 15). G–L: overnight-fasted blood glucose (G), serum triglyceride (TG; H), serum cholesterol (I), serum nonesterified free fatty acids (NEFA; J), serum β-hydroxybutyrate (K), and serum insulin (L) of HFD-fed WT (n = 9) and KO (n = 15) male mice. M and N: blood glucose levels over time of WT (n = 9) and KO (n = 15) male mice in response to glucose tolerance tests (GTT; M) and insulin tolerance tests (ITT; N). Mice were fed HFD for 15 wk.
Fig. 4.
Fig. 4.
Loss of C1q/TNF-related protein-4 (CTRP4) reduces body weight and adiposity in female mice fed a high-fat diet (HFD). A: body weights over time of Ctrp4 knockout (KO) and wild-type (WT) female mice fed an HFD starting at 6 wk of age (WT, n = 10; KO, n = 15). B: total weight gained for WT and KO female mice after 13 wk on HFD. C–F: body composition analysis of fat mass (C), %fat mass (relative to body weight; D), lean mass (E), and %lean mass (relative to body weight; F) of HFD-fed Ctrp4 KO and WT female mice (WT, n = 10; KO, n = 15). G–K: overnight-fasted blood glucose (G), serum triglyceride (TG; H), serum cholesterol (I), serum nonesterified free fatty acids (NEFA; J), serum β-hydroxybutyrate (K), and serum insulin (L) of HFD-fed WT (n = 10) and KO (n = 15) female mice. M and N: blood glucose levels over time of WT (n = 10) and KO (n = 15) female mice in response to glucose tolerance tests (GTT; M) and insulin tolerance tests (ITT; N). Mice were fed HFD for 14 wk. * P < 0.05 (2-tailed Student’s t test).
Fig. 5.
Fig. 5.
Impact of C1q/TNF-related protein-4 (CTRP4) deficiency on adipocyte cell size, serum adipokine levels, and hepatic lipid contents of male and female mice fed a high-fat diet (HFD). A and B: quantification of adipocyte cell size in gonadal white adipose tissue (gWAT) and inguinal white adipose tissue (iWAT) of wild-type (WT; n = 8–9) and knockout (KO; n = 15) male mice (A) and WT (n = 10) and KO (n = 14–15) female mice (B). C and D: serum adiponectin and leptin levels of WT (n = 9) and KO (n = 15) male mice (C) and WT (n = 10) and KO (n = 15) female mice (D). E and F: hepatic triglyceride levels in WT (n = 9) and KO (n = 15) male mice (E) and WT (n = 10) and KO (n = 15) female mice (F).
Fig. 6.
Fig. 6.
C1q/TNF-related protein-4 (CTRP4)-deficient male mice fed ad libitum have greater meal number, shorter intermeal interval and reduced satiety ratio. A–F: food intake (A), meal size (B), meal number (C), meal duration (D), ingestion rate (E), intermeal interval (F), and satiety ratio (G) over a 24-h period or during the light or dark cycle for wild-type (WT; = 7) and knockout (KO; = 14) male mice fed ad libitum. H: food intake of WT (n = 7) and KO (n = 14) male mice during the first 4 h of refeeding after an overnight fast. I–O: food intake (I), meal size (J), meal number (K), meal duration (L), ingestion rate (M), intermeal interval (N), and satiety ratio (O) of WT (n = 7) and KO (n = 14) male mice over a 24-h period or during the light or dark cycle of refeeding following an overnight fast. *P < 0.05, **P < 0.01 (2-tailed Student’s t test).
Fig. 6.
Fig. 6.
C1q/TNF-related protein-4 (CTRP4)-deficient male mice fed ad libitum have greater meal number, shorter intermeal interval and reduced satiety ratio. A–F: food intake (A), meal size (B), meal number (C), meal duration (D), ingestion rate (E), intermeal interval (F), and satiety ratio (G) over a 24-h period or during the light or dark cycle for wild-type (WT; = 7) and knockout (KO; = 14) male mice fed ad libitum. H: food intake of WT (n = 7) and KO (n = 14) male mice during the first 4 h of refeeding after an overnight fast. I–O: food intake (I), meal size (J), meal number (K), meal duration (L), ingestion rate (M), intermeal interval (N), and satiety ratio (O) of WT (n = 7) and KO (n = 14) male mice over a 24-h period or during the light or dark cycle of refeeding following an overnight fast. *P < 0.05, **P < 0.01 (2-tailed Student’s t test).
Fig. 7.
Fig. 7.
Female mice lacking C1q/TNF-related protein-4 (CTRP4) have increased food intake, greater meal duration, and reduced satiety ratio in response to fasting and refeeding. A–F: food intake (A), meal size (B), meal number (C), meal duration (D), ingestion rate (E), intermeal interval (F), and satiety ratio (G) over a 24-h period or during the light or dark cycle for wild-type (WT; = 10) and knockout (KO; = 12) female mice fed ad libitum. H: food intake of WT (n = 10) and KO (n = 12) female mice during the first 4 h of refeeding after an overnight fast. I–O: food intake (I), meal size (J), meal number (K), meal duration (L), ingestion rate (M), intermeal interval (N), and satiety ratio (O) of WT (n = 10) and KO (n = 12) female mice over a 24-h period or during the light or dark cycle of refeeding following an overnight fast. *P < 0.05 (2-tailed Student's t test).
Fig. 7.
Fig. 7.
Female mice lacking C1q/TNF-related protein-4 (CTRP4) have increased food intake, greater meal duration, and reduced satiety ratio in response to fasting and refeeding. A–F: food intake (A), meal size (B), meal number (C), meal duration (D), ingestion rate (E), intermeal interval (F), and satiety ratio (G) over a 24-h period or during the light or dark cycle for wild-type (WT; = 10) and knockout (KO; = 12) female mice fed ad libitum. H: food intake of WT (n = 10) and KO (n = 12) female mice during the first 4 h of refeeding after an overnight fast. I–O: food intake (I), meal size (J), meal number (K), meal duration (L), ingestion rate (M), intermeal interval (N), and satiety ratio (O) of WT (n = 10) and KO (n = 12) female mice over a 24-h period or during the light or dark cycle of refeeding following an overnight fast. *P < 0.05 (2-tailed Student's t test).

References

    1. Andermann ML, Lowell BB. Toward a wiring diagram understanding of appetite control. Neuron 95: 757–778, 2017. doi: 10.1016/j.neuron.2017.06.014. - DOI - PMC - PubMed
    1. Asilmaz E, Cohen P, Miyazaki M, Dobrzyn P, Ueki K, Fayzikhodjaeva G, Soukas AA, Kahn CR, Ntambi JM, Socci ND, Friedman JM. Site and mechanism of leptin action in a rodent form of congenital lipodystrophy. J Clin Invest 113: 414–424, 2004. doi: 10.1172/JCI200419511. - DOI - PMC - PubMed
    1. Babapour Mofrad R, van der Flier WM. Nature and implications of sex differences in AD pathology. Nat Rev Neurol 15: 6–8, 2019. doi: 10.1038/s41582-018-0115-7. - DOI - PubMed
    1. Berthoud HR, Sutton GM, Townsend RL, Patterson LM, Zheng H. Brainstem mechanisms integrating gut-derived satiety signals and descending forebrain information in the control of meal size. Physiol Behav 89: 517–524, 2006. doi: 10.1016/j.physbeh.2006.08.018. - DOI - PubMed
    1. Blevins JE, Schwartz MW, Baskin DG. Evidence that paraventricular nucleus oxytocin neurons link hypothalamic leptin action to caudal brain stem nuclei controlling meal size. Am J Physiol Regul Integr Comp Physiol 287: R87–R96, 2004. doi: 10.1152/ajpregu.00604.2003. - DOI - PubMed

Publication types

MeSH terms

LinkOut - more resources