Review
. 2021 Jan 1:347:108951.
doi: 10.1016/j.jneumeth.2020.108951. Epub 2020 Oct 2.

The sensitivity of diffusion MRI to microstructural properties and experimental factors

Affiliations
Review

The sensitivity of diffusion MRI to microstructural properties and experimental factors

Maryam Afzali et al. J Neurosci Methods. .

Abstract

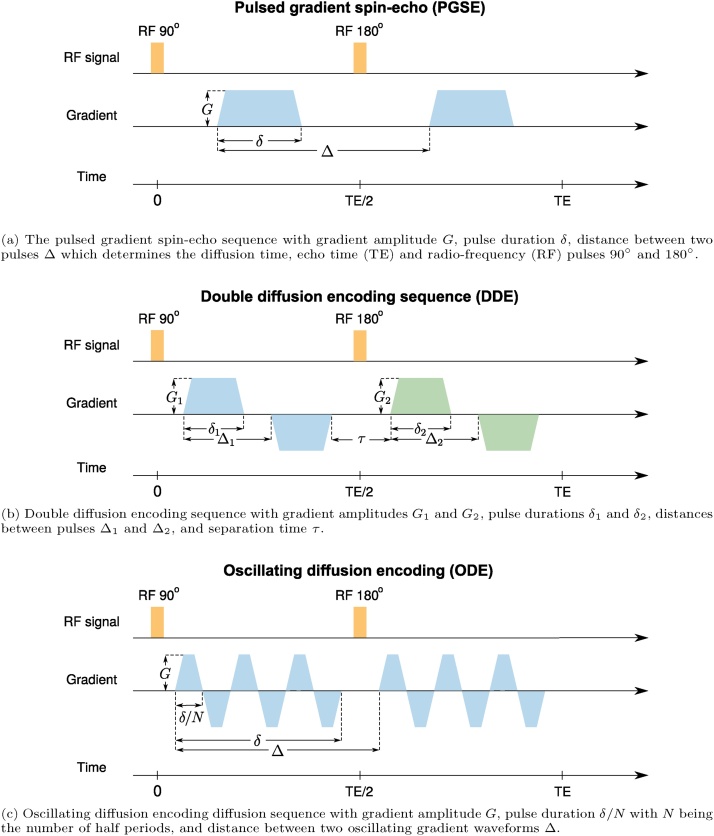
Diffusion MRI is a non-invasive technique to study brain microstructure. Differences in the microstructural properties of tissue, including size and anisotropy, can be represented in the signal if the appropriate method of acquisition is used. However, to depict the underlying properties, special care must be taken when designing the acquisition protocol as any changes in the procedure might impact on quantitative measurements. This work reviews state-of-the-art methods for studying brain microstructure using diffusion MRI and their sensitivity to microstructural differences and various experimental factors. Microstructural properties of the tissue at a micrometer scale can be linked to the diffusion signal at a millimeter-scale using modeling. In this paper, we first give an introduction to diffusion MRI and different encoding schemes. Then, signal representation-based methods and multi-compartment models are explained briefly. The sensitivity of the diffusion MRI signal to the microstructural components and the effects of curvedness of axonal trajectories on the diffusion signal are reviewed. Factors that impact on the quality (accuracy and precision) of derived metrics are then reviewed, including the impact of random noise, and variations in the acquisition parameters (i.e., number of sampled signals, b-value and number of acquisition shells). Finally, yet importantly, typical approaches to deal with experimental factors are depicted, including unbiased measures and harmonization. We conclude the review with some future directions and recommendations on this topic.

Keywords: Anisotropy; Biophysical model; Diffusion MRI; Experimental factors; Microstructure; Signal representation.


Figures

Fig. 1
Fig. 1
Diffusion acqusition schemes: (a) pulsed gradient spin-echo (PGSE), double diffusion encoding sequence (DDE) and oscillating diffusion encoding (ODE). For more details about diffusion MRI sequences see Table 1 and Section 3.
Fig. 2
Fig. 2
The free gradient waveforms g(t)=gx(t),gy(t),gz(t)T of the linear, planar, and spherical tensor encoding. For more details about the gradient waveforms see Section 3.
Fig. 3
Fig. 3
MAP-MRI indices of an HCP WuMinn data with b = 1000 , 2000, , and 3000 s/mm2. RTOP – return-to-the-origin probability, RTAP – return-to-the-axis probability, RTPP – return-to-the-plane probability, NG – non-Gaussianity.
Fig. 4
Fig. 4
Comparison of quantitative measures derived from DT-MRI and confinement models when applied to the signal from the whole voxel (see Section 4.2). For the new model, the direction-encoded color map was computed by color-coding the direction of the eigenvector of the stiffness tensor associated with its smallest eigenvalue. In the color-coded map, red, green, and blue represent fibers running along the right-left, anterior-posterior, and superior-inferior axes, respectively.
Fig. 5
Fig. 5
Estimated fractional anisotropy, and the results of power-law fit (S/S(0) = βbα) to the brain image.
Fig. 6
Fig. 6
The functional dependence of the variance of Rician and non-central chi (nc-χ) distributed random variables M in terms of noise-free amplitude signal AT. Variance of nc-χ random variable additionally depends on the number of receiver coils L and underlying noise standard deviation which is fixed to σ = 1 in all cases. The symbol 1F1 indicates the confluent hypergeometric function of the first kind while Γ is the gamma function.
Fig. 7
Fig. 7
HCP diffusion-weighted brain data for (a) b = 1000 s/mm2, (b) b = 3000 s/mm2, (c) b = 5000 s/mm2 and (d) b = 10, 000 s/mm2 (top row), and corresponding local signal-to-noise ratio (SNR) obtained with the non-stationary unbiased non-local means filter (Pieciak et al., 2018) and the variance-stabilizing approach (Pieciak et al., 2017). For the sake of visualization, the diffusion-weighted signal has been normalized with baseline signal S(0) and the colorbars rescaled to [0–0.8] for all b-values.
Fig. 8
Fig. 8
Comparison of RTOP and RTAP measures derived from the MAPL framework (Fick et al., 2016) under different maximal b-value parameter. The RTOP measures have been scaled to the power of 1/3 while the RTAP to the power of 1/2.
Fig. 9
Fig. 9
Comparison of DT-MRI-based mean diffusivity to the average sample diffusion measure (ASD) and fractional anisotropy to the diffusion coefficient of variation (CVD) all obtained from 30 diffusion-sensitizing gradient directions and b = 1000 s/mm2. The ASD and CVD measures were derived directly from the q-space data representation. The Pearson correlation coefficients equal 0.99988 and 0.97501 for diffusivity and anisotropy measures, respectively.

References

    1. Abe O., Aoki S., Hayashi N., Yamada H., Kunimatsu A., Mori H., Yoshikawa T., Okubo T., Ohtomo K. Normal aging in the central nervous system: quantitative MR diffusion-tensor analysis. Neurobiol. Aging. 2002;23(3):433–441. - PubMed
    1. Aboitiz F., Scheibel A.B., Fisher R.S., Zaidel E. Fiber composition of the human corpus callosum. Brain Res. 1992;598(1–2):143–153. - PubMed
    1. Afzali M., Aja-Fernández S., Jones D.K. Direction-averaged diffusion-weighted MRI signal using different axisymmetric b-tensor encoding schemes. Magn. Reson. Med. 2020 - PMC - PubMed
    1. Afzali M., Soltanian-Zadeh H., Elisevich K.V. Tract based spatial statistical analysis and voxel based morphometry of diffusion indices in temporal lobe epilepsy. Comput. Biol. Med. 2011;41(12):1082–1091. - PubMed
    1. Afzali M., Yolcu C., Özarslan E. Characterizing diffusion anisotropy for molecules under the influence of a parabolic potential: a plausible alternative to DTI. Proc. Intl. Soc. Mag. Reson. Med., vol. 23. 2015:2795.

Publication types