

Effects of Resistance Training and Bowdichia virgilioides Hydroethanolic Extract on Oxidative Stress Markers in Rats Submitted to Peripheral Nerve Injury
- PMID: 33019503
- PMCID: PMC7601135
- DOI: 10.3390/antiox9100941
Effects of Resistance Training and Bowdichia virgilioides Hydroethanolic Extract on Oxidative Stress Markers in Rats Submitted to Peripheral Nerve Injury
Abstract
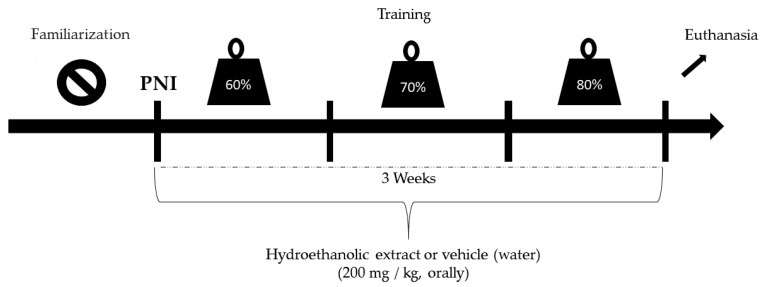
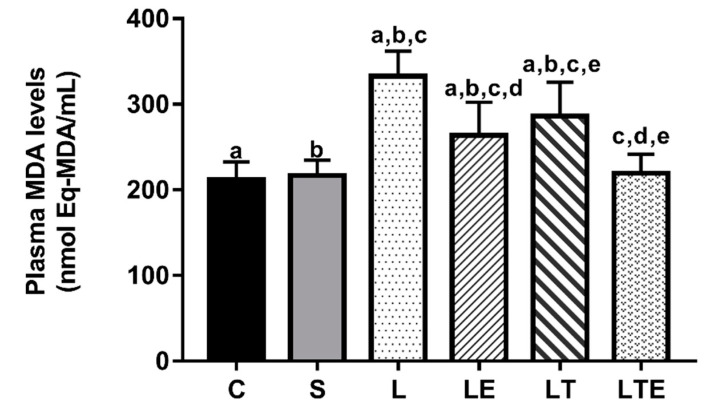
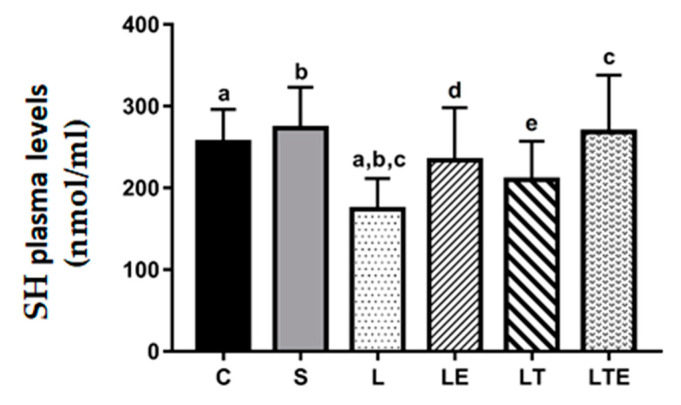
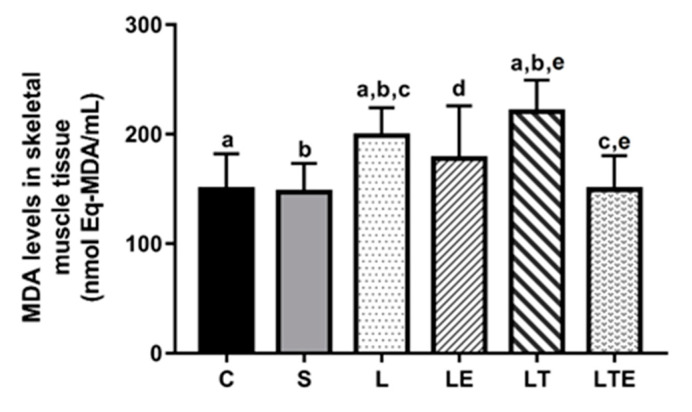
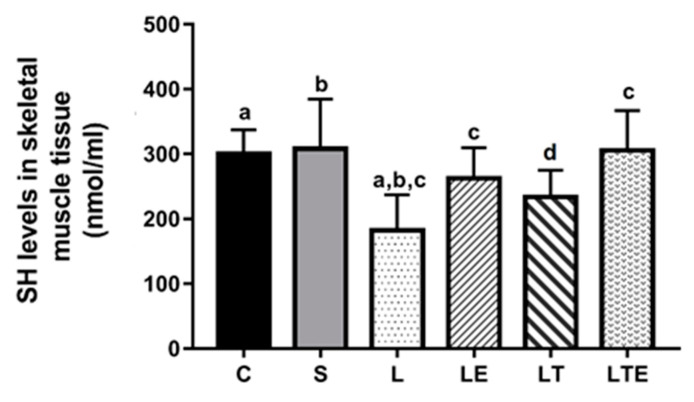
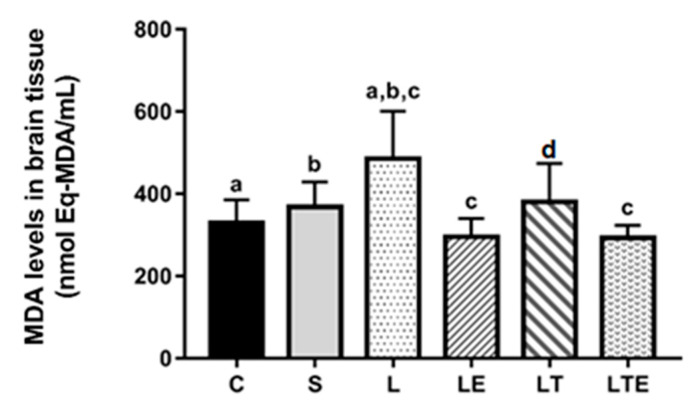
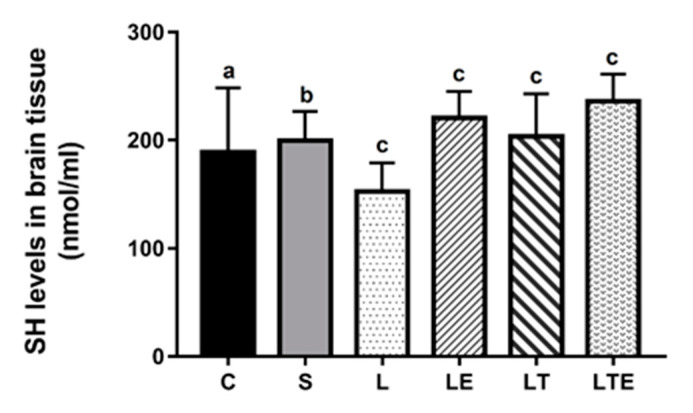
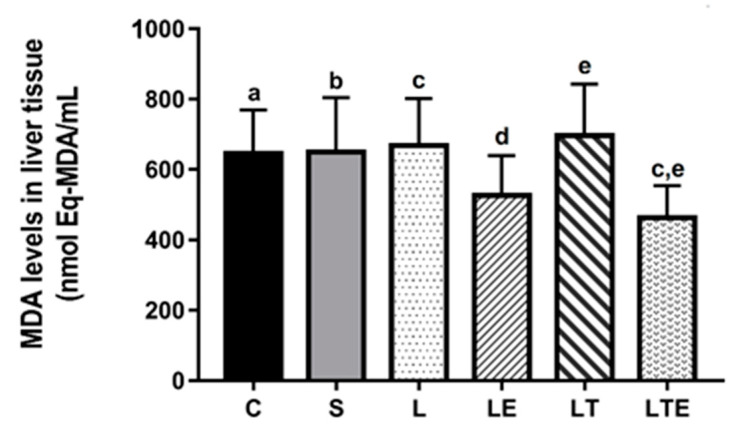
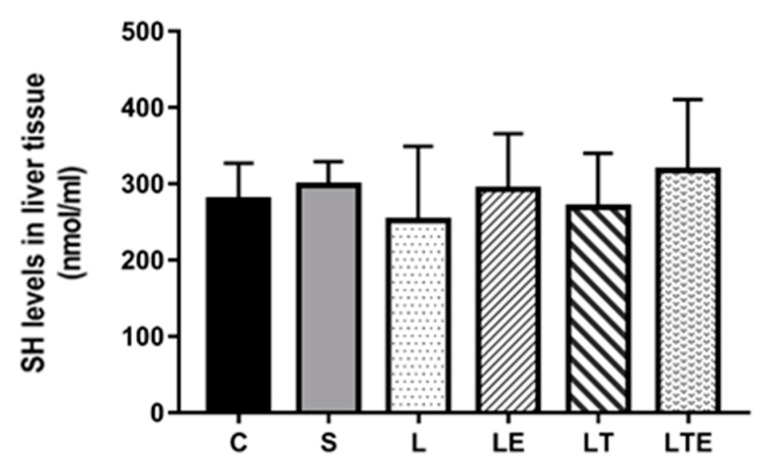
The objective of this study was to analyze the effects of the combination of resistance training (RT) and the hydroethanolic extract (EHE) of Bowdichia virgilioides as markers of oxidative stress (OS) in rats with peripheral nerve injury (PNI). Rats were allocated into six groups (n = 10): animals without interventions (C), animals with an exposed nerve but without injury, injured animals, trained and injured animals, injured animals that received EHE, and animals that received a combination of RT and EHE. RT comprised the climbing of stairs. EHE was orally administered (200 mg/kg) for 21 days after PNI induction. RT reduced the amount of lipoperoxidation in plasma (14.11%). EHE reduced lipoperoxidation in the plasma (20.72%) and the brain (41.36). RT associated with the extract simultaneously reduced lipoperoxidation in the plasma (34.23%), muscle (25.13%), and brain (43.98%). There was an increase in total sulhydrilyl levels (a) in the brain (33.33%) via RT; (b) in the brain (44.44%) and muscle (44.51%) using EHE; and (c) in the plasma (54.02%), brain (54.25%), and muscle using the combination of RT + EHE. These results suggest that RT associated with oral EHE results in a decrease in OS.
Keywords: oxidative stress; peripheral nerve injury; resistance training; skeletal muscle.
Conflict of interest statement
The authors declare no conflict of interest.
Figures
Similar articles
-
Protective effect of a hydroethanolic extract from Bowdichia virgilioides on muscular damage and oxidative stress caused by strenuous resistance training in rats.J Int Soc Sports Nutr. 2014 Dec 24;11(1):58. doi: 10.1186/s12970-014-0058-3. eCollection 2014. J Int Soc Sports Nutr. 2014. PMID: 25649187 Free PMC article.
-
Acute and subchronic antihyperglycemic activities of Bowdichia virgilioides roots in non-diabetic and diabetic rats.J Intercult Ethnopharmacol. 2015 Jan-Mar;4(1):57-63. doi: 10.5455/jice.20141028022407. Epub 2014 Nov 28. J Intercult Ethnopharmacol. 2015. PMID: 26401386 Free PMC article.
-
Antinociceptive activity of aqueous extract of Bowdichia virgilioides in mice.J Med Food. 2010 Apr;13(2):348-51. doi: 10.1089/jmf.2009.0099. J Med Food. 2010. PMID: 20170383
-
Photobiomodulation in Neuroscience: A Summary of Personal Experience.Photomed Laser Surg. 2017 Nov;35(11):604-615. doi: 10.1089/pho.2017.4381. Photomed Laser Surg. 2017. PMID: 29099679 Review.
-
[The Pharmacological Actions of Ephedrine Alkaloids-free Ephreda Herb Extract and Preparation for Clinical Application].Yakugaku Zasshi. 2017;137(2):179-186. doi: 10.1248/yakushi.16-00233-4. Yakugaku Zasshi. 2017. PMID: 28154329 Review. Japanese.
Cited by
-
Antioxidant Therapy in Oxidative Stress-Induced Neurodegenerative Diseases: Role of Nanoparticle-Based Drug Delivery Systems in Clinical Translation.Antioxidants (Basel). 2022 Feb 17;11(2):408. doi: 10.3390/antiox11020408. Antioxidants (Basel). 2022. PMID: 35204290 Free PMC article. Review.
-
Single-cell transcriptomic analysis identifies a stress response Schwann cell subtype.Open Med (Wars). 2025 May 21;20(1):20251186. doi: 10.1515/med-2025-1186. eCollection 2025. Open Med (Wars). 2025. PMID: 40417312 Free PMC article.
References
-
- Wang E., Inaba K., Byerly S., Escamilla D., Cho J., Carey J., Stevanovic M., Ghiassi A., Demetriades D. Optimal timing for repair of peripheral nerve injuries. J. Trauma Acute Care Surg. 2017;83:875–881. - PubMed
-
- Saadat S., Eslami V., Rahimi-Movaghar V. The incidence of peripheral nerve injury in trauma patients in Iran. Turk. J. Trauma Emerg. Surg. 2011;17:539–544. - PubMed
-
- Kouyoumdjian J.A., Graça C.R., Ferreira V.F.M. Peripheral nerve injuries: A retrospective survey of 1124 cases. Neurol. India. 2017;65:551–555. - PubMed
LinkOut - more resources
Full Text Sources
