. 2020 Oct 1;10(10):1400.
doi: 10.3390/biom10101400.

Comparison of Effects of Metformin, Phenformin, and Inhibitors of Mitochondrial Complex I on Mitochondrial Permeability Transition and Ischemic Brain Injury

Affiliations

Comparison of Effects of Metformin, Phenformin, and Inhibitors of Mitochondrial Complex I on Mitochondrial Permeability Transition and Ischemic Brain Injury

Kristina Skemiene et al. Biomolecules. .

Abstract

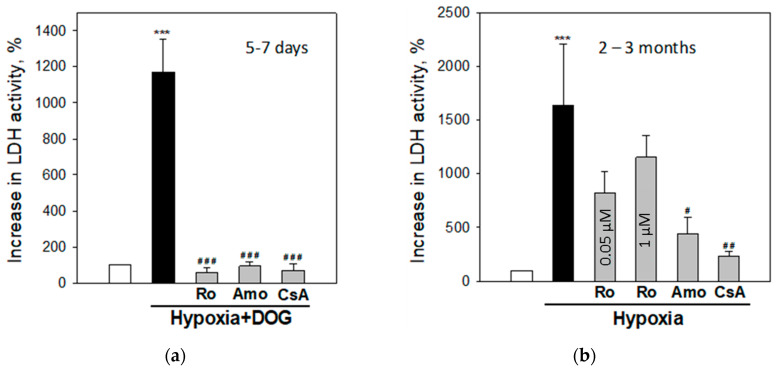
Damage to cerebral mitochondria, particularly opening of mitochondrial permeability transition pore (MPTP), is a key mechanism of ischemic brain injury, therefore, modulation of MPTP may be a potential target for a neuroprotective strategy in ischemic brain pathologies. The aim of this study was to investigate whether biguanides-metformin and phenformin as well as other inhibitors of Complex I of the mitochondrial electron transfer system may protect against ischemia-induced cell death in brain slice cultures by suppressing MPTP, and whether the effects of these inhibitors depend on the age of animals. Experiments were performed on brain slice cultures prepared from 5-7-day (premature) and 2-3-month old (adult) rat brains. In premature brain slice cultures, simulated ischemia (hypoxia plus deoxyglucose) induced necrosis whereas in adult rat brain slice cultures necrosis was induced by hypoxia alone and was suppressed by deoxyglucose. Phenformin prevented necrosis induced by simulated ischemia in premature and hypoxia-induced-in adult brain slices, whereas metformin was protective in adult brain slices cultures. In premature brain slices, necrosis was also prevented by Complex I inhibitors rotenone and amobarbital and by MPTP inhibitor cyclosporine A. The latter two inhibitors were protective in adult brain slices as well. Short-term exposure of cultured neurons to phenformin, metformin and rotenone prevented ionomycin-induced MPTP opening in intact cells. The data suggest that, depending on the age, phenformin and metformin may protect the brain against ischemic damage possibly by suppressing MPTP via inhibition of mitochondrial Complex I.

Keywords: brain ischemia; hypoxia; metformin; mitochondrial complex I; permeability transition; phenformin.


Conflict of interest statement

The authors declare no conflict of interest.

Figures

Figure 1
Figure 1
Effect of phenformin (a) and metformin (b) on neuronal viability in cerebellar granule cells (CGC) cultures. CGC were treated with phenformin and metformin at indicated concentrations. White column—viable neurons (%), black—necrosis (%), grey—apoptosis (%). The number of all neuronal cells (live, apoptotic and necrotic) in the vision field was equal to 100%. The data are presented as means ± standard errors of 3 experiments on separate CGC cultures.
Figure 2
Figure 2
The effect of hypoxia and simulated ischemia on cell death in brain slice cultures from 5–7 days and 2–3 months old rats. After 24 h hypoxia or hypoxia with 10 mM D-deoxyglucose (DOG), the level of necrosis was evaluated by measuring increase in lactate dehydrogenase (LDH) activity in the slice culture medium (a) and PI fluorescence in the slice cultures (b). FU—arbitrary fluorescence units. Representative fluorescence microscopy images of brain slice cultures stained with PI (red fluorescence) and Hoechst-33342 (blue fluorescence) are presented in (c). The data are presented as means ± standard errors of 7–18 experiments on separate brain slices cultures. ∗∗—p < 0.01; ∗∗∗—p < 0.001 compared to normoxic control with DOG, ###—p < 0.001 compared to normoxic control without DOG.
Figure 2
Figure 2
The effect of hypoxia and simulated ischemia on cell death in brain slice cultures from 5–7 days and 2–3 months old rats. After 24 h hypoxia or hypoxia with 10 mM D-deoxyglucose (DOG), the level of necrosis was evaluated by measuring increase in lactate dehydrogenase (LDH) activity in the slice culture medium (a) and PI fluorescence in the slice cultures (b). FU—arbitrary fluorescence units. Representative fluorescence microscopy images of brain slice cultures stained with PI (red fluorescence) and Hoechst-33342 (blue fluorescence) are presented in (c). The data are presented as means ± standard errors of 7–18 experiments on separate brain slices cultures. ∗∗—p < 0.01; ∗∗∗—p < 0.001 compared to normoxic control with DOG, ###—p < 0.001 compared to normoxic control without DOG.
Figure 3
Figure 3
Effect of phenformin and metformin on simulated ischemia-induced cell death in brain slice cultures from 5–7 days old rats. Where indicated, 0.025 mM phenformin (Phen) or 0.5 mM metformin (Metf) was added to slice culture incubation medium before the start of simulated ischemia as described in Methods. The level of necrosis after simulated ischemia, indicated as treatment with 10 mM DOG and 24 h hypoxia, was evaluated by measuring increase in LDH activity in slice culture medium. The data were normalized against normoxic controls of each group assuming that normoxic level is 100% and presented as means ± standard errors of 8 separate experiments. *—p < 0.05 compared with normoxic control with DOG, #—p < 0.05 compared to hypoxia with DOG.
Figure 4
Figure 4
Effect of phenformin and metformin on hypoxia-induced (a) and simulated ischemia-induced (b) necrosis in brain slice cultures from 2–3 months old rats. Where indicated, 0.025 mM of phenformin (Phen) or 0.5 mM of metformin (Metf) was added to slice culture incubation medium before the start of hypoxia (a) or simulated ischemia (b) as described in Methods. The level of necrosis after hypoxia or simulated-ischemia was evaluated by measuring increase in LDH activity in slice culture medium. The data were normalized against normoxic controls of each group assuming that normoxic level is 100% and presented as means ± standard errors of 7–9 separate experiments. ***—p < 0.001 compared normoxic control without DOG, ##—p < 0.01; ###—p < 0.001 compared to hypoxia without DOG.
Figure 5
Figure 5
Effect of phenformin and metformin on Complex I activity of brain mitochondria isolated from 5–7 days and 2–3 months age rats. Complex I activity was evaluated by following NADH oxidation rate in isolated freeze–thawed brain mitochondria without (control) or with biguanides—phenformin (Phen, 0.025 mM) or metformin (Metf, 0.5 mM) as described in Methods. Statistically significant difference compared with control group: *—p ≤ 0.05, **—p ≤ 0.01 (n = 3).
Figure 6
Figure 6
The effect of mitochondrial respiratory Complex I and mitochondrial permeability transition pore (MPTP) inhibitors on the level of simulated ischemia-induced necrosis in brain slice cultures from 5–7 days (a) and 2–3 months old (b) rats. Where indicated, 0.05 μM or 1 μM rotenone (Ro), and 2.5 mM amobarbital (Amo), and 0.5 mM cyclosporin A (CsA) were added to slice culture incubation medium before the start of simulated ischemia as described in Methods. The level of necrosis in slice cultures was evaluated by measuring increase in LDH activity in slice culture medium. The data were normalized against normoxic controls of each age group assuming that normoxic level is 100% (white bars) and presented as mean+standard error. N = 3–7; ***—statistically significant difference compared with normoxic control of the corresponding group, p ≤ 0.001. ###, ## and #—statistical significance compared to hypoxia +DOG or hypoxia treatment, p ≤ 0.001, p ≤ 0.01 and 0.05, respectively.
Figure 7
Figure 7
Ca2+ retention capacity of brain cortex mitochondria isolated from 5–7 days (a) and 2–3 months (b) old rats. Mitochondrial calcium retention capacity (CRC) was measured fluorometrically using Calcium Green-5N as described in Methods. Where indicated, rotenone (Rot, 0.05 and 1 µM), amobarbital (Amo, 2.5 mM), cyclopsorine A (CsA, 0.5 µM), metformin (Metf, 10 and 20 mM) or phenformin (Phen, 0.1 and 1 mM) were added to isolated mitochondria 5 min before calcium pulses. The data are presented as means ± standard errors of 3–10 separate experiments. ∗—p < 0.05, ∗∗—p < 0.01 compared to the control of corresponding age group.
Figure 8
Figure 8
Effects of phenformin, metformin, rotenone and cyclosporin A on MPTP opening in neuronal cells. Pure neuronal cultures prepared treating CGC cultures with Ara-C (see Section 2.2) were pre-incubated for 1 h with: (a) 50 μM and 100 μM phenformin (Phen), (b) 2 mM and 3 mM metformin (Met); (c) 0.05 μM and 1 μM rotenone (Rot); and (d) 3 μM and 5 μM cyclosporine A (CsA). Mitochondrial permeability transition pore (MPTP) opening was quantified by measuring fluorescence alteration after staining with Calcein-AM as described in Methods. The data were normalized against controls of each group assuming that control level is 100% and presented as mean ± standard errors of 4–6 experiments on separate cell cultures. ∗—p < 0.01.

References

    1. WHO EMRO Stroke, Cerebrovascular Accident. Health Topics. [(accessed on 24 September 2020)]; Available online: http://www.emro.who.int/health-topics/stroke-cerebrovascular-accident/in....
    1. Borutaite V., Toleikis A., Brown G.C. In the Eye of the Storm: Mitochondrial Damage during Heart and Brain Ischaemia. FEBS J. 2013;280:4999–5014. doi: 10.1111/febs.12353. - DOI - PubMed
    1. Sun J., Luan Q., Dong H., Song W., Xie K., Hou L., Xiong L. Inhibition of Mitochondrial Permeability Transition Pore Opening Contributes to the Neuroprotective Effects of Ischemic Postconditioning in Rats. Brain Res. 2012;1436:101–110. doi: 10.1016/j.brainres.2011.11.055. - DOI - PubMed
    1. Baines C.P. The Mitochondrial Permeability Transition Pore and Ischemia-Reperfusion Injury. Basic Res. Cardiol. 2009:181–188. doi: 10.1007/s00395-009-0004-8. - DOI - PMC - PubMed
    1. Fricker M., Tolkovsky A.M., Borutaite V., Coleman M., Brown G.C. Neuronal Cell Death. Physiol. Rev. 2018:813–880. doi: 10.1152/physrev.00011.2017. - DOI - PMC - PubMed

Publication types

MeSH terms

LinkOut - more resources