

Transcriptomic Insights into the Effect of Melatonin in Saccharomyces cerevisiae in the Presence and Absence of Oxidative Stress
- PMID: 33019712
- PMCID: PMC7650831
- DOI: 10.3390/antiox9100947
Transcriptomic Insights into the Effect of Melatonin in Saccharomyces cerevisiae in the Presence and Absence of Oxidative Stress
Abstract
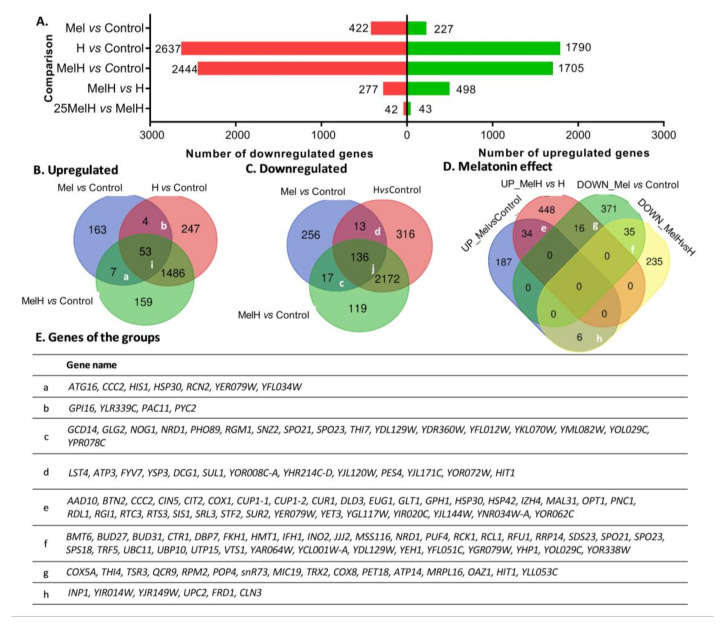
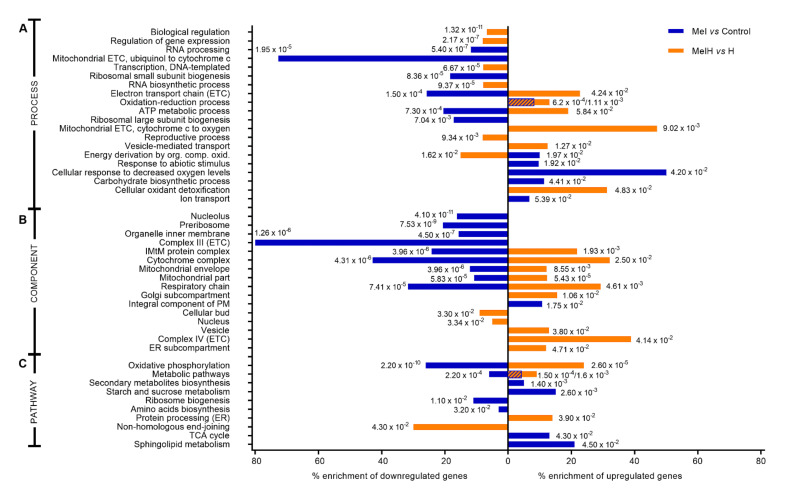
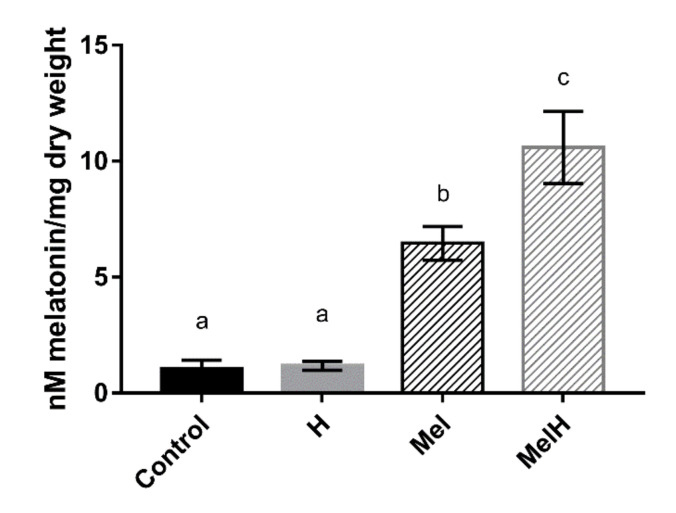
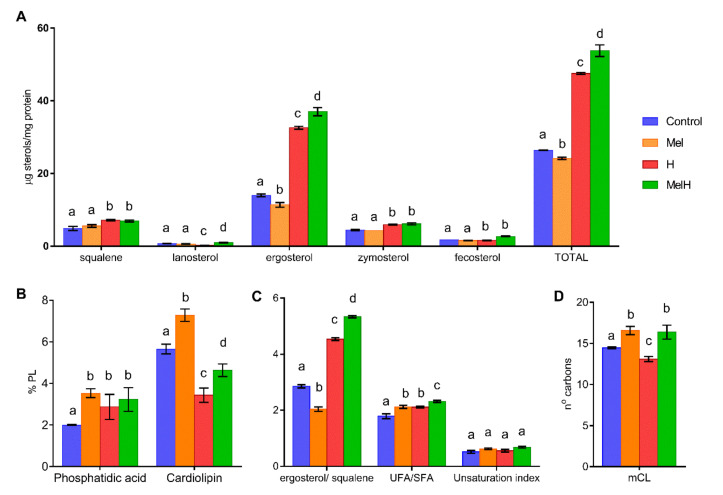
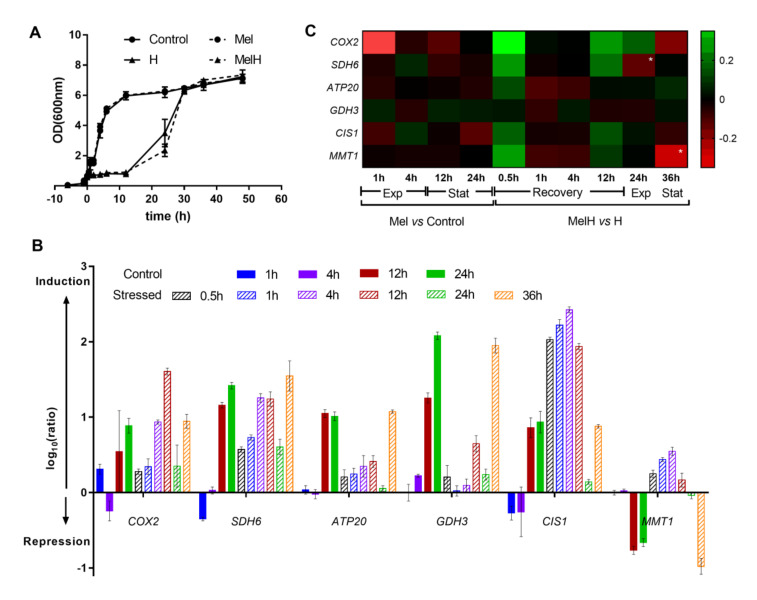
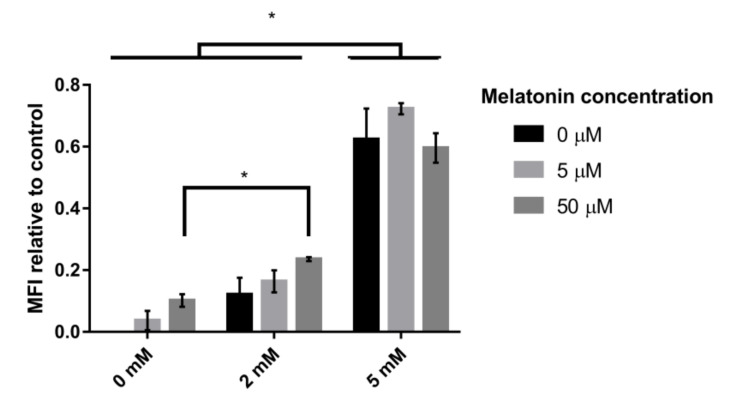
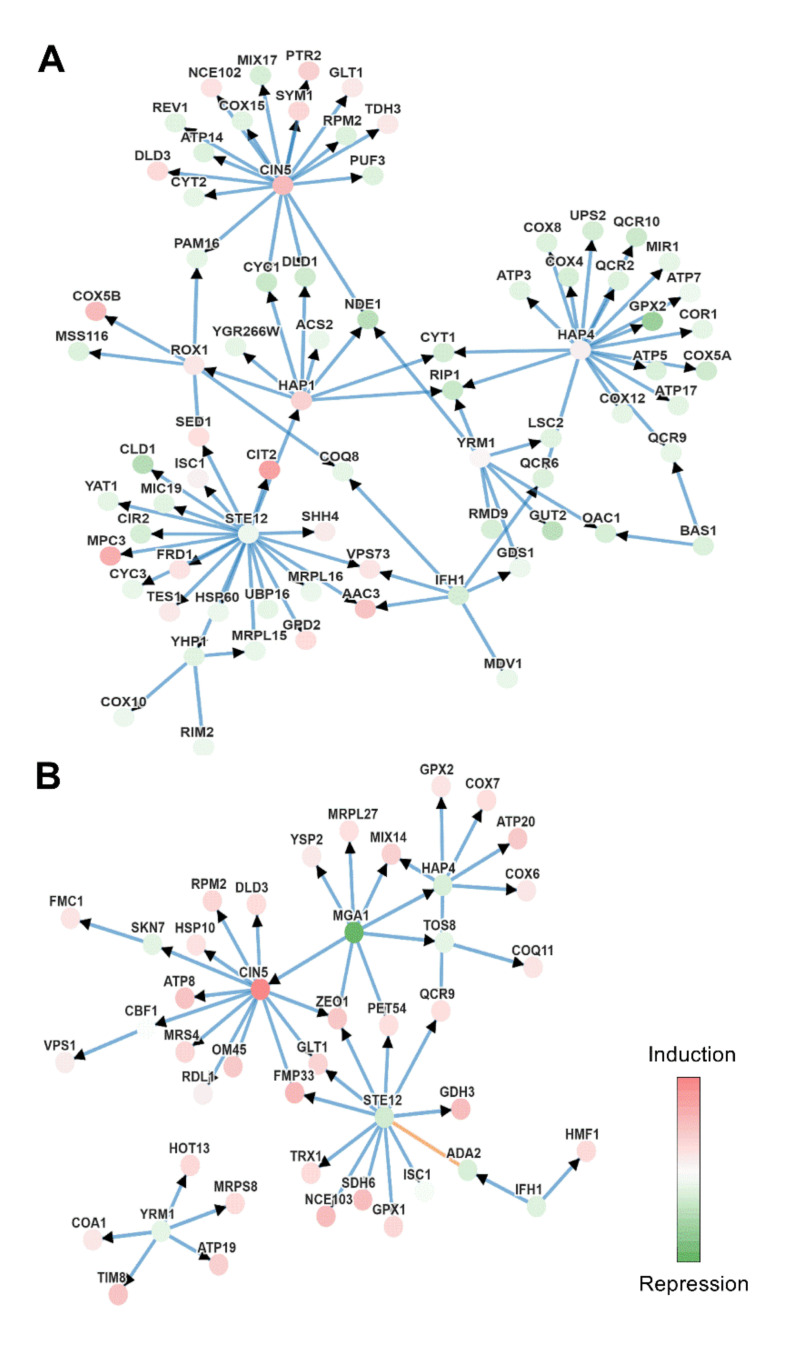
Melatonin is a ubiquitous indolamine that plays important roles in various aspects of biological processes in mammals. In Saccharomyces cerevisiae, melatonin has been reported to exhibit antioxidant properties and to modulate the expression of some genes involved in endogenous defense systems. The aim of this study was to elucidate the role of supplemented melatonin at the transcriptional level in S. cerevisiae in the presence and absence of oxidative stress. This was achieved by exposing yeast cells pretreated with different melatonin concentrations to hydrogen peroxide and assessing the entry of melatonin into the cell and the yeast response at the transcriptional level (by microarray and qPCR analyses) and the physiological level (by analyzing changes in the lipid composition and mitochondrial activity). We found that exogenous melatonin crossed cellular membranes at nanomolar concentrations and modulated the expression of many genes, mainly downregulating the expression of mitochondrial genes in the absence of oxidative stress, triggering a hypoxia-like response, and upregulating them under stress, mainly the cytochrome complex and electron transport chain. Other categories that were enriched by the effect of melatonin were related to transport, antioxidant activity, signaling, and carbohydrate and lipid metabolism. The overall results suggest that melatonin is able to reprogram the cellular machinery to achieve tolerance to oxidative stress.
Keywords: antioxidant; bioactive compound; hydrogen peroxide; hypoxia; melatonin; mitochondria; oxidative stress; yeast.
Conflict of interest statement
The authors declare no conflict of interest.
Figures
Similar articles
-
Melatonin Reduces Oxidative Stress Damage Induced by Hydrogen Peroxide in Saccharomyces cerevisiae.Front Microbiol. 2017 Jun 15;8:1066. doi: 10.3389/fmicb.2017.01066. eCollection 2017. Front Microbiol. 2017. PMID: 28663741 Free PMC article.
-
Melatonin Minimizes the Impact of Oxidative Stress Induced by Hydrogen Peroxide in Saccharomyces and Non-conventional Yeast.Front Microbiol. 2018 Aug 20;9:1933. doi: 10.3389/fmicb.2018.01933. eCollection 2018. Front Microbiol. 2018. PMID: 30177925 Free PMC article.
-
Protective Effects of Melatonin on Saccharomyces cerevisiae under Ethanol Stress.Antioxidants (Basel). 2021 Oct 29;10(11):1735. doi: 10.3390/antiox10111735. Antioxidants (Basel). 2021. PMID: 34829606 Free PMC article.
-
Melatonin Confers Plant Cadmium Tolerance: An Update.Int J Mol Sci. 2021 Oct 28;22(21):11704. doi: 10.3390/ijms222111704. Int J Mol Sci. 2021. PMID: 34769134 Free PMC article. Review.
-
Melatonin, mitochondria, and cellular bioenergetics.J Pineal Res. 2001 Mar;30(2):65-74. doi: 10.1034/j.1600-079x.2001.300201.x. J Pineal Res. 2001. PMID: 11270481 Review.
Cited by
-
Melatonin: Regulation of Prion Protein Phase Separation in Cancer Multidrug Resistance.Molecules. 2022 Jan 21;27(3):705. doi: 10.3390/molecules27030705. Molecules. 2022. PMID: 35163973 Free PMC article. Review.
-
Melatonin: a potential therapeutic approach for the management of primary Sjögren's syndrome.Immunol Res. 2023 Jun;71(3):373-387. doi: 10.1007/s12026-023-09360-w. Epub 2023 Jan 30. Immunol Res. 2023. PMID: 36715831 Review.
-
Crosstalk between Peroxisomal Activities and Nrf2 Signaling in Porcine Embryos.Antioxidants (Basel). 2021 May 13;10(5):771. doi: 10.3390/antiox10050771. Antioxidants (Basel). 2021. PMID: 34068072 Free PMC article.
-
How We Can Change Clinical Practice Using Antioxidant Molecules?Antioxidants (Basel). 2022 Jun 4;11(6):1116. doi: 10.3390/antiox11061116. Antioxidants (Basel). 2022. PMID: 35740013 Free PMC article.
-
An Examination of the Putative Role of Melatonin in Exosome Biogenesis.Front Cell Dev Biol. 2021 Jun 8;9:686551. doi: 10.3389/fcell.2021.686551. eCollection 2021. Front Cell Dev Biol. 2021. PMID: 34169078 Free PMC article. Review.
References
-
- Lerner A.B., Case J.D., Takahashi Y., Lee T.H., Mori W. Isolation of melatonin, the pineal gland factor that Lightens melanocytes. J. Am. Chem. Soc. 1958;80:2587. doi: 10.1021/ja01543a060. - DOI
-
- Eghbal M.A., Eftekhari A., Ahmadian E., Azarmi Y., Parvizpur A. A review of biological and pharmacological actions of melatonin: oxidant and prooxidant properties. Pharm. Bioprocess. 2016;4:069–081. doi: 10.4172/jpr.1000106. - DOI
-
- Sprenger J., Hardeland R., Fuhrberg B., Han S.-Z. Melatonin and other 5-methoxylated indoles in yeast: presence in high concentrations and dependence on tryptophan availability. Cytologia. 1999;64:209–213. doi: 10.1508/cytologia.64.209. - DOI
Grants and funding
LinkOut - more resources
Full Text Sources
Molecular Biology Databases
