. 2021 Jul;32(13-14):667-681.
doi: 10.1089/hum.2020.213. Epub 2020 Dec 14.

Genetic Rescue of X-Linked Retinoschisis Mouse (Rs1-/y) Retina Induces Quiescence of the Retinal Microglial Inflammatory State Following AAV8- RS1 Gene Transfer and Identifies Gene Networks Underlying Retinal Recovery

Affiliations

Genetic Rescue of X-Linked Retinoschisis Mouse (Rs1-/y) Retina Induces Quiescence of the Retinal Microglial Inflammatory State Following AAV8- RS1 Gene Transfer and Identifies Gene Networks Underlying Retinal Recovery

Camasamudram Vijayasarathy et al. Hum Gene Ther. 2021 Jul.

Abstract

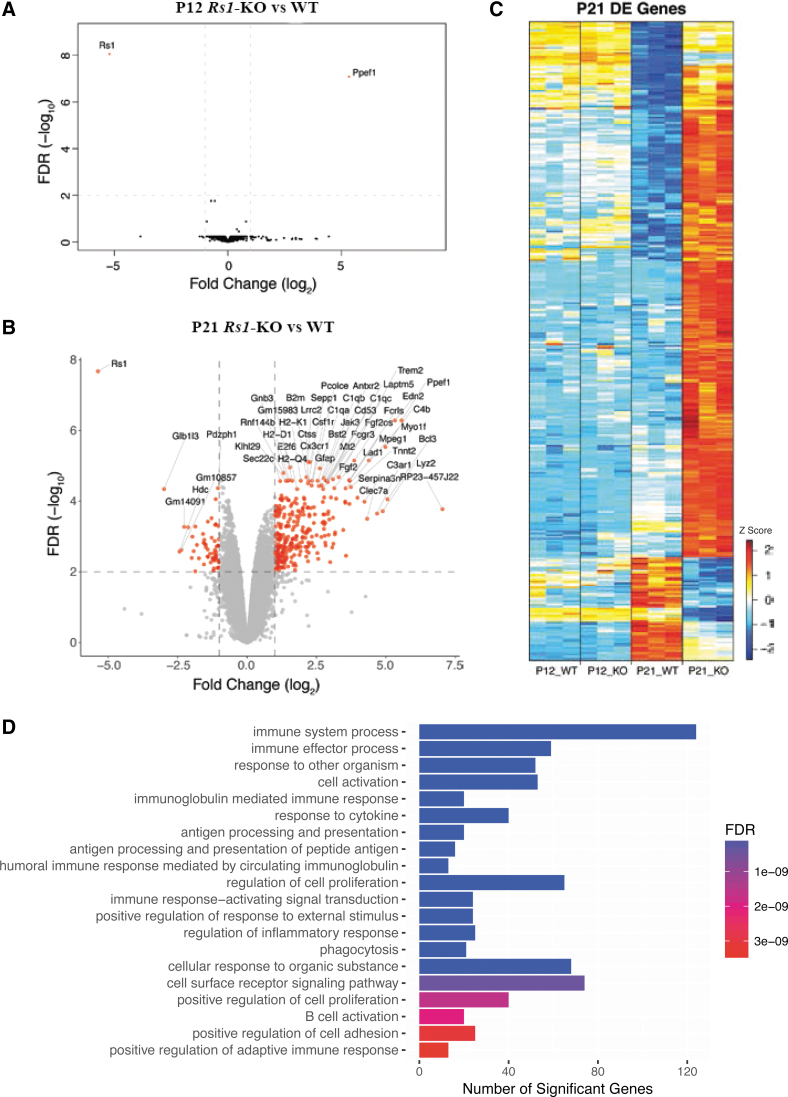
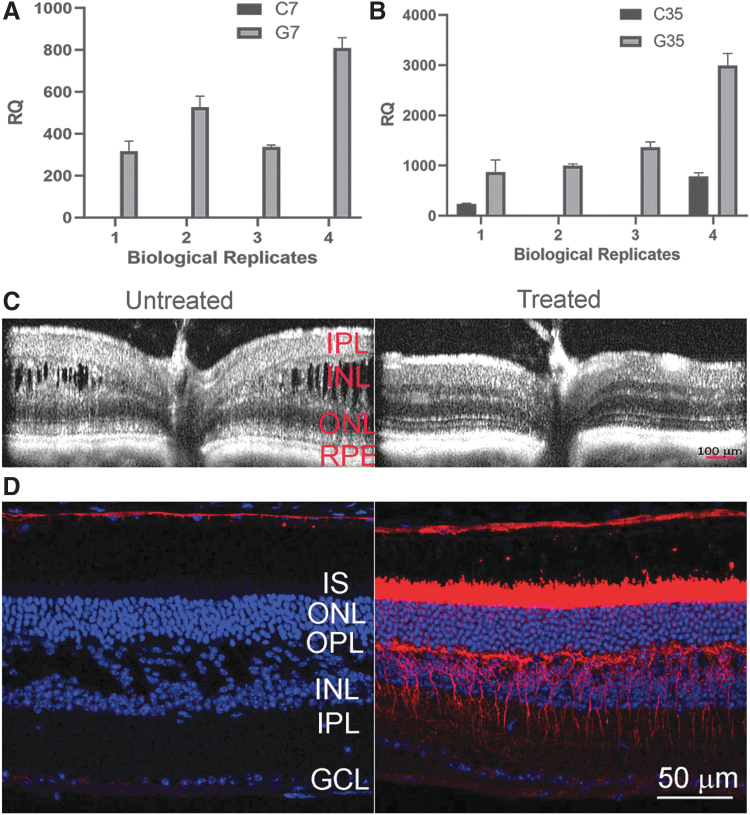
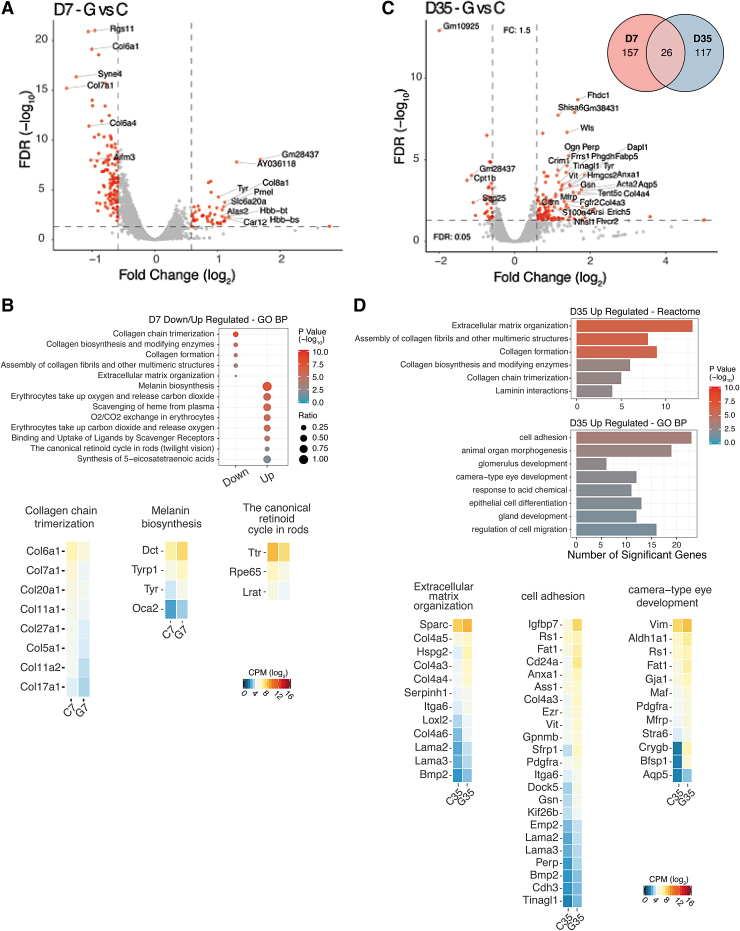
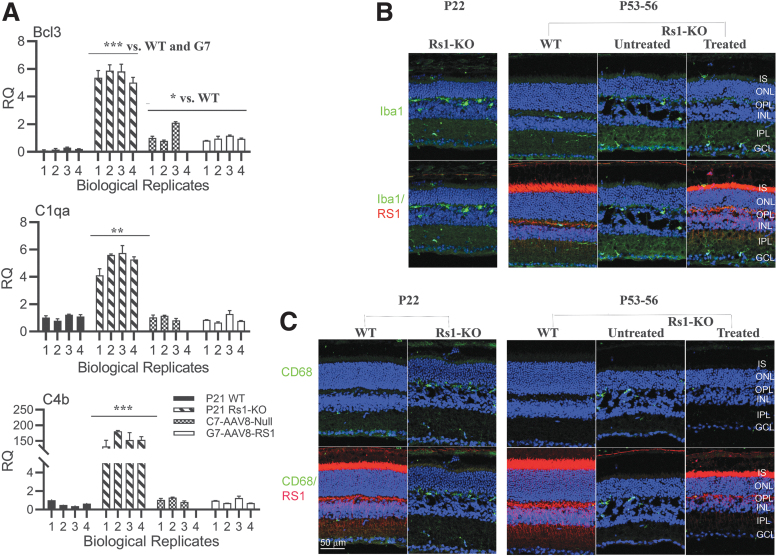
To understand RS1 gene interaction networks in the X-linked retinoschisis (XLRS) mouse retina (Rs1-/y), we analyzed the transcriptome by RNA sequencing before and after in vivo expression of exogenous retinoschisin (RS1) gene delivered by AAV8. RS1 is a secreted cell adhesion protein that is critical for maintaining structural lamination and synaptic integrity of the neural retina. RS1 loss-of-function mutations cause XLRS disease in young boys and men, with splitting ("schisis") of retinal layers and synaptic dysfunction that cause progressive vision loss with age. Analysis of differential gene expression profiles and pathway enrichment analysis of Rs1-KO (Rs1-/y) retina identified cell surface receptor signaling and positive regulation of cell adhesion as potential RS1 gene interaction networks. Most importantly, it also showed massive dysregulation of immune response genes at early age, with characteristics of a microglia-driven proinflammatory state. Delivery of AAV8-RS1 primed the Rs1-KO retina toward structural and functional recovery. The disease transcriptome transitioned toward a recovery phase with upregulation of genes implicated in wound healing, anatomical structure (camera type eye) development, metabolic pathways, and collagen IV networks that provide mechanical stability to basement membrane. AAV8-RS1 expression also attenuated the microglia gene signatures to low levels toward immune quiescence. This study is among the first to identify RS1 gene interaction networks that underlie retinal structural and functional recovery after RS1 gene therapy. Significantly, it also shows that providing wild-type RS1 gene function caused the retina immune status to transition from a degenerative inflammatory phenotype toward immune quiescence, even though the transgene is not directly linked to microglia function. This study indicates that inhibition of microglial proinflammatory responses is an integral part of therapeutic rescue in XLRS gene therapy, and gene therapy might realize its full potential if delivered before microglia activation and photoreceptor cell death. Clinical Trials. gov Identifier NTC 02317887.

Keywords: AAV8-retinoschisin; RNA-seq; X-linked retinoschisis; gene therapy; immune quiescence; microglia activation.


Conflict of interest statement

No competing financial interests exist.

Figures

Figure 1.
Figure 1.
Transcription profiles of Rs1-KO (Rs1−/y) retina. (A) Volcano plot of the significantly differentially expressed genes (DEGs) (red dots) in the analysis of Rs1-KO (Rs1-/y) mouse retina relative to WT males at P12. (B) Volcano plot of the significantly DEGs (red dots) in the analysis of Rs1-KO mouse retina relative to WT retina samples at P21. Significance thresholds being fold change ≥2 and FDR <1% (dashed lines). Gene labels indicate those having fold change ≥2. (C) Hierarchical cluster analysis of gene expression patterns in WT and Rs1-KO mice retinas at ages P12 and P21 respectively. Hierarchical clustering of genes and samples was performed. A total of 12 retina RNA samples (3 samples each P12 WT, P12 Rs1-KO; p21 WT & P21 Rs1-KO) were sorted by hierarchical clustering and the data are presented in a matrix format; each row represents a particular cDNA and each column is an individual RNA sample. Number of expressed genes and their corresponding transcripts at each in vivo retina age using different low-level expression limit cutoffs: fold change ≥2 for any comparison and with a FDR <1%. Genes were clustered based on their Z-score value. (D) Most significantly enriched pathways of differentially expressed genes in Rs1-KO mice retina as analyzed by Gene Ontology Biological Processes. Number of differentially expressed genes in each pathway: P21-Rs1-KO vs. P21-WT mouse retinas showing 2-fold changes in gene expression levels. p = 0.01. FDR, false discovery rate.
Figure 2.
Figure 2.
AAV8-delivered transgene RS1 expression restores neural cell adhesion and retina lamination in Rs1-KO (Rs1−/y) retina. (A-B) qRT-PCR reaction confirmation of RS1 gene expression in Rs1-KO (Rs1-/y ) mice retina receiving subretinal injections of AAV8-RS1 or AAV8-Null vector. 18s rRNA was amplified as endogenous control. The assay conditions are described in detail in Materials and Methods. The data are represented as a fold change in relative levels of indicated gene expression compared to those in WT control retina. (A) Exogenous RS1 gene expression levels at post injection day 7, G7 and at (B) post injection day 35, G35. The relative quantity of RS1 mRNA was calculated using the delta-delta Ct method, considering the PCR signal of the target gene transcript of each sample, normalized to 18S rRNA relative to that of the control sample. The data was expressed as Mean ± SEM. (C) SD-OCT scans collected from Rs1-KO mice before (left panel) and 35 days after (right panel) RS1 gene transfer. The scan of untreated eye showed large cavities splitting the OPL and INL with blurring of the margin between these two layers. In contrast, treated eyes showed much more organized retinal laminar structure: the size of cavities was reduced, the margin of OPL and INL became more distinct, and ONL thickness was partially preserved. (D) RS1 expression in uninjected Rs1-KO mice retina (left panel) and AAV8-RS1–injected retina (right panel) at 5 weeks after treatment (P49). Retinal sections were immunolabeled with anti-RS1 antibody (dilution 1:1000) and nuclei were counterstained with DAPI (blue). Gene transfer into Rs1-KO mice retina lead to strong expression of RS1 protein (red) in inner segments (IS) of photoreceptors and OPL and along bipolar cell processes, similar to that seen in WT mouse retina. The untreated retinas from Rs1-KO mice showed no RS1 labeling and displayed schisis cavities and bipolar cell layer disorganization. Scale bars: 50 μm. n = 3.
Figure 3.
Figure 3.
AAV8-RS1 induced gene expression changes in Rs1-KO (Rs1−/y) retina. (A) Volcano plot of the significantly DEGs (red dots) in the analysis of Rs1-KO AAV8-RS1(G7) mouse retina relative to Rs1-KO AA8-Null retina (C7) samples at 7 days post-injection. Significance thresholds being fold change ≥1.5 and FDR <1% (dashed lines). Gene labels indicate those having fold change ≥1.5. (B) GO functional enrichment analysis for the down-regulated and up-regulated DEGs. Ratio is the proportion of each pathway's genes obtained in a particular group of the DEG list. p-value shows the significance in -log10 values. Expression heatmaps of selected marker genes for collagen chain trimerization, melanin biosynthesis and canonical retinoid cycle in rods. Expression values are represented as log2 CPM values. (C) Volcano plot of the significantly DEGs (red dots) in the analysis of Rs1-KO AAV8-RS1 (G35) mouse retina relative to Rs1-KO AA8-Null (C35) retina samples at 35 days post-injection. Significance thresholds being fold change ≥1.5 and FDR <1% (dashed lines). Gene labels indicate those having fold change ≥1.5. Inset shows Venn diagram of DEGs in different comparisons G vs. C. The overlapping portions of the different circles represent the number of DEGs common to these comparison groups. (D) Pathway enrichment analysis: Gene ontology biological processes (BP) and reactome pathways, the number of upregulated and significant genes. Expression heatmaps of selected marker genes for ECM organization, cell adhesion, camera type eye development in the retina. Expression values are represented as log2 CPM values.
Figure 4.
Figure 4.
AAV8-RS1 attenuates inflammatory responses and restores immune quiescence state in Rs1-KO (Rs1−/y) retina. (A) Exogenous RS1 gene expression in Rs1-KO (Rs1-/y) retina suppresses pro- inflammatory C1qa, C4b, andBcl3 gene expression. Bar graphs of RNA expression for indicated genes in WT, Rs1-KO, C7 and G7 retinas. Experiment is described in Fig 2A. Data are expressed as Mean ± SEM. Statistical significance determined using the Holm-Sidak method, with alpha = 0.05. Each row was analyzed individually, without assuming a consistent SD. *p ≤ 0.05, **p ≤ 0.01, ***p ≤ 0.001. (B) Exogenous RS1 gene expression inhibits microglial activation in Rs1-KO retina: Retinal sections double stained Iba (1:500, green) and Rs1 (1:1000, red). Microglia in age matched WT retinas showed a tiny cell soma, little perinuclear cytoplasm, and a small number of fine, branched processes covered in numerous projections. In the untreated Rs1-KO retinas at P21 and P49 an increase in microglial cell number was found compared with WT control retinas (Figure 1B). Moreover, numerous amoeboid Iba1 positive cells were observed in all retinal layers, with greater presence in IPL and the OPL. In retinas expressing exogenous RS1 gene amoeboid Iba1 -positive cells were less abundant than in untreated in all layers of the retina and were mainly distributed in more internal GC layer. (C) Retinal sections double stained for RS1(1:1000, red) and CD68 (1:400, green). CD68 is a phagocytic marker associated with the involvement of monocytes/macrophages. CD68 staining is undetectable in age matched WT retinas and CD68 staining is intense in OPL in untreated RS1-KO retina. CD68 staining barely detectable in treated retina. Data from one representative experiment of two or three independent experiments. Scale bars: 50 μm. n = 3.

Similar articles

Cited by

References

    1. Gehrig AE, Warneke-Wittstock R, Sauer CG, et al. . Isolation and characterization of the murine X-linked juvenile retinoschisis (Rs1h) gene. Mamm Genome 1999;10:303–307 - PubMed
    1. Sauer CG, Gehrig A, Warneke-Wittstock R, et al. . Positional cloning of the gene associated with X-linked juvenile retinoschisis. Nat Genet 1997;17:164–170 - PubMed
    1. Rao P, Dedania VS, Drenser KA. Congenital X-linked retinoschisis: an updated clinical review. Asia Pac J Ophthalmol (Phila) 2018;7:169–175 - PubMed
    1. Tantri A, Vrabec TR, Cu-Unjieng A, et al. . X-linked retinoschisis: a clinical and molecular genetic review. Surv Ophthalmol 2004;49:214–230 - PubMed
    1. George ND, Yates JR, Bradshaw K, et al. . Infantile presentation of X linked retinoschisis. Br J Ophthalmol 1995;79:653–657 - PMC - PubMed

Publication types