. 2020 Nov 17;64(12):e01013-20.
doi: 10.1128/AAC.01013-20. Print 2020 Nov 17.

Piperaquine Exposure Is Altered by Pregnancy, HIV, and Nutritional Status in Ugandan Women

Affiliations

Piperaquine Exposure Is Altered by Pregnancy, HIV, and Nutritional Status in Ugandan Women

Emma Hughes et al. Antimicrob Agents Chemother. .

Abstract

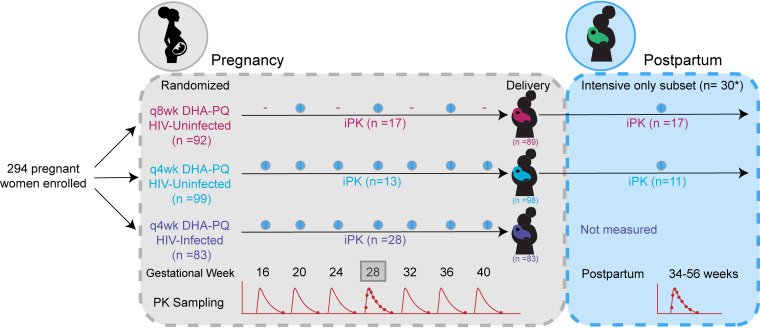
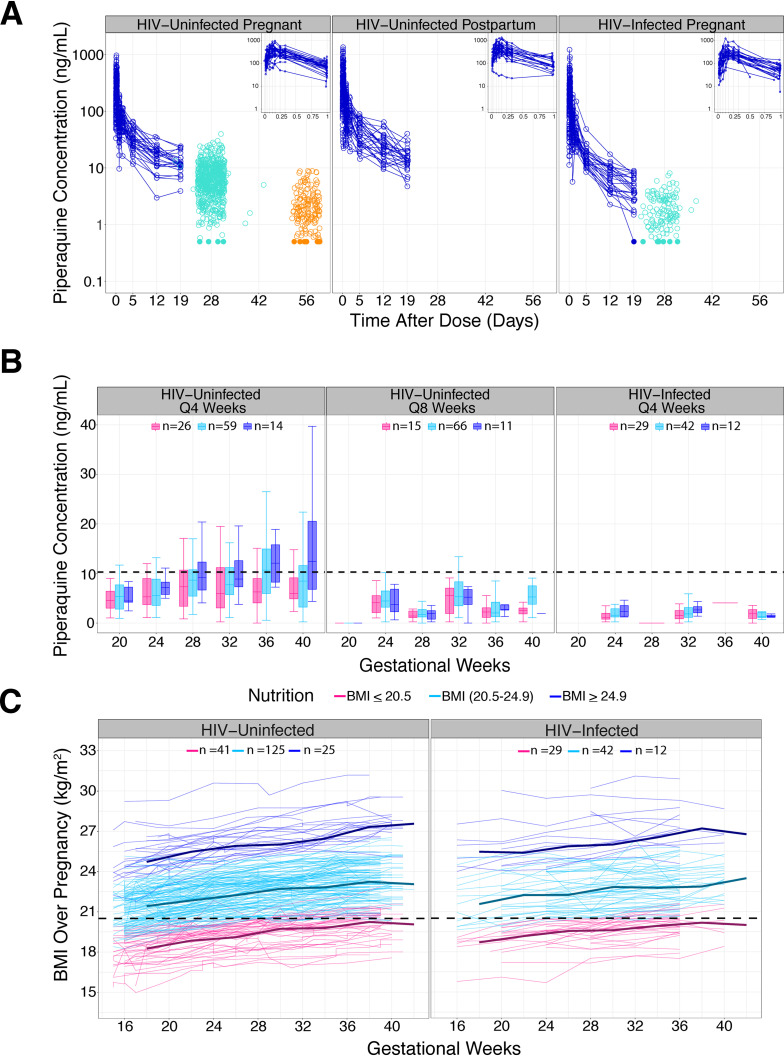
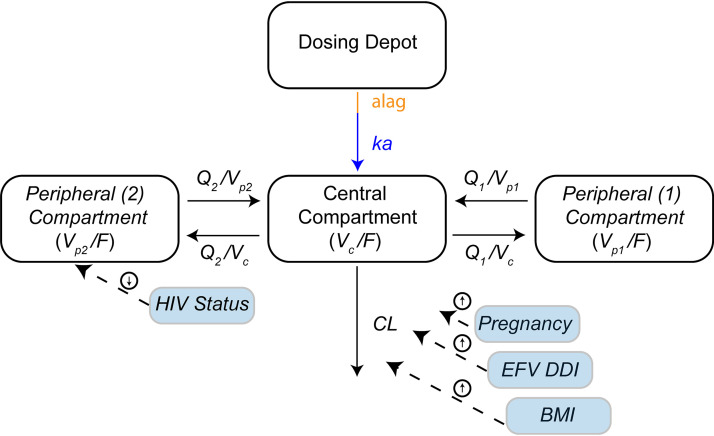
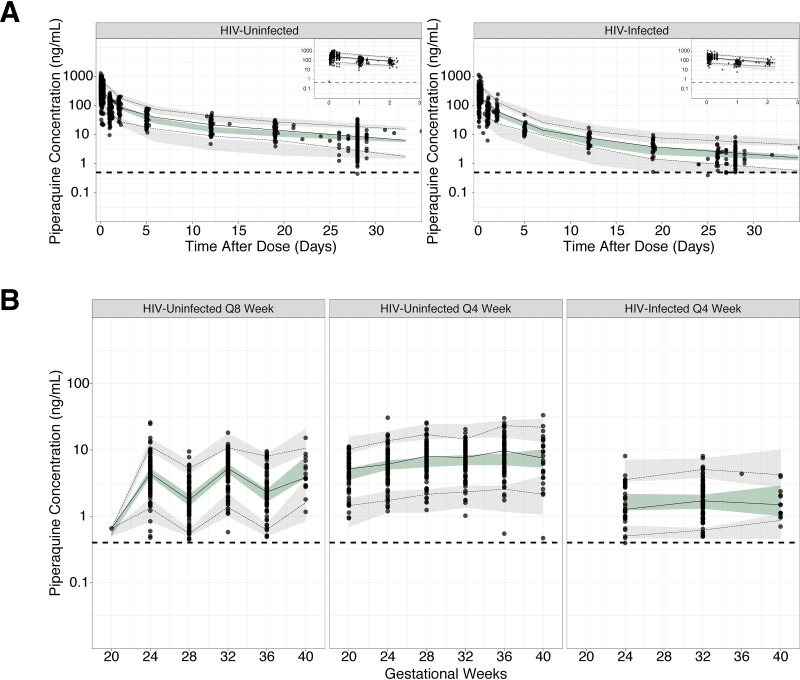
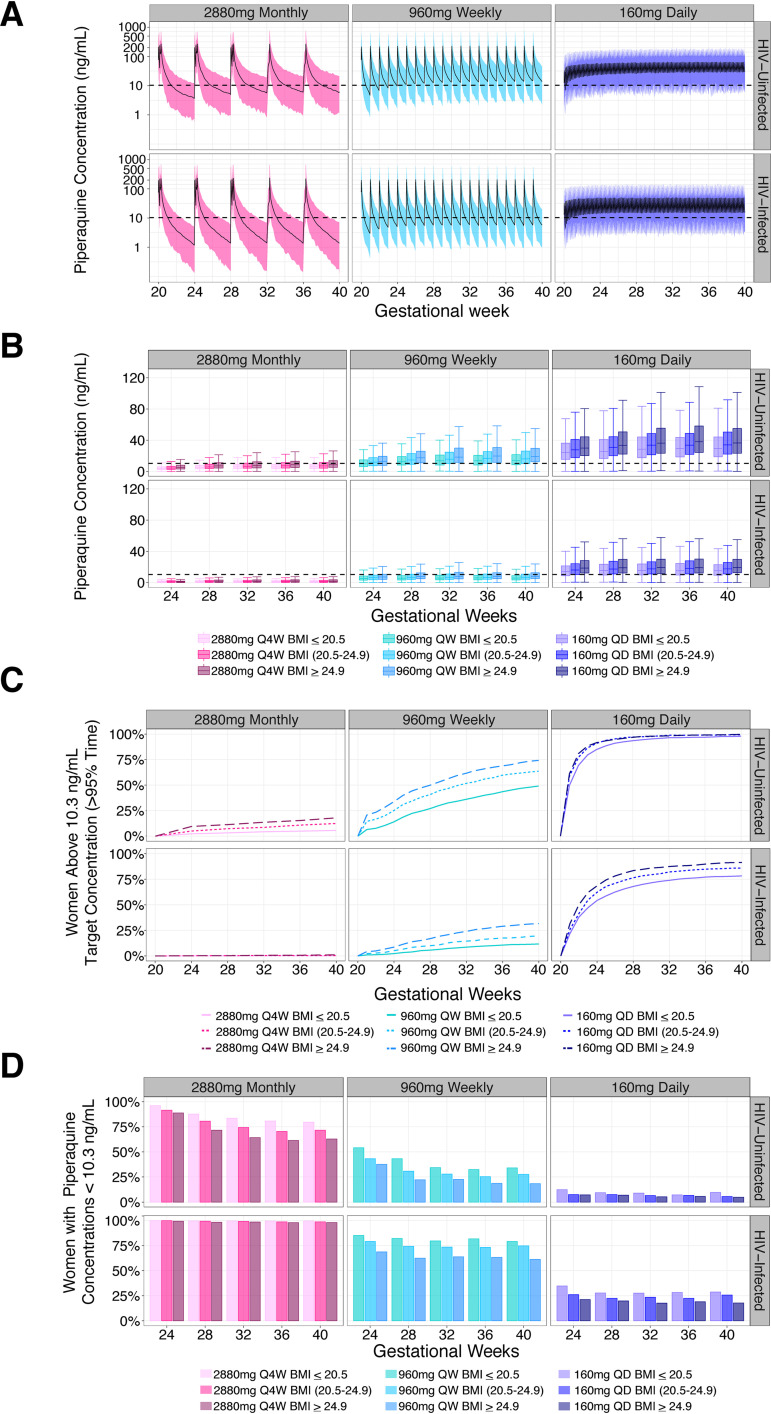
Dihydroartemisinin-piperaquine (DHA-PQ) provides highly effective therapy and chemoprevention for malaria in pregnant African women. PQ concentrations of >10.3 ng/ml have been associated with reduced maternal parasitemia, placental malaria, and improved birth outcomes. We characterized the population pharmacokinetics (PK) of PQ in a post hoc analysis of human immunodeficiency virus (HIV)-infected and -uninfected pregnant women receiving DHA-PQ as chemoprevention every 4 or 8 weeks. The effects of covariates such as pregnancy, nutritional status (body mass index [BMI]), and efavirenz (EFV)-based antiretroviral therapy were investigated. PQ concentrations from two chemoprevention trials were pooled to create a population PK database from 274 women and 2,218 PK observations. A three-compartment model with an absorption lag best fit the data. Consistent with our prior intensive PK evaluation, pregnancy and EFV use resulted in a 72% and 61% increased PQ clearance, compared to postpartum and HIV-uninfected pregnant women, respectively. Low BMI at 28 weeks of gestation was associated with increased clearance (2% increase per unit decrease in BMI). Low-BMI women given DHA-PQ every 8 weeks had a higher prevalence of parasitemia, malaria infection, and placental malaria compared to women with higher BMIs. The reduced piperaquine exposure in women with low BMI as well as during EFV coadministration, compared to pregnant women with higher BMIs and not taking EFV, suggests that these populations could benefit from weekly instead of monthly dosing for prevention of malaria parasitemia. Simulations indicated that because of the BMI-clearance relationship, weight-based regimens would not improve protection compared to a 2,880 mg fixed-dose regimen when provided monthly. (The clinical trials described in this paper have been registered at ClinicalTrials.gov under identifiers NCT02163447 and NCT02282293.).

Keywords: dihydroartemisinin-piperaquine; drug-drug interactions; malaria prevention; pharmacokinetics; population pharmacokinetics; pregnancy.


Figures

FIG 1
FIG 1
Trial diagram. Women were enrolled at 16 to 28 weeks gestation. PK sampling began at 20 weeks gestation and continued until delivery. iPK (box) indicates intensive PK sampling at 28 weeks gestation. The asterisk indicates two of the women included in the postpartum sampling group received SP during pregnancy. The number of women enrolled and randomized reported here reflects only those who went on to initiate study drug. q4wk, doses given every 4 weeks; q8wk, doses given every 8 weeks.
FIG 2
FIG 2
Time profiles. (A) Piperaquine concentrations over time used to build the population PK model. The profiles in blue represent intensive PK sampling. Each line represents one individual. Monthly (28-day) concentrations are in green and 56-day trough concentrations are in orange. Insets in the upper right corner show the intensive PK profiles for the first day postdose. To avoid overlap of monthly points, random noise was added about the x axis to separate the data. (B) Piperaquine monthly concentrations stratified by treatment arm, HIV status, and BMI. Women were grouped based on gestational week-28 BMIs. The number of women in each group is displayed. The dashed line at 10.3 ng/ml marks the previously defined threshold for malaria protection in HIV-uninfected pregnant women. (C) BMI over time profile. Women were grouped based on week-28 BMIs. Each line represents one individual. The dashed line at 20.5 kg/m2 marks the plotting cutoff for defining a woman as malnourished during the third trimester (see the supplemental material).
FIG 3
FIG 3
Final piperaquine population pharmacokinetic model: a three-compartment model with an absorption lag. Four significant parameter-covariate relations were included in the final model. Covariates are shown in blue boxes, with dashed arrows indicating which parameter is influenced and the direction of the effect indicated by the arrows enclosed in circles. Clearance (CL) in this model is the oral clearance (CL/F).
FIG 4
FIG 4
Prediction-corrected visual predictive check of the final pharmacokinetic model. (A) Intensive profiles at 28 weeks gestation. Plot of intensive data, including day-28 levels stratified based on HIV status. Insets in the upper right corner show the intensive profiles for 3 days postdose. (B) Monthly concentrations plotted over pregnancy. The observed data for each subject are plotted as black circles. The solid and dashed lines are the observed median and 5th and 95th percentiles of the observed data. The shaded areas represent the 95% confidence intervals of the model simulated data. Q8, DHA-PQ dosing given every 8 weeks; Q4, DHA-PQ dosing given every 4 weeks.
FIG 5
FIG 5
Alternative IPTp regimen simulations. (A) Full PK profiles. Simulated PQ concentrations over pregnancy stratified based on HIV status for three different dosing regimens. The dashed line at 10.3 ng/ml marks the previously defined threshold for malaria protection in HIV-uninfected pregnant women. (B) Day-28 concentrations. Simulated PQ day-28 concentrations over pregnancy stratified based on HIV status and week-28 BMI. The dashed line at 10.3 ng/ml marks the previously defined threshold for malaria protection in pregnant women. (C) Percentage of women protected. Percentage of women achieving protection based on HIV status and week-28 BMI for different prevention regimens over pregnancy. Protection was defined as sustaining a PQ concentration of 10.3 ng/ml or greater for 95% of their pregnancy. (D) Percentage of women with day-28 concentrations below 10.3 ng/ml. Based on simulated PQ concentrations, the percentage of women not protected at the end of the month is stratified based on HIV status and week-28 BMI. Q4W, doses given every 4 weeks; QW, doses given every week; QD, doses given daily.

Similar articles

Cited by

References

    1. Dellicour S, Tatem AJ, Guerra CA, Snow RW, ter Kuile FO. 2010. Quantifying the number of pregnancies at risk of malaria in 2007: a demographic study. PLoS Med 7:e1000221. doi:10.1371/journal.pmed.1000221. - DOI - PMC - PubMed
    1. World Health Organization. 2019. World Malaria Report 2019. World Health Organization, Geneva, Switzerland: https://www.who.int/publications/i/item/9789241565721.
    1. Walker PG, ter Kuile FO, Garske T, Menendez C, Ghani AC. 2014. Estimated risk of placental infection and low birthweight attributable to Plasmodium falciparum malaria in Africa in 2010: a modelling study. Lancet Glob Health 2:e460–e467. doi:10.1016/S2214-109X(14)70256-6. - DOI - PubMed
    1. Akinyemi RO, Izzeldin IM, Dotchin C, Gray WK, Adeniji O, Seidi OA, Mwakisambwe JJ, Mhina CJ, Mutesi F, Msechu HZ, Mteta KA, Ahmed MA, Hamid SH, Abuelgasim NA, Mohamed SA, Mohamed AY, Adesina F, Hamzat M, Olunuga T, Maro VP, Walker R. 2014. Contribution of noncommunicable diseases to medical admissions of elderly adults in Africa: a prospective, cross-sectional study in Nigeria, Sudan, and Tanzania. J Am Geriatr Soc 62:1460–1466. doi:10.1111/jgs.12940. - DOI - PubMed
    1. Moore KA, Fowkes FJI, Wiladphaingern J, Wai NS, Paw MK, Pimanpanarak M, Carrara VI, Raksuansak J, Simpson JA, White NJ, Nosten F, McGready R. 2017. Mediation of the effect of malaria in pregnancy on stillbirth and neonatal death in an area of low transmission: observational data analysis. BMC Med 15:98. doi:10.1186/s12916-017-0863-z. - DOI - PMC - PubMed

Publication types

Supplementary concepts

Associated data