. 2020 Oct 28;40(44):8556-8572.
doi: 10.1523/JNEUROSCI.2901-19.2020. Epub 2020 Oct 5.

Altered Outer Hair Cell Mitochondrial and Subsurface Cisternae Connectomics Are Candidate Mechanisms for Hearing Loss in Mice

Affiliations

Altered Outer Hair Cell Mitochondrial and Subsurface Cisternae Connectomics Are Candidate Mechanisms for Hearing Loss in Mice

Guy Perkins et al. J Neurosci. .

Abstract

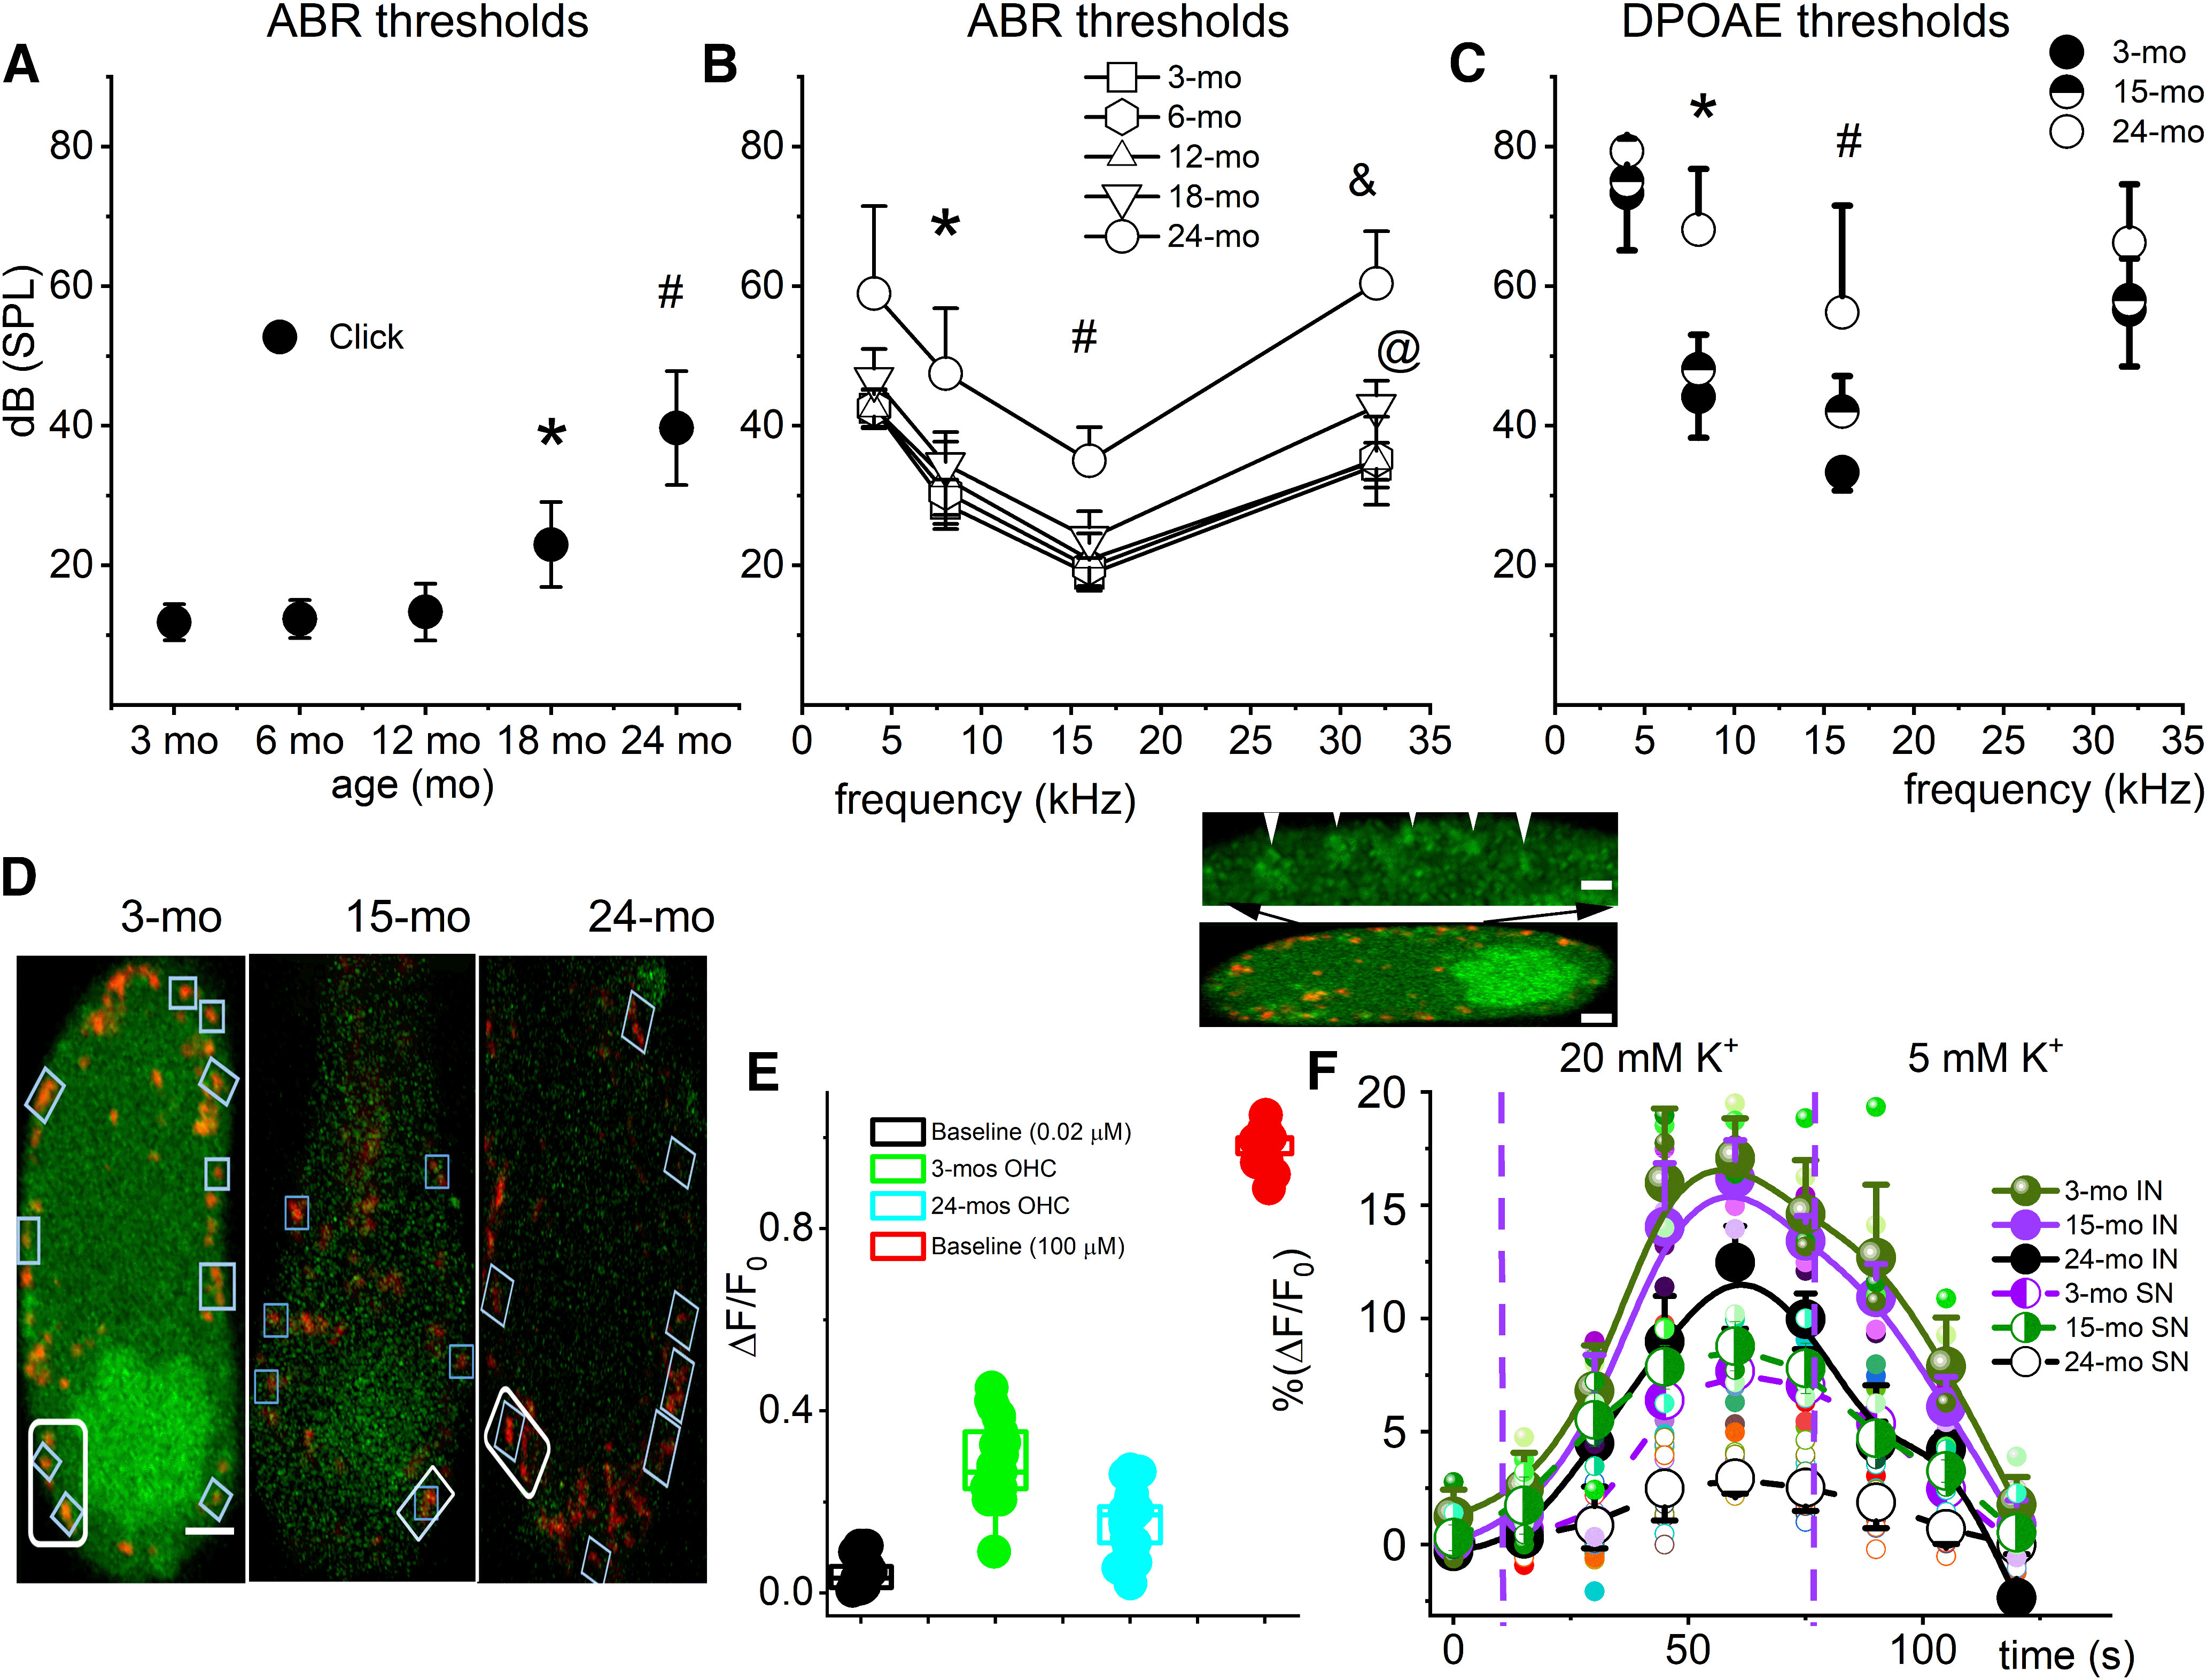
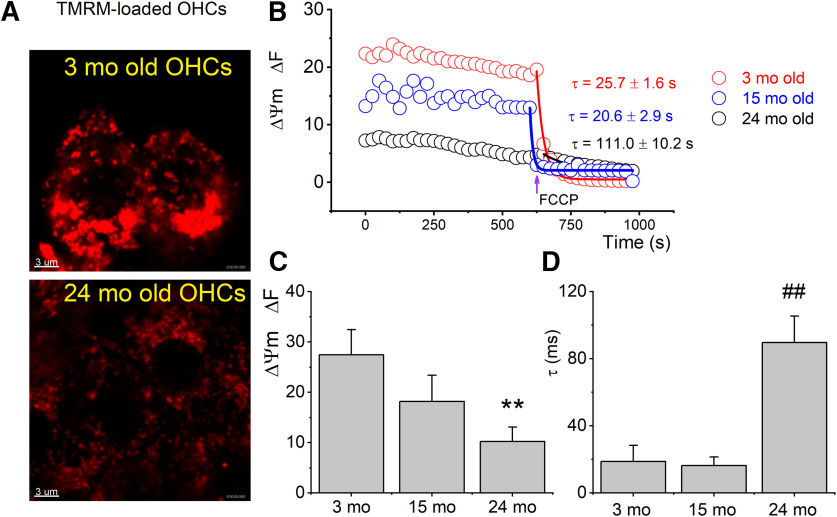
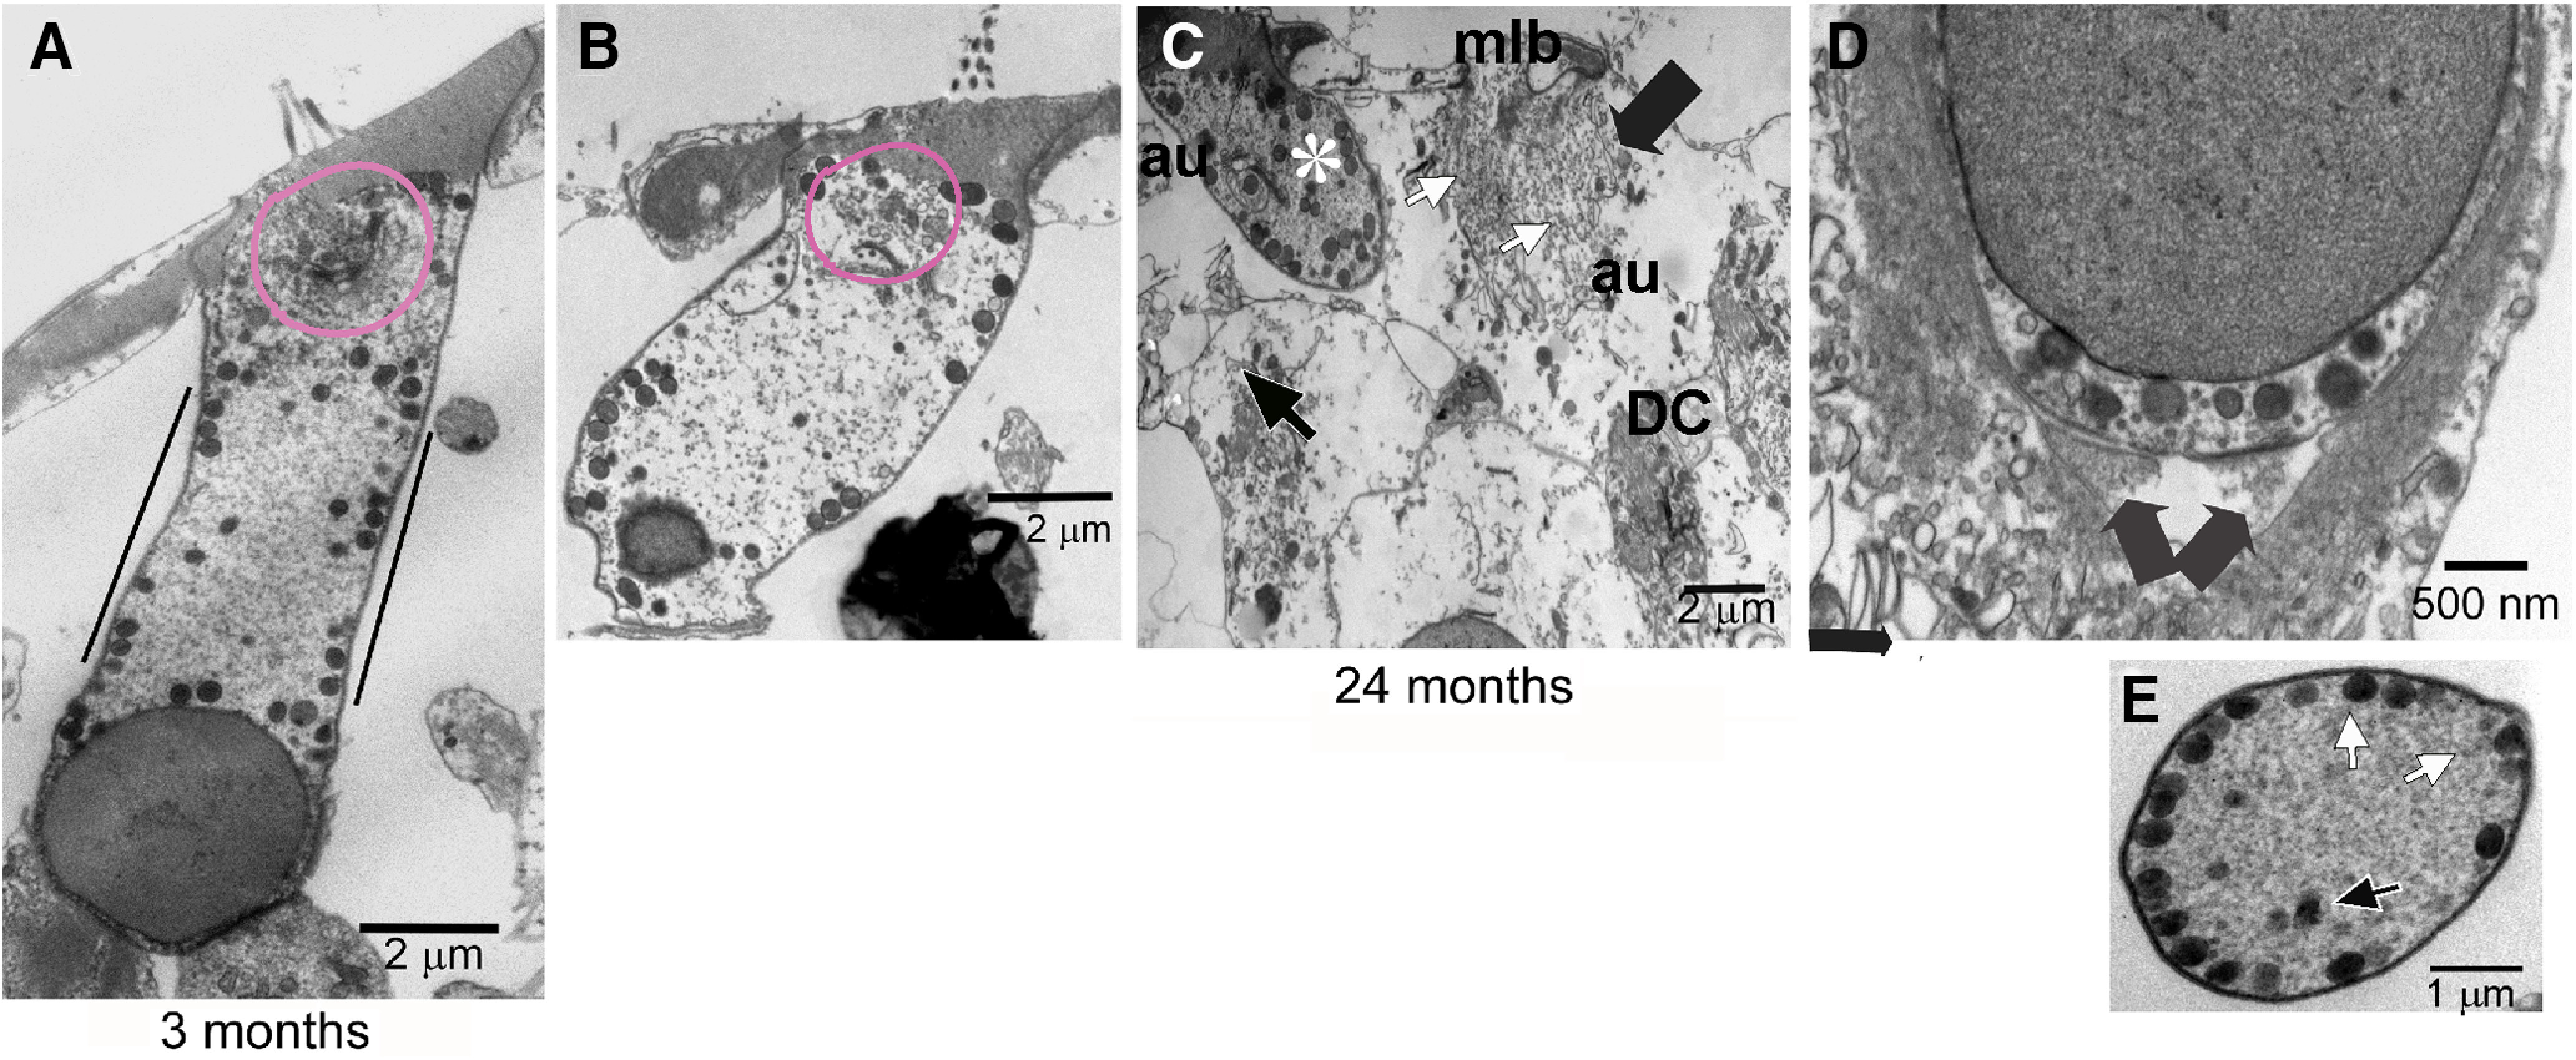
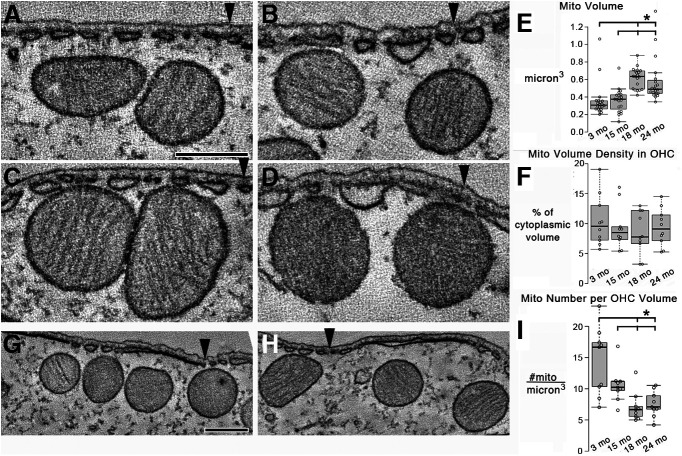
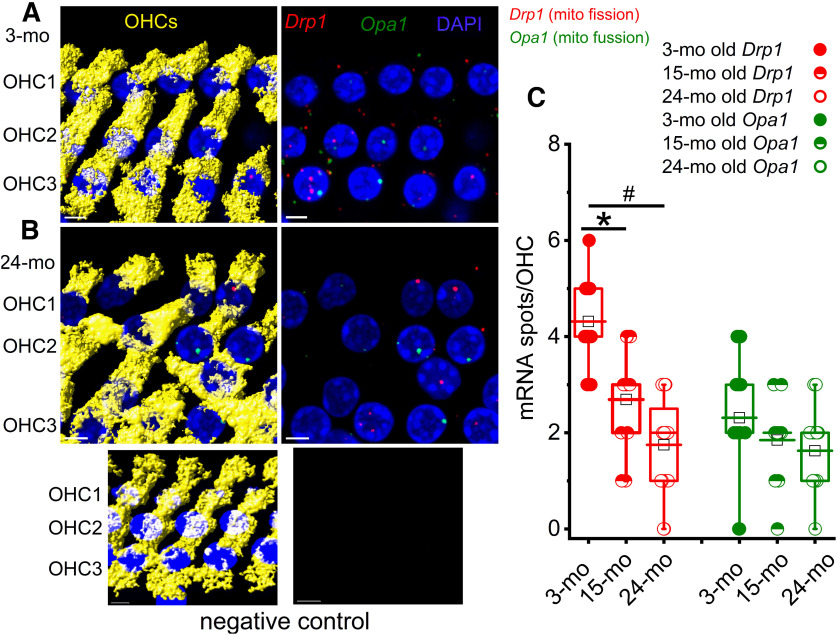
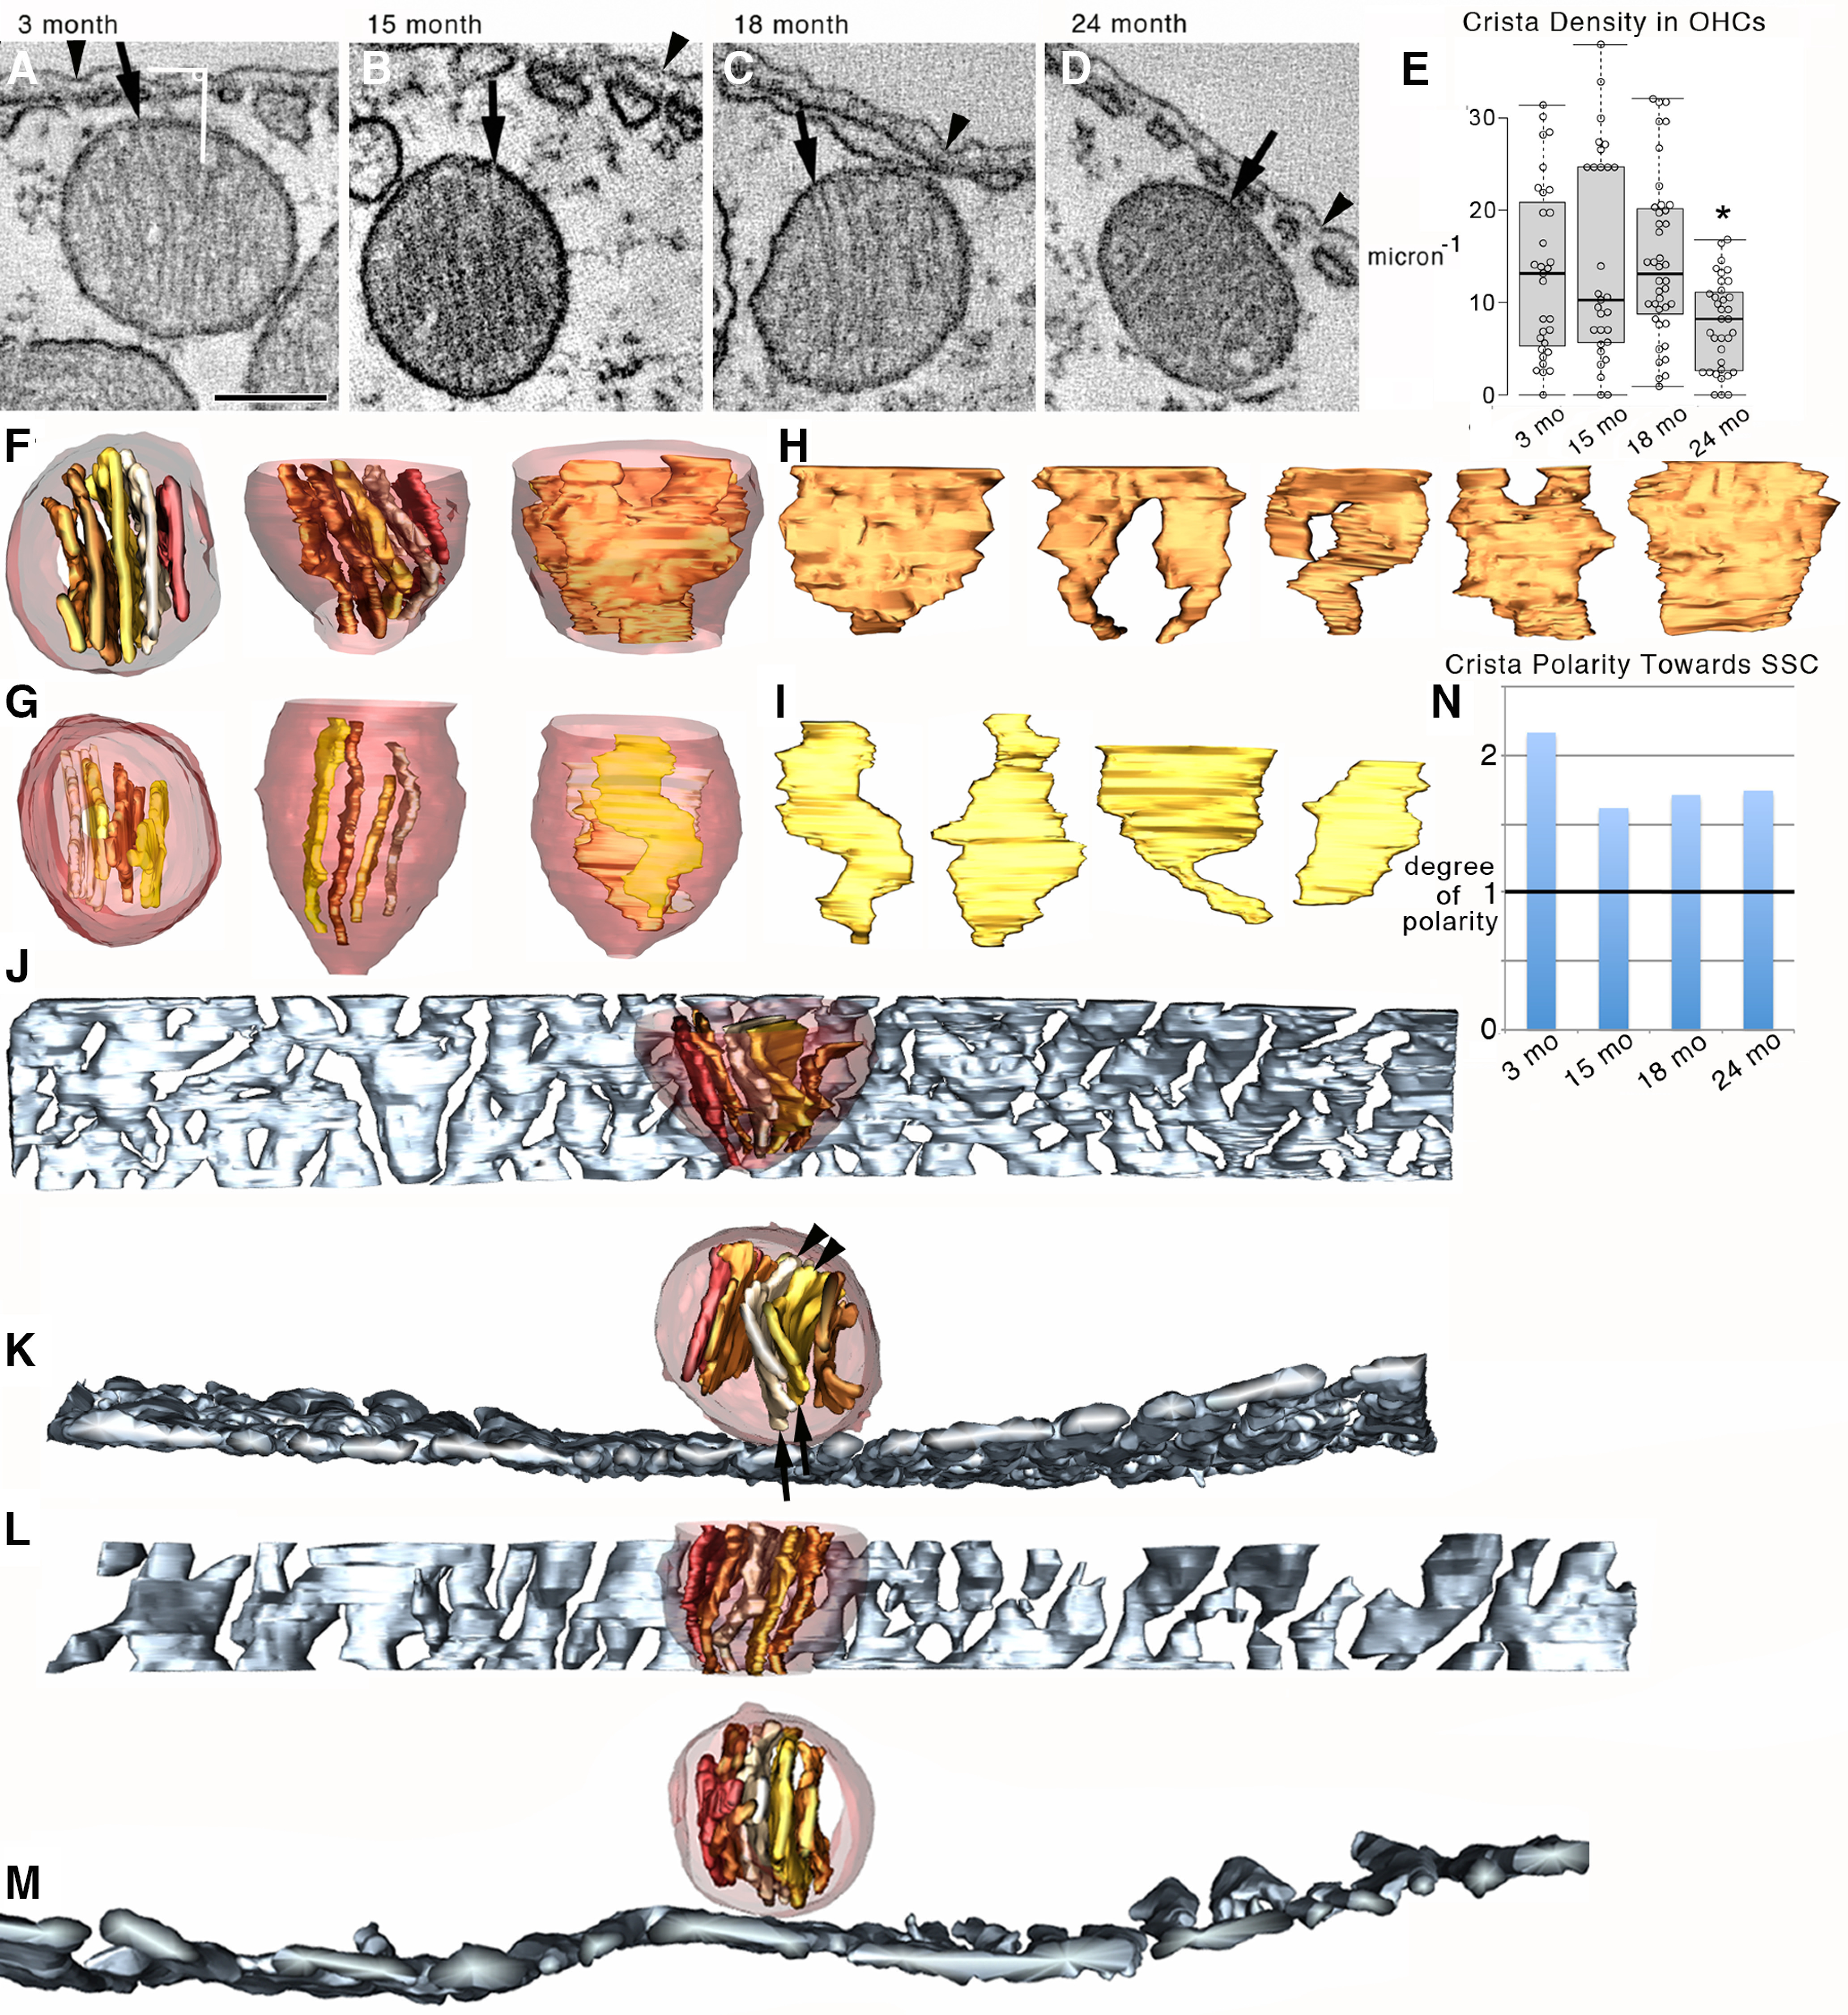
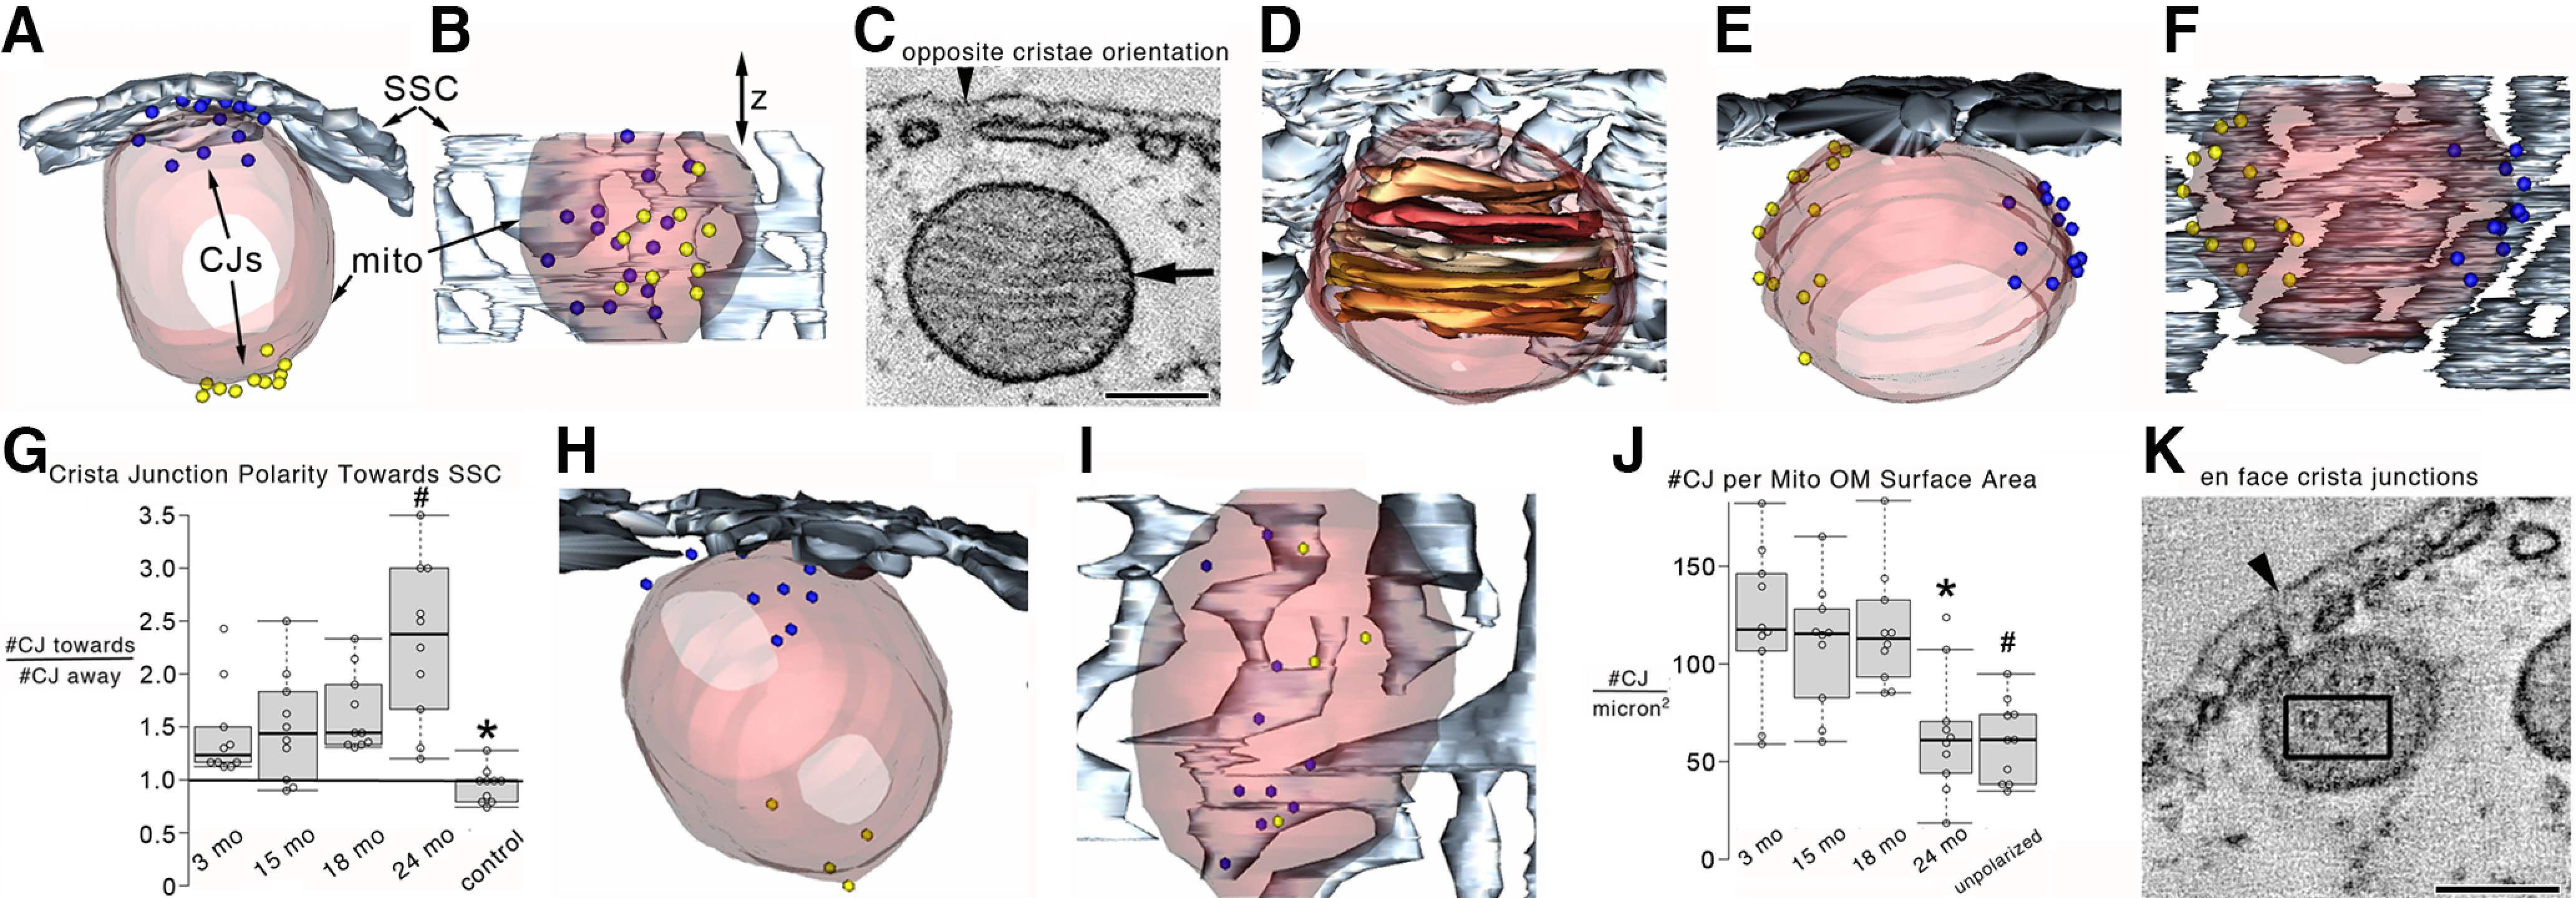
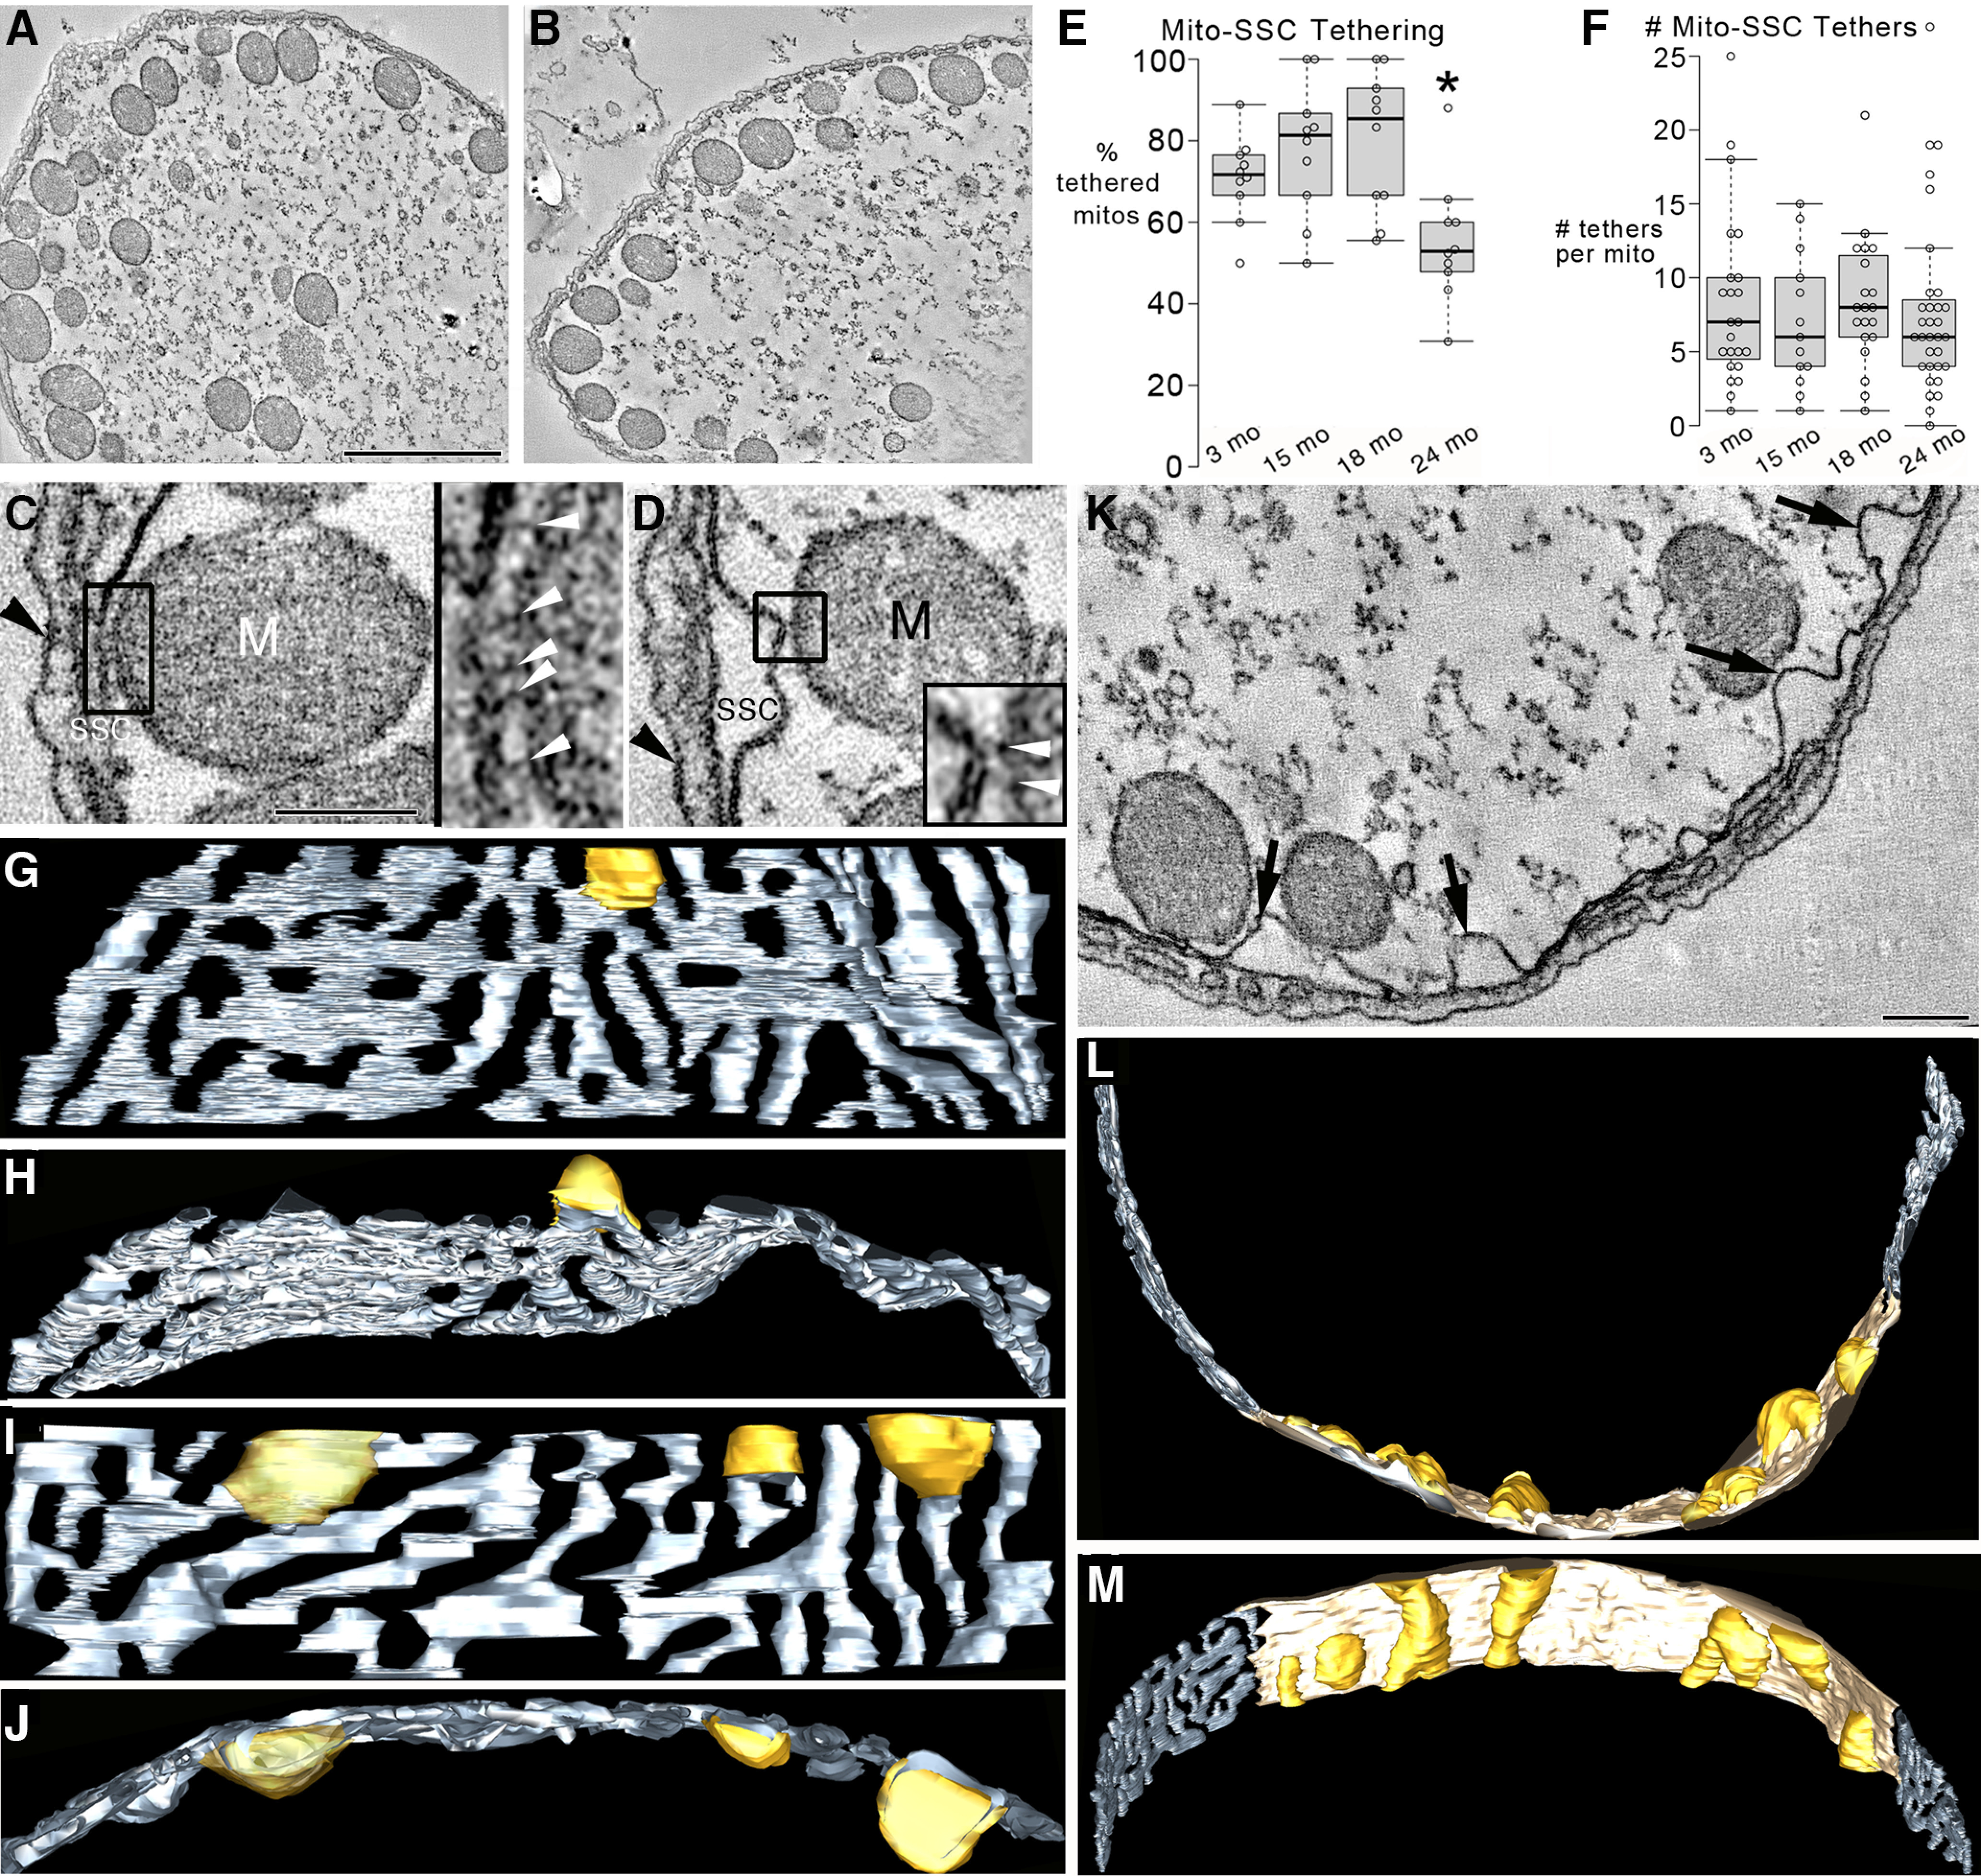
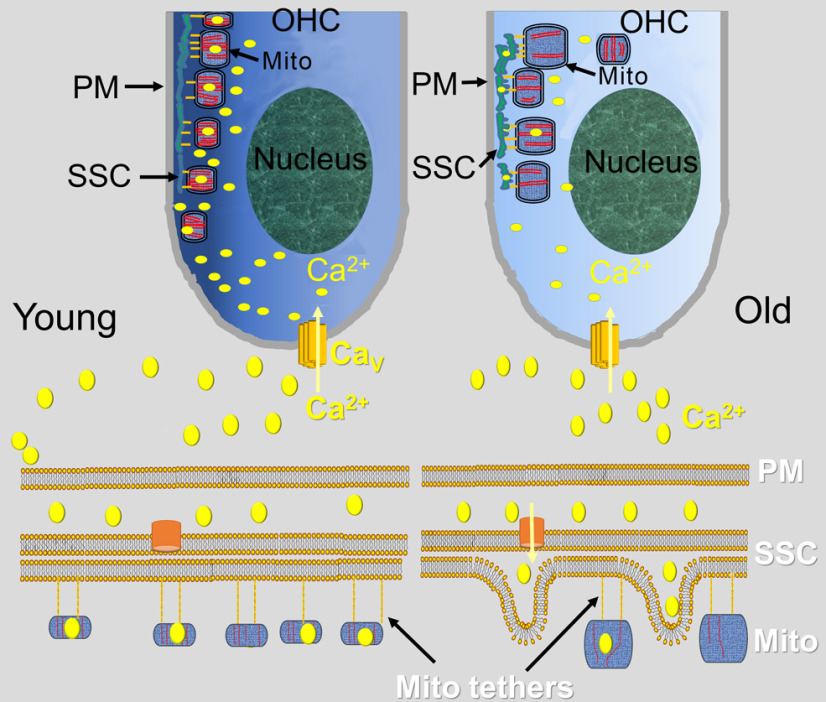
Organelle crosstalk is vital for cellular functions. The propinquity of mitochondria, ER, and plasma membrane promote regulation of multiple functions, which include intracellular Ca2+ flux, and cellular biogenesis. Although the purposes of apposing mitochondria and ER have been described, an understanding of altered organelle connectomics related to disease states is emerging. Since inner ear outer hair cell (OHC) degeneration is a common trait of age-related hearing loss, the objective of this study was to investigate whether the structural and functional coupling of mitochondria with subsurface cisternae (SSC) was affected by aging. We applied functional and structural probes to equal numbers of male and female mice with a hearing phenotype akin to human aging. We discovered the polarization of cristae and crista junctions in mitochondria tethered to the SSC in OHCs. Aging was associated with SSC stress and decoupling of mitochondria with the SSC, mitochondrial fission/fusion imbalance, a remarkable reduction in mitochondrial and cytoplasmic Ca2+ levels, reduced K+-induced Ca2+ uptake, and marked plasticity of cristae membranes. A model of structure-based ATP production predicts profound energy stress in older OHCs. This report provides data suggesting that altered membrane organelle connectomics may result in progressive hearing loss.

Keywords: calcium homeostasis; deafness; hearing loss; inner ear; mitochondria; outer hair cells.


Conflict of interest statement

The authors declare no competing financial interests.

Figures

Figure 1.
Figure 1.
ABR and DPOAE thresholds were increased in aged CBA/CaJ mice, and mitochondrial Ca2+ levels and ability to respond to K+ stimulation were reduced in old (15-24 month) OHCs. A, Average ABR threshold for click sounds at five different ages (3-24 months; n = 17 mice). Significant threshold elevation was seen in 18 and 24 month mice. *p = 3 × 10−5 between 18 and 3 months. #p = 7 × 10−7 between 24 and 3 months. B, Average ABR thresholds using tone pips at 4, 8, 16, and 32 kHz in CBA/CaJ mice (n = 17 mice). ANOVA was used to test for differences in age populations. *p = 0.0012 between 24 and 3 months at 8 kHz. #p = 2.0 × 10−5 between 24 and 3 months at 16 kHz. @ p = 0.001 between 18 and 3 months at 32 kHz. &p = 1 × 10⁻⁵ between 24 and 3 months at 32 kHz. C, DPOAE thresholds for 3, 15, and 24 month CBA/CaJ mice. *p = 1 × 10−5 between 24 and 3 months at 8 kHz. #p = 2 × 10−4 between 24 and 3 months at 16 kHz. D, Representative fluorescence images of 3, 15, and 24 month OHCs from the apical cochlear turn loaded with the Ca2+ dye OGB 488 BAPTA-1 AM (green). Scale bar, 1 µm. Rectangular boxes represent the regions of SSC-associated mitochondria labeled with TMRM (red) from which the total fluorescence was measured (data from 16 mice with ABR and DPOAE records in A–C). E, Relative mitochondrial Ca2+ fluorescence at low (•) and high (•) baseline Ca2+ levels and in young (3 month; •) and old (24 month; •) OHCs. ΔF/F0 = [F (t) – F (0)]/F(0), t is time, F(t) is OGB fluorescence following stimulation (external K+) and F(0) is the prestimulus fluorescence. Post hoc comparisons using the Tukey HSD test indicated that the means of data from low, high, young, and old OHC mitochondria were all significantly different. The population means were significantly different. F(3,80) = 968, p = 0.0009. n = 21 OHCs from 21 cochleae. Inset, Example of sub-PM regions in which cytoplasmic and mitochondrial Ca2+ was measured (indicated with white arrows). Ca2+ levels in regions marked by TMRM (red) were intense compared with the bulk cytoplasmic Ca2+ levels. Scale bars: top, 1 µm; bottom, 2 µm. F, Effects of high external K+ (20 mm) on mitochondrial Ca2+ (OGB) fluorescence intensities and after washout with lower (5 mm) K+. Dashed blue vertical lines indicate the time point of the addition of 20 mm K+ solution (left line) and the time point of the washout with a 5 mm K+ solution (right line). Solid curve fits the 9 data points for 3, 15, and 24 month infranuclei (IN) mitochondria. Dashed curve fits the 9 data points for 3, 15, and 24 month supranuclei mitochondria. The fluorescence intensity measurements were evaluated in mitochondria that remained in focus throughout the imaging period. Error bars represent standard deviation in all panels.
Figure 2.
Figure 2.
Mitochondria were substantively depolarized in 24 month OHCs. A, TMRM fluorescence micrographs represent frames of fluorescence intensities in 3 month (top) and 24 month OHCs (bottom). Images were captured using identical confocal settings after background subtraction. Scale bar, 3 µm. B, Mitochondrial membrane potential (Δψm) measurements, showing a representative time course of TMRM fluorescence intensities made from 3, 15, and 24 month apical OHCs. FCCP (1 mm) was applied at the time indicated with an arrow and the time course of decay of mitochondrial potential for various aged OHCs was fitted with a single exponential decay time constant (t) for each age as shown beside the plots using color codes as represented in the graph. ΔF is arbitrary fluorescence units. C, D, Summary data (mean ± SEM) of the fluorescence intensities and the decay time constant after application of FCCP (n = 13 OHCs from 3 cochleae for each of 3, 15, and 24 month CBA/CaJ mice). C, The population means were significantly different. F(2,36) = 56.7, *p = 6.0 × 10−5 comparing 24 month with 3 month. D, The population means were significantly different. F(2,36) = 187, *p = 1.0 × 10−35 comparing 24 month with 3 month.
Figure 3.
Figure 3.
OHCs in a CBA/CaJ mouse model exhibited pathology because of aging. A, TEM image of a 3 month OHC to demonstrate normal ultrastructure. Mitochondria were prevalent, and their density was noticeably higher in three regions: (1) surrounding the nucleus, (2) nestled against the cuticular plate, and (3) adjacent to the SSC. Black lines on either side indicate the region between the nucleus and cuticular plate used for the mitochondrial and SSC analyses in Figures 5–8 and Table 1; >80% of mitochondria in this region was positioned within 0.5 µm of the lateral plasma membrane. Magenta line indicates the area occupied by the Hensen’s body. B, Aged OHC pathology. The TEM image of a 24 month OHC with loss of cytoplasmic density such that it is uniform throughout. Magenta line encircling the Hensen’s body indicates decreased complexity of this structure, including decreased size as well as density. The OHC has also detached from the Deiters’ cup and synapses. The increased thickness/width of the OHC is an observed consequence of the detachment. C, By 24 months, some OHCs still appear relatively normal (*). However, detachment from the Deiters’ cup and nerve terminals, as well as the presence of an autophagosome (au) and swollen mitochondria, is noted in this OHC. In contrast, other OHCs (Ig, black arrow) had extensive features of cell death or have disappeared. In this OHC (lg, black arrow), there is a loss of plasmalemma integrity (white arrow), autophagosome (au), and multilamellar bodies (mlb) and an overall loss of organelles, such as mitochondria. D, Further pathology was seen at 24 months with two degenerating synapses (arrows) and a loss of cytoplasmic components below the synapses in an efferent nerve terminal impinging on the basal portion of an OHC. However, synaptic membrane specializations remained in the OHC. B, From a different 24 month cochlea than C and D. E, Representative example of the OHC cut in cross-section to the length of the OHC cylindrical shape. The complement of mitochondria (white arrows) aligned along the SSC was used for the energy calculations (Table 1). In contrast, mitochondria in the interior of the OHC (black arrow) were ignored for purposes of the energy calculations. DC, Deiters’ cell. n = 4, 5, and 3 mice with 1 cochlea used per mouse for 3, 18, and 24 months, respectively; n = 29, 25, and 25 OHCs for 3, 18, and 24 months, respectively.
Figure 4.
Figure 4.
Mitochondrial size and number were altered in aged OHCs in a CBA/CaJ mouse model. A–D, Mitochondria had increased size at 18 and 24 months. A, A 1.6-nm-thick slice near the middle of a tomographic volume of 3 month OHC showing two mitochondria about the same size as (B) 15 month mitochondria. Arrowheads indicate the lateral plasma membrane for positional reference. Scale bar: A–D, 250 nm. C, In contrast, 1.6-nm-thick slices through tomographic volumes of 18 and 24 month OHCs (D) show mitochondria that appear larger. E, The volume of mitochondria was significantly larger in 18 and 24 month OHCs (n = 20 mitochondria from 3 mice at each age). *p = 1.8 × 10−5, 0.0042 comparing 3 months with 18 and 24 months, respectively. p = 1.5 × 10−7, 0.0021 comparing 15 months with 18 and 24 months, respectively. F. No significant change in mitochondrial volume density was found on aging. Data are mean ± SEM. n = 10 OHCs from 3 mice for each age. G, However, there appeared to be a greater number of mitochondria in 3 month OHCs compared with (H) 18 month OHCs in the same-size cytoplasmic area. Scale bar: G, H, 300 nm. I, The number of mitochondria per cytoplasmic volume had dropped significantly by 18 months and remained low at 24 months. n = 9 OHCs from 3 mice for each age. *p = 0.0037, 0.0053 comparing 3 months with 18 and 24 months, respectively. p = 0.012, 0.020 comparing 15 month with 18 and 24 months, respectively. For E, F and I, each data point is represented by a circle. The box-and-whisker plots show median, quartiles min and max.
Figure 5.
Figure 5.
The number of Drp1 RNA molecules, but not Opa1 RNA molecules, was significantly reduced in 24 month compared with 3 month OHCs. Expression and localization of Drp1- and Opa1-encoding transcripts in OHCs were examined using smFISH in excised whole-mount preparations of the organ of Corti isolated from 3 and 24 month mice. A, B, Single RNA molecules encoding for Drp1 (A) and Opa1 (B) and no probe controls (bottom, inset) were detected as fluorescent puncta (red represents Drp1), and (green represents Opa1) in myosin7A-positive (yellow) OHC cell bodies. Images are presented as z projections through a stack of confocal micrographs. For easier visualization of fluorescently labeled mRNA molecules, identical views are provided without OHC labels. C, The mean number of single RNA molecules detected per OHC was calculated as described in Materials and Methods. Median quartile and extreme expression values are provided for 3, 15, and 24 month OHCs. For Drp1, the population means were significantly different. F(2,42) = 28.7, *p = 1.4 × 10−8 comparing 3 and 15 months, n = 16 (3 month), 13 (15 month), and 16 (24 month) OHCs from 8 cochleae. #p = 1.5 × 10−4 comparing 3 and 24 months. For Opa1, the population means were not significantly different. F(2,42) = 2.23, p = 0.12, n = 16 (3 month), 13 (15 month), and 16 (24 month) OHCs from 8 cochleae.
Figure 6.
Figure 6.
Cristae tended to be polarized toward the SSC in the OHC at all ages examined. A–D, 3DEM shows that OHC mitochondria have lamellar cristae. The density of cristae appeared similar at 3, 15, and 18 months, yet lower at 24 months. Shown are 1.6-nm-thick slices near the middle of each tomographic volume. Arrowheads indicate the lateral plasma membrane for positional reference. Arrows indicate crista junctions. White line segments and angle symbol represent the method for measuring crista polarization toward the SSC as used for N. Scale bar: A–D, 200 nm. E, The crista density was significantly lower for 24 month OHC mitochondria. n = 32, 29, 40, and 32 mitochondria for 3, 15, 18, and 24 months, respectively, from 3 mice per age group. Each data point is represented by a circle. The box-and-whisker plots show median, quartiles min and max. *p = 0.0040, 0.0035, 4.5 × 10−4 comparing 24 months with 3, 15, and 18 months, respectively. F, Orthogonal views (top → side → side perpendicular) of a surface-rendered mitochondrial volume from an 18 month OHC show the extent the cristae occupy the volume and cristae orientation. Transparent maroon represents outer membrane. Shades of brown represent cristae. G, Orthogonal views of a surface-rendered 24 month mitochondrial volume show a similar orientation, but that the cristae occupy less of the mitochondrial volume compared with the 18 month example. H, All 5 cristae from the 18 month mitochondrion displayed in the same orientation to show their shape and size. I, All 4 cristae from the 24 month mitochondrion displayed in the same orientation to demonstrate that they are smaller and fewer in number compared with the 18 month example, revealing how the crista density has been reduced at 24 months. J, Side view of a surface-rendered 3 month mitochondrial volume shown with the surface-rendered SSC closest to the mitochondrion (slate gray). K, Top view of the same volume showing that the cristae align so that one end tends to face the SSC. Sometimes, when the cristae orient in a direction pointing away from the SSC at the far end (arrowheads), they will curve back to align facing the SSC at the near end (arrows). L, M, Side and top views of a surface-rendered 18 month volume showing the near-perfect alignment of cristae facing the SSC. N, The degree of polarity (see Materials and Methods) shows significant polarization of cristae toward the SSC in mitochondria adjacent to it for all ages with the strongest value (>2) for 3 months. The black line at “1” signifies a random orientation. For reference, the degree of polarity values close to zero would indicate an opposite cristae polarization (e.g., the cristae orientation in Fig. 7C). χ2 test p = 1.1 × 10−5, 0.0013, 0.029, and 0.0014 for 3, 15, 18, and 24 months, respectively (3 mice per age group), showing a >95% confidence level of nonrandom orientation of cristae with respect to the SSC for mitochondria positioned near it.
Figure 7.
Figure 7.
Crista junctions tended to be polarized toward the SSC for mitochondria positioned near it in the OHC at all ages examined. A, Top view of a surface-rendered mitochondrial volume from a 15 month OHC shows the positioning of a greater number (15) of crista junctions facing toward the SSC (blue spheres with a diameter the mean of the crista junction opening) than facing away (10; yellow spheres with the same diameter) from the SSC. Transparent maroon represents outer membrane. Slate gray represents SSC. B, Side view showing that there is no clustering of crista junctions in the z direction. C, A 1.6-nm-thick slice near the middle of a 15 month OHC tomographic volume showing cristae with an orientation opposite to those shown in Figure 6. Arrowhead indicates the lateral plasma membrane for positional reference. Arrow indicates a crista junction. Scale bar, 200 nm. D, The volume now surface-rendered shows the 3D orientation of the cristae (shades of brown) in relation to the SSC. E, Top view of the surface-rendered volume showing the 3D arrangement of nearly equal crista junctions on either side (13 blue, 12 yellow). F, Side view of the surface-rendered volume providing a different perspective of the 3D crista junction distribution around the mitochondrial periphery. G, The ratio of the number of crista junctions facing toward the SSC to those facing away in mitochondria with polarized cristae (see Fig. 6) shows a significant polarization toward the SSC. The black line at “1” signifies a random orientation. Control mitochondria from the same volumes were those with either the opposite cristae orientation (Fig. 7C) or mitochondria located in the ROI (Fig. 2A, black lines) far from the SSC. Because no difference was noticed between ages, they were grouped for analysis. These mitochondria exhibited no crista junction polarization between sides with little variance (0.97 ± 0.05). ANOVA with Bonferroni correction post hoc comparing control with age groupings of polarized mitochondria indicated that the crista junction polarization was statistically significant and that the 24 month crista junctions were significantly more polarized than the 3, 15, and 18 month crista junctions. n = 10 mitochondria each for 3, 15, 18, and 24 months polarized and control from 3 mice for each age. *p = 0.0097, 0.011, 2.3 × 10−4, and 3.3 × 10−4 comparing 3, 15, 18, and 24 months with control, respectively. #p = 0.0074, 0.014, and 0.027 comparing 24 months with 3, 15, and 18 months, respectively. H, Top view and (I) side view of a 24 month volume showing a mitochondrion adjacent to the SSC with its crista junctions. There appeared to be fewer and smaller crista junctions. J, The number of crista junctions normalized to the mitochondrial outer membrane surface area was significantly lower at 24 months. Moreover, the control (unpolarized) mitochondria had a significantly lower number of crista junctions. n = 10 mitochondria each for 3, 15, 18, and 24 months polarized and unpolarized from 3 mice for each age. *p = 0.0024, 0.0051, and 0.0011 comparing 24 months with 3, 15, and 18 months, respectively. #p = 7.5 × 10−4, 9.9 × 10−4, and 1.5 × 10−4 comparing 3, 15, and 18 months with unpolarized, respectively. K, Occasionally, EM tomography provides an en face view of crista junctions, as seen in this 15 month OHC mitochondrion example. Three crista junctions are seen inside the black box. Each shows a circular opening of relatively uniform size, thus confirming the expected crista junction architecture. Scale bar, 200 nm. For G and J, each data point is represented by a circle. The box-and-whisker plots show median, quartiles min and max.
Figure 8.
Figure 8.
The tethering of mitochondria to the OHC SSC by thin filaments was decreased, and SSC stress was observed at 24 months. A, Fewer mitochondria were positioned adjacent to the SSC in the 24 month OHC compared with younger OHCs (B, 15 month shown). Scale bar, 1 μm. C, Nearly all mitochondria adjacent to the SSC were tethered by thin filaments ∼5-10 nm in diameter, found consistently for 3, 15, 18, and 24 month OHCs. Typically, there were multiple tethers for each mitochondrion-SSC coupling. An example is the 5 filamentous tethers shown inside the black-boxed region of a slice through the middle of a 24 month OHC volume and expanded 3× in the right inset. White arrowheads indicate filaments. M, Mitochondrion. Black arrowhead indicates the cell membrane. Scale bar, 200 nm. D, The mitochondrion-SSC tethering persisted even when the SSC was swollen. An example is the tethering by two filaments seen inside the black-boxed region and expanded 3× in the bottom right inset. White arrowheads indicate filaments. Appreciable SSC swelling was only observed at 24 months. E, The percentage of mitochondria tethered to the SSC by thin filaments in the ROI OHC cytoplasm was lower at 24 months compared with younger mice. n = 10 OHCs from 3 mice for each age for 3, 15, 18, and 24 months. *p = 0.020, 0.0053, and 0.0034 comparing 24 months with 3, 15, and 18 months, respectively. F, However, there was no difference in the number of tethers per mitochondrion positioned adjacent to the SSC across ages. n = 23, 13, 20, and 32 mitochondria each for 3, 15, 18, and 24 months, respectively (3 mice for each age). G, A range of SSC swelling was found at 24 months. The SSC mesh (slate gray) appeared normal in this surface-rendered volume except for an unusual swelling (golden rod) seen in this side view. H, A top view of the SSC mesh showing protruding of the swelling into the OHC cytoplasm. I, A second mouse shows more SSC swelling (3 swellings) with the top view (J), indicating that the swellings have different sizes. K, A slice through an OHC volume from a third mouse shows even more extensive SSC swelling (arrows). Scale bar, 200 nm. L, An unusual remodeling of the SSC has occurred, producing a continuous double-membrane sheet (lamella) for only the portion of the SSC (tan) that displays swellings (golden rod) in this top view of the surface-rendered volume. M, A side view showing the 7 extensive swellings of the SSC lamella and the normal-appearing SSC mesh to either side of the abnormal SSC.
Figure 9.
Figure 9.
Schematic diagrams represent how altered organelle connectomics in the OHC may contribute to progressive HL. The PM, SSC, and mitochondria are part of the OHC’s Ca2+-regulating machinery; and in the young animal, Ca2+ homeostasis is maintained. Mitochondria tethered to the SSC have cristae polarized toward it. In contrast, the old animal exhibits SSC stress, mitochondrial fission/fusion imbalance, and a remarkable reduction in mitochondrial and cytoplasmic Ca2+ levels. When extracellular K+ is elevated, Ca2+ enters the cell through the Cav and is uploaded into the SSC-tethered mitochondria. In the old animal, there is reduced K+-induced mitochondrial Ca2+ upload, enlarged, yet fewer mitochondria, fewer cristae, SSC swelling, and fewer mitochondria tethered to the SSC. The altered Ca2+ homeostasis underpins the candidate hypothesis that disruption of organelle connectomics is a mechanism for HL. PM, Plasma membrane; mito, mitochondrion; Cav, voltage-gated Ca2+ channel.

Similar articles

Cited by

  • Mitochondrial morphology governs ATP production rate.
    Garcia GC, Gupta K, Bartol TM, Sejnowski TJ, Rangamani P. Garcia GC, et al. J Gen Physiol. 2023 Sep 4;155(9):e202213263. doi: 10.1085/jgp.202213263. Epub 2023 Aug 24. J Gen Physiol. 2023. PMID: 37615622 Free PMC article.
  • A Cristae-Like Microcompartment in Desulfobacterota.
    McGlynn SE, Perkins G, Sim MS, Mackey M, Deerinck TJ, Thor A, Phan S, Ballard D, Ellisman MH, Orphan VJ. McGlynn SE, et al. mBio. 2022 Dec 20;13(6):e0161322. doi: 10.1128/mbio.01613-22. Epub 2022 Nov 2. mBio. 2022. PMID: 36321837 Free PMC article.
  • Morphological principles of neuronal mitochondria.
    Mendelsohn R, Garcia GC, Bartol TM, Lee CT, Khandelwal P, Liu E, Spencer DJ, Husar A, Bushong EA, Phan S, Perkins G, Ellisman MH, Skupin A, Sejnowski TJ, Rangamani P. Mendelsohn R, et al. J Comp Neurol. 2022 Apr;530(6):886-902. doi: 10.1002/cne.25254. Epub 2021 Nov 1. J Comp Neurol. 2022. PMID: 34608995 Free PMC article.
  • Presbycusis: Pathology, Signal Pathways, and Therapeutic Strategy.
    Zhao X, Shen T, Cao S, Liu Z, Pang W, Li M, Liu J, Li W, Wu Y, Liu C, Xia M, Fu X, Cheng C. Zhao X, et al. Adv Sci (Weinh). 2025 Aug;12(29):e2410413. doi: 10.1002/advs.202410413. Epub 2025 May 11. Adv Sci (Weinh). 2025. PMID: 40349177 Free PMC article. Review.
  • Peripheral Auditory Nerve Impairment in a Mouse Model of Syndromic Autism.
    McChesney N, Barth JL, Rumschlag JA, Tan J, Harrington AJ, Noble KV, McClaskey CM, Elvis P, Vaena SG, Romeo MJ, Harris KC, Cowan CW, Lang H. McChesney N, et al. J Neurosci. 2022 Oct 19;42(42):8002-8018. doi: 10.1523/JNEUROSCI.0253-22.2022. Epub 2022 Sep 30. J Neurosci. 2022. PMID: 36180228 Free PMC article.

References

    1. Anand R, Strecker V, Urbach J, Wittig I, Reichert AS (2016) Mic13 is essential for formation of crista junctions in mammalian cells. PLoS One 11:e0160258. 10.1371/journal.pone.0160258 - DOI - PMC - PubMed
    1. Attwell D, Laughlin SB (2001) An energy budget for signaling in the grey matter of the brain. J Cereb Blood Flow Metab 21:1133–1145. 10.1097/00004647-200110000-00001 - DOI - PubMed
    1. Babu V, Vazirian S, Perkins G, Lysakowski A (2017) Energy output of mitochondria located near synaptic ribbons in inner ear hair cells. FASEB J 31:740–21..
    1. Bai U, Seidman MD, Hinojosa R, Quirk WS (1997) Mitochondrial DNA deletions associated with aging and possibly presbycusis: a human archival temporal bone study. Am J Otol 18:449–453. - PubMed
    1. Bawa B, Abbott LC (2008) Analysis of calcium ion homeostasis and mitochondrial function in cerebellar granule cells of adult CaV 2.1 calcium ion channel mutant mice. Neurotox Res 13:1–18. - PubMed

Publication types

LinkOut - more resources