. 2020 Oct 4;9(10):2237.
doi: 10.3390/cells9102237.

HDAC6 Regulates Radiosensitivity of Non-Small Cell Lung Cancer by Promoting Degradation of Chk1

Affiliations

HDAC6 Regulates Radiosensitivity of Non-Small Cell Lung Cancer by Promoting Degradation of Chk1

Niko Moses et al. Cells. .

Abstract

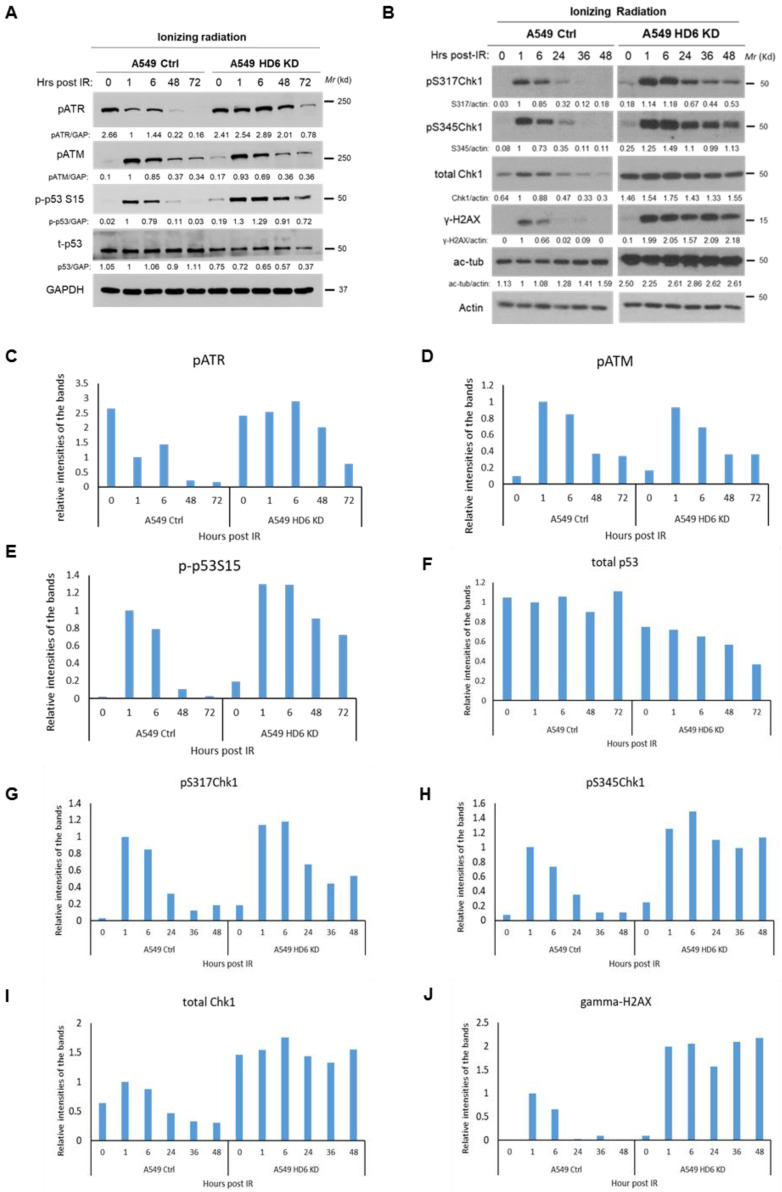
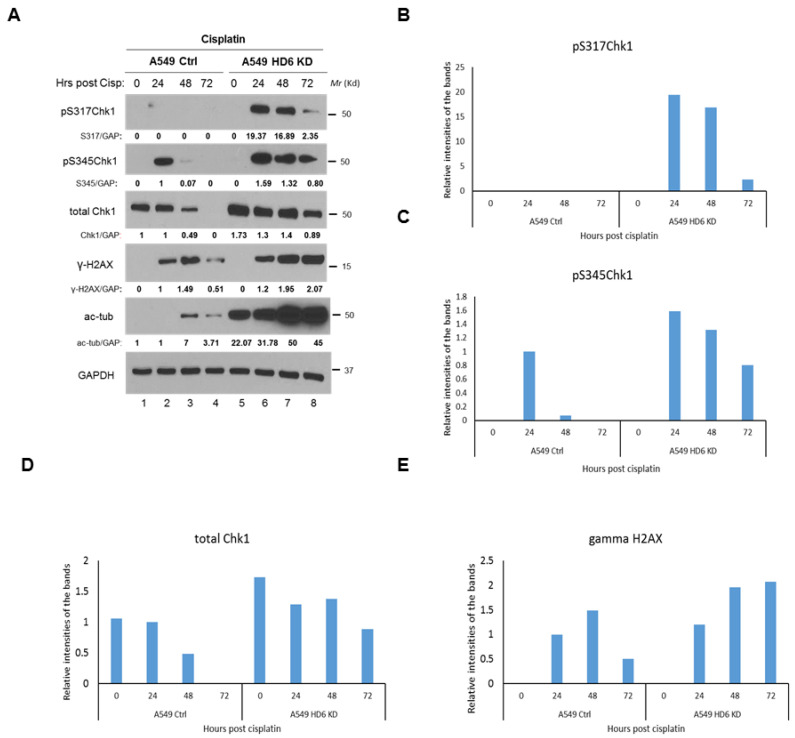
We have previously discovered that HDAC6 regulates the DNA damage response (DDR) via modulating the homeostasis of a DNA mismatch repair protein, MSH2, through HDAC6's ubiquitin E3 ligase activity. Here, we have reported HDAC6's second potential E3 ligase substrate, a critical cell cycle checkpoint protein, Chk1. We have found that HDAC6 and Chk1 directly interact, and that HDAC6 ubiquitinates Chk1 in vivo and in vitro. Specifically, HDAC6 interacts with Chk1 via the DAC1 domain, which contains its ubiquitin E3 ligase activity. During the cell cycle, Chk1 protein levels fluctuate, peaking at the G2 phase, subsequently resolving via the ubiquitin-proteasome pathway, and thereby allowing cells to progress to the M phase. However, in HDAC6 knockdown non-small cell lung cancer (NSCLC) cells, Chk1 is constitutively active and fails to resolve post-ionizing radiation (IR), and this enhanced Chk1 activity leads to preferential G2 arrest in HDAC6 knockdown cells accompanied by a reduction in colony formation capacity and viability. Depletion or pharmacological inhibition of Chk1 in HDAC6 knockdown cells reverses this radiosensitive phenotype, suggesting that the radiosensitivity of HDAC6 knockdown cells is dependent on increased Chk1 kinase activity. Overall, our results highlight a novel mechanism of Chk1 regulation at the post-translational level, and a possible strategy for sensitizing NSCLC to radiation via inhibiting HDAC6's E3 ligase activity.

Keywords: DNA damage response (DDR); checkpoint kinase 1 (Chk1); histone deacetylase 6 (HDAC6); ionizing radiation (IR); ubiquitin E3 ligase; ubiquitination.


Conflict of interest statement

The authors declare no conflict of interest.

Figures

Figure 1
Figure 1
HDAC6 knockdown (KD) sensitizes several NSCLC cell lines to ionizing radiation (IR). (A) Smaller fractions of viable cells were found in the A549 HDAC6 KD (HD6 KD) cell line as compared to the A549 control cell line upon IR treatment. Left panel: Western blot confirming HDAC6 knockdown in A549 cells. Right panel: 120 h post-IR, A549 control and HDAC6 stable knockdown cells were suspended in trypan blue. The number of unstained cells (viable), stained cells (non-viable), and total numbers were recorded. Three biological replicates are graphed. Student’s t-tests were performed. * p = 0.0122, ** p = 0.0099, *** p = 0.0021. (B) Smaller fractions of viable cells were found in the H460 HD6 KD cell line as compared to the control cell line upon IR treatment. Left panel: Western blot confirming HDAC6 knockdown in H460 cells. Right panel: H460 stable HDAC6 knockdown cells were either left untreated, or treated with 10 Gy IR. 120 h later, trypan blue staining was conducted as described in (A). Student’s t tests were performed; * p = 0.0154. (C) Smaller fractions of viable cells were found in the H1299 HDAC6 inducible cell line (H1299i, Dox+) as compared to the control cell line (H1299i, Dox−). Left panel: Western blot confirming inducible HDAC6 knockdown in H1299i cells pre-treated with doxycycline (Dox) for two weeks. Right panel: H1299i cells were either left untreated, or treated with 10 Gy IR. 120 h later, trypan blue staining was conducted as described in (A). Student’s t tests were performed, * p = 0.0002. (D) Decreased numbers of colonies were observed in A549 HDAC6 inducible knockdown cells (A549i, Dox+) as compared to the control cells (A549i, Dox−). Cells were plated in 6-well plates at a concentration of 300 cells/well, incubated for 24 h, and irradiated with the indicated dose. 14 days later, cells were stained with crystal violet. Student’s t tests were peformed; * p < 0.02, ** p < 0.005. Error bars, S.D. (E) Representative images from the experiments performed in (D).
Figure 2
Figure 2
HDAC6 knockdown A549 cells arrest at G2/M phase post-IR. (A) A549 control cells (Ctrl) and A549 HDAC6 stable knockdown cells (HD6 KD) were either left untreated (No Tx, blue histograms) or irradiated with 10 Gy, incubated for 72 h (red histograms), harvested, ethanol fixed, and stained with PI. Cells were then analyzed via flow cytometry. (B) Analysis of the fractions of sub-G1 cells present in the experiments described in (A). Statistical significance was assessed using Student’s t test, with * p < 0.05. (C) Analysis of the cell cycle distribution from the experiments described in (A). (D) A549 control and HDAC6 stable knockdown cells were treated with 10 Gy IR at the indicated time points, and then the cells were stained with immunofluorescence for cyclin A. Results of cyclin A positivity from three biological replicates in these two cell lines were assessed for statistical significance using Student’s t test, with * p < 0.05 and ** p < 0.01. (E) Representative images of the data graphed in (D).
Figure 3
Figure 3
Examination of DDR markers in A549 control and A549 HDAC6 knockdown cells post-IR. A549 control and HDAC6 knockdown cells were irradiated with a dose of 10 Gy, harvested at the indicated time points, and the lysates were analyzed via Western blot by a series of antibodies: anti-pATR, anti-pATM, anti-p-p53S15, anti-total p53, and anti-GAPDH in (A) or by anti-pS317Chk1, anti-pS345Chk1, anti-total Chk1, anti-γ-H2AX, anti-acetylated tubulin (ac-tub) and anti-actin in (B). Blots were quantified via ImageJ, and reported quantification was normalized to the signal of the A549 control cells 1 h post-IR. The bar graphs for the expression of indicated DDR proteins are shown in (CJ).
Figure 4
Figure 4
Examination of DDR markers in A549 control and A549 HDAC6 knockdown cells post-Etoposide treatment. (A) A549 control and HDAC6 knockdown cells were treated with 20 μM Etoposide, harvested at the indicated time points, and the lysates were analyzed via Western blot by a series of antibodies: anti-pS317Chk1, anti-pS345Chk1, anti-total Chk1, anti-γ-H2AX, anti-acetylated tubulin, and anti-GAPDH. Blots were quantified via ImageJ, and reported quantification was normalized to the signal of the A549 control cells 6 h post-Etoposide. The bar graphs for the expression of indicated DDR proteins are shown in (BE).
Figure 5
Figure 5
Examination of DDR markers in A549 control and A549 HDAC6 knockdown cells post-Cisplatin treatment. (A) A549 control and HDAC6 knockdown cells were treated with 10 μM Cisplatin, harvested at the indicated time points, and lysates were analyzed via Western blot by a series of antibodies: anti-pS317Chk1, anti-pS345Chk1, anti-total Chk1, anti-γ-H2AX, anti-acetylated tubulin, and anti-GAPDH. Blots were quantified via ImageJ, and reported quantification was normalized to the signal of the A549 control cells 24 h post-Cisplatin treatment, except for the pS317Chk1 bands whose normalization was chosen randomly. The bar graphs for the expression of indicated DDR proteins are shown in (BE).
Figure 6
Figure 6
The depletion or inhibition of Chk1 in HDAC6 knockdown A549 cells restores radio-resistance. (A) Establishment of Chk1 knockdown cells in A549 HDAC6 knockdown cells (termed HDAC6KD+Tripz) was described in the Methods. Anti-HDAC6 and anti-Chk1 Western blotting analyses were performed to confirm the efficacy of HDAC6 and Chk1 double knockdown. Anti-pCDC25C, anti-ac-tub, and anti-GAPDH Western blotting analyses were also performed. Representative images of the data graphed Blots were quantified via ImageJ. For HDAC6, the reported quantification was normalized to the signal of the Control group. For the rest of the proteins, the reported quantification was normalized to the signal of the HDAC6 knockdown group. HDAC6KD+Tripz and HDAC6KD cells were plated in triplicate at a concentration of 150 cells/well and treated with the indicated dose of radiation. Cells were incubated for 12 days, fixed with crystal violet. The representative images are shown in (B). The colonies were quantified. Student t test, * p < 0.05, ** p < 0.0008. A bar graph presenting the above colony formation assays is shown in (C). HDAC6KD+Tripz and HDAC6KD cells were treated with 5Gy IR, and the immunofluorescence for Cyclin A was conducted. Representative images are shown in (D). Results of Cyclin A positivity from three experimental replicates, with significance assessed using student’s t test, with * p < 0.01, ** p = 0.0001. A bar graph representing cyclin A positive cells is shown in (E). (F) A549 HDAC6 stable knockdown cells were pre-treated with 0.25 μM of potent Chk1 inhibitor CHIR-124 prior to 10 Gy irradiation. At the indicated time points, cells were harvested and probed for the indicated proteins via Western blot. Blots were quantified via ImageJ, and normalized to the signal of the 0 h timepoint of the HDAC6 knockdowns treated with IR alone.
Figure 7
Figure 7
HDAC6 influences Chk1 protein stability. (A) (From left to right) A549 HDAC6 KO cells generated with the CRISPR-Cas9 system. H157 and H1975 HDAC6 KO cells generated with the CRISPR-Cas9 system. H1299 and A549 inducible HDAC6 knockdown cells (termed H1299i and A549i, respectively) pre-treated with doxycycline for two weeks. Mouse embryonic fibroblasts (MEFs) harvested from age-matched wild-type and HDAC6 KO mice (both from a C57Bl/6 background). Liver, kidney, lung, heart, spleen, and brain tissue harvested from age-matched wild type and transgenic HDAC6 KO mice (both from a C57Bl/6 background). All cell lines and tissues were lysed and analyzed via Western Blot for Chk1, HDAC6, acetylated tubulin, and GAPDH expression. The bands for Chk1, HDAC6, and ac-tubulin were quantified. (B) The relative expression of Chk1 from the cell lines and mouse tissues has been shown in a bar graph with logarithmic y-axis. (C) Chk1 RT-PCR was used to determine whether the depletion of HDAC6 influences Chk1 mRNA levels in A549 control and HDAC6 stable knockdown cells, as well as WT and HDAC6 knockout murine lung tissue. GAPDH RT-PCR was used as a loading control. (D) (Above) A549 stable knockdown cells were treated with 10 μg/mL cycloheximide (CHX), harvested at the indicated time points, and analyzed via Western blot. Representative Western blot of Chk1 and GAPDH from the trials was used to determine Chk1 half-life. (E) The average intensity of Chk1 relative to GAPDH expression from three independent experiments was obtained (via ImageJ) and graphed. The student t test was performed. Error bars represent S. D. * p < 0.05. (F) 293T HDAC6 knockout cells were plated, and 24 h later were untransfected or transfected with 2.4 μg HA-tagged HDAC6, harvested at the indicated time points and probed for the indicated proteins. HA-HDAC6 was detected using anti-HDAC6 antibody. Fold-change in Chk1 expression was evaluated via ImageJ.
Figure 8
Figure 8
HDAC6 ubiquitinates Chk1 in vitro and in vivo. (A) HDAC6 ubiquitinates Chk1 in vitro. (A) The in vitro Ub assays were carried out in the presence of E1, E2, Ub, His-Chk1, Flag-HDAC6 in the absence or presence of ATP. The reactions were incubated at 37 °C for 2 h, denatured at 95 °C for 5 min, then added protein loading buffer. The reactions were loaded into SDS-PAGE followed by Western blotting analysis with the anti-Chk1 antibody. The detailed protocol is described in the Methods and Zhang et al. [22] (B) The Flag-HDAC6 was transfected into 293T cells. The Flag-HDAC6 protein was then isolated anti-Flag M2 agarose followed by Coomassie Blue staining. (C). His-Chk1 was purified from E. coli with Ni-NTA beads followed by Coomassie Blue staining. (D) HDAC6 ubiquitinates Chk1 in vivo. Mammalian expression vectors containing Myc-Chk1, Flag-HDAC6, and His-Ub were transfected into 293T cells. Cells were incubated for 48 h, harvested, and passed through a Ni-NTA column to pull down for His-Ub. Bound proteins were subsequently eluted from the columns, run on an SDS-PAGE gel, and probed for Chk1.
Figure 9
Figure 9
HDAC6 and Chk1 physically interact. (A,B) Mammalian expression vectors containing Flag-Chk1 and HA-HDAC6 were transfected into 293T cells with PEI. 48 h after overexpression, cells were harvested in lysis buffer, incubated with either HA-coated (A) or Flag-coated (B) agarose beads, and the resultant immunoprecipitated protein was run on an SDS-page gel and probed for the reciprocal tag. (C) 293T lysates were probed with anti-Chk1 antibody complexed with protein A/G beads, the beads were washed, and the resulting milieu probed for HDAC6 to detect an endogenous interaction between Chk1 and HDAC6. (D) His-Chk1 was overexpressed in E. coli. His-Chk1 was purified with Ni-NTA agarose beads. Then, GST and GST-HDAC6 were overexpressed in E. coli, and GST-tagged protein was pulled-down and purified by glutathione-agarose. Purified His-Chk1 was incubated with either glutathione agarose-bound GST or GST-HDAC6, and then bound proteins were eluted. The samples were subjected to SDS-PAGE and Western blot analysis.
Figure 10
Figure 10
HDAC6 interacts with Chk1 via its DAC1 domain. (A) The indicated Flag-tagged HDAC6 deletion mutant constructs were transfected into 293T cells along with Myc-Chk1. 48 h later, cells were lysed, and lysates were pulled down for Flag. (B) Schematic of the Flag-tagged HDAC6 deletion mutant constructs used for the co-immunoprecipitation in (A). (C) The indicated Myc-tagged Chk1 deletion mutant constructs were transfected into 293T cells along with Flag-HDAC6. 48 h later, cells were lysed, and lysates pulled down for Flag. (D) Schematic of the Myc-tagged Chk1 deletion constructs used for the co-immunoprecipitation in (C).

References

    1. Verdel A., Khochbin S. Identification of a New Family of Higher Eukaryotic Histone Deacetylases. J. Biol. Chem. 1999;274:2440–2445. doi: 10.1074/jbc.274.4.2440. - DOI - PubMed
    1. Grozinger C.M., Hassig C.A., Schreiber S.L. Three proteins define a class of human histone deacetylases related to yeast Hda1p. Proc. Natl. Acad. Sci. USA. 1999;96:4868–4873. doi: 10.1073/pnas.96.9.4868. - DOI - PMC - PubMed
    1. Yang X.J., Seto E. The Rpd3/Hda1 family of lysine deacetylases: From bacteria and yeast to mice and men. Nat. Rev. Mol. Cell Biol. 2008;9:206–218. doi: 10.1038/nrm2346. - DOI - PMC - PubMed
    1. Zhang X., Yuan Z., Zhang Y., Yong S., Salas-Burgos A., Koomen J., Olashaw N., Parsons J.T., Yang X.-J., Dent S.R., et al. HDAC6 Modulates Cell Motility by Altering the Acetylation Level of Cortactin. Mol. Cell. 2007;27:197–213. doi: 10.1016/j.molcel.2007.05.033. - DOI - PMC - PubMed
    1. Hubbert C., Guardiola A., Shao R., Kawaguchi Y., Ito A., Nixon A., Yoshida M., Wang X.-F., Yao T.-P. HDAC6 is a microtubule-associated deacetylase. Nat. Cell Biol. 2002;417:455–458. doi: 10.1038/417455a. - DOI - PubMed

Publication types