Comparative Study
. 2020 Oct 5;11(1):4982.
doi: 10.1038/s41467-020-18754-5.

Distinct signatures of gut microbiome and metabolites associated with significant fibrosis in non-obese NAFLD

Affiliations
Comparative Study

Distinct signatures of gut microbiome and metabolites associated with significant fibrosis in non-obese NAFLD

Giljae Lee et al. Nat Commun. .

Abstract

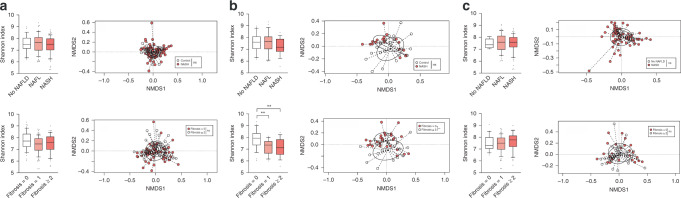
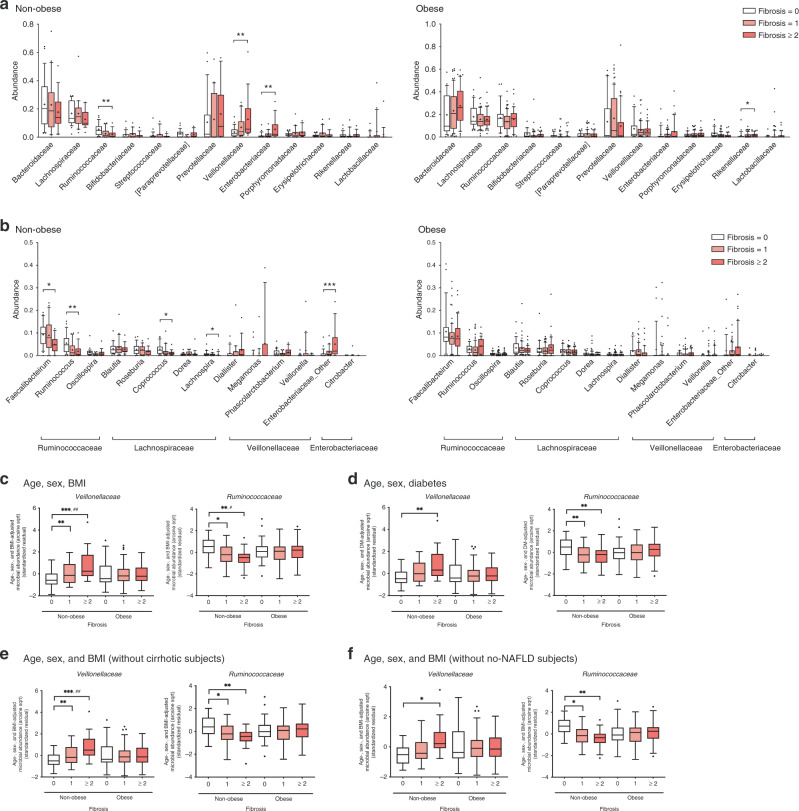
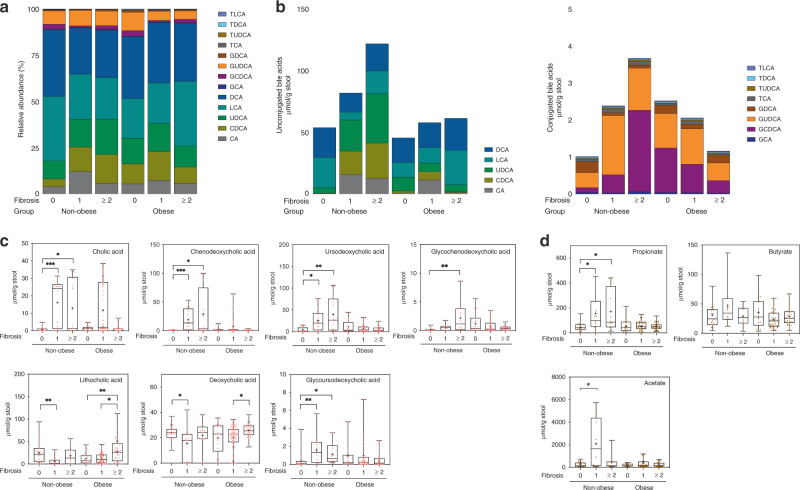
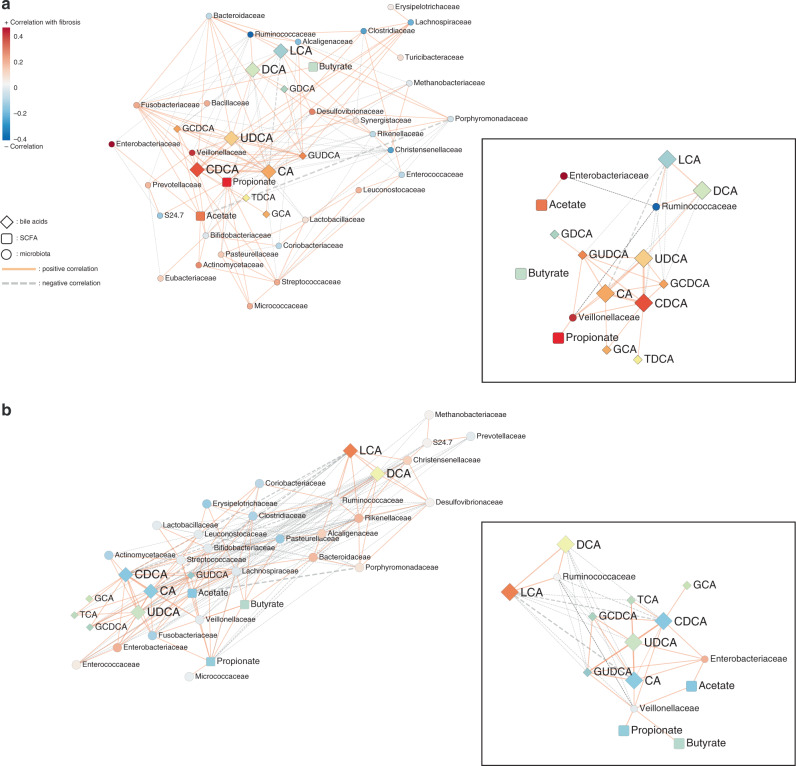
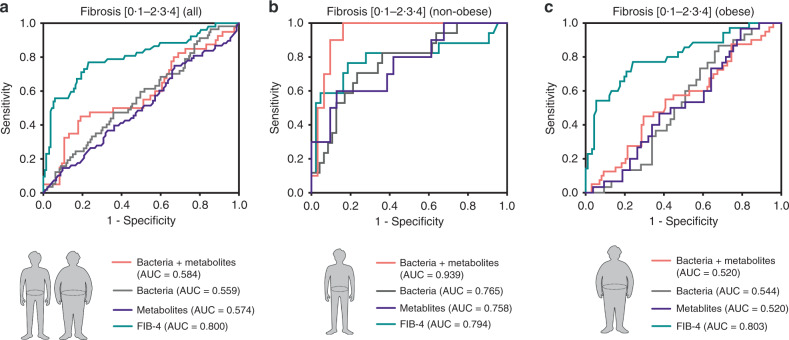
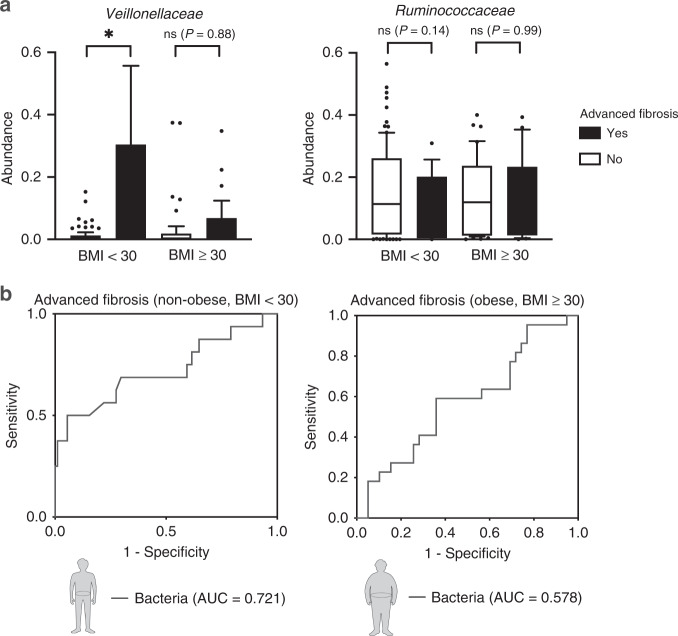
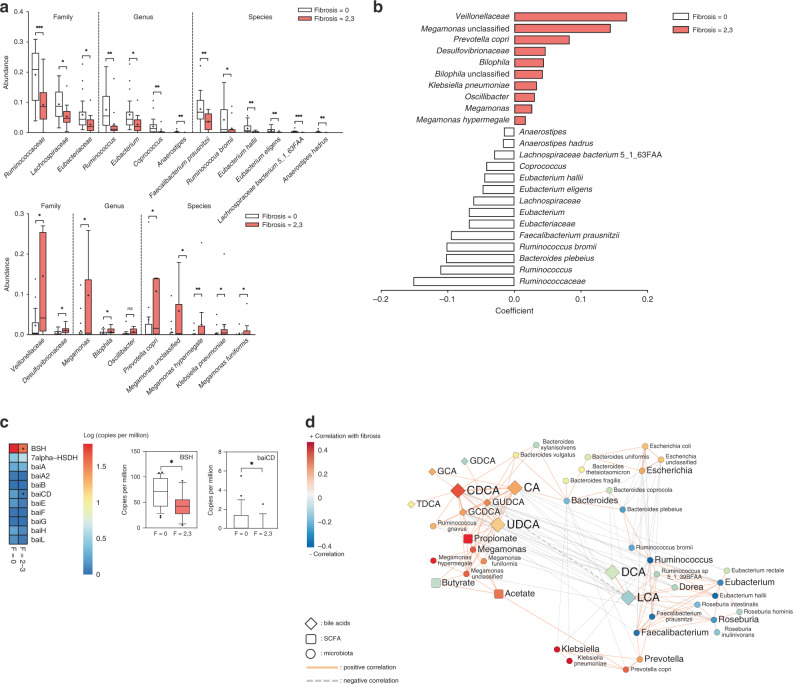
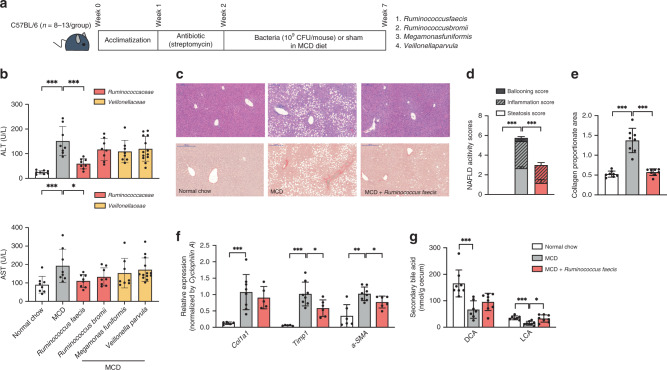
Nonalcoholic fatty liver disease (NAFLD) is associated with obesity but also found in non-obese individuals. Gut microbiome profiles of 171 Asians with biopsy-proven NAFLD and 31 non-NAFLD controls are analyzed using 16S rRNA sequencing; an independent Western cohort is used for external validation. Subjects are classified into three subgroups according to histological spectra of NAFLD or fibrosis severity. Significant alterations in microbiome diversity are observed according to fibrosis severity in non-obese, but not obese, subjects. Ruminococcaceae and Veillonellaceae are the main microbiota associated with fibrosis severity in non-obese subjects. Furthermore, stool bile acids and propionate are elevated, especially in non-obese subjects with significant fibrosis. Fibrosis-related Ruminococcaceae and Veillonellaceae species undergo metagenome sequencing, and four representative species are administered in three mouse NAFLD models to evaluate their effects on liver damage. This study provides the evidence for the role of the microbiome in the liver fibrosis pathogenesis, especially in non-obese subjects.


Conflict of interest statement

G.P.K. is a founder of KoBioLabs, Inc., a company characterizing the role of host–microbiome interaction in chronic diseases. The other authors declare no competing interests.

Figures

Fig. 1
Fig. 1. Comparison of the diversity of gut microbial communities in all, non-obese, and obese subjects.
The alpha and beta diversity of a all (n = 202), b non-obese subjects (n = 64) (**P = 0.0074, F0 vs F1; **P = 0.0084, F0 vs F2–4), and c obese subjects (n = 138) divided by the histological spectra of NAFLD or fibrosis severity. Alpha diversity was based on the Shannon index with 12,000 rarefied sequences per sample. The box plots indicate the median, 25th to 75th percentiles (boxes), and 10th to 90th percentiles (whiskers). Statistical analysis was performed using a two-sided nonparametric Mann–Whitney test or a nonparametric Kruskal–Wallis test with Dunn’s multiple comparison test. NMDS plots were generated using relative OTU abundance data according to the Bray–Curtis distance, and statistical significance was measured using adonis analysis (panel b; *P = 0.038, F0 vs F2–4).
Fig. 2
Fig. 2. Phylogenetic comparisons of the gut microbiome in non-obese and obese subjects.
a The 13 family- and b 14 genus-level taxa with top abundances are depicted for clarity. Statistical significance was measured using a nonparametric Kruskal–Wallis test with Dunn’s multiple comparison test. The P values are as follows: panel (a): **P = 0.0013, **P = 0.0054, **P = 0.0016, and *P = 0.04; panel (b): *P = 0.0217, **P = 0.0013, *P = 0.0209, *P = 0.0234, and ***P = 0.0014. Multivariate associations between specific gut-microbiome components and fibrosis severity stratified by obesity status (cf). Arcsine-root transformed abundances of bacteria were regressed against c age, sex, and BMI, d age, sex, and diabetes, e age, sex, and BMI (without cirrhotic subjects), and f age, sex, and BMI (without no-NAFLD subjects). Statistical analyses for multivariate associations were performed using MaAsLin with adjustments for multiple comparisons (q value). The P and q values are as follows: panel (c): **P = 0.0057, ***P < 0.001, and ##q = 0.0297, *P = 0.0313, **P = 0.0012, and #q = 0.0972; panel (d): from left, **P = 0.0020, **P < 0.0100, (F0 vs F1), and **P = 0.0013 (F0 vs F2–4); panel (e): **P = 0.0071, ***P = 0.0001, and ##q = 0.0339, *P = 0.0191, and **P = 0.0015; panel (f): *P = 0.0136, *P = 0.0292, and **P = 0.0023. The box plots indicate the median, 25th to 75th percentiles (boxes), and 10th to 90th percentile (whiskers). Colors inside the box represent fibrosis severity. ad n = 64 for non-obese and n = 138 for obese; e n = 60 for non-obese and n = 125 for obese; f n = 43 for non-obese and n = 129 for obese. *P < 0.05, **P < 0.01, ***P < 0.001, #q < 0.10, ##q < 0.05. Source data are provided as a Source Data file.
Fig. 3
Fig. 3. Comparison of stool metabolites levels stratified by fibrosis severity and obesity status.
a Composition of bile acid profiles in different clinical settings. Stacked plots are generated using the average abundances of the 13 bile acids. b The stacked bars represent (left) unconjugated bile acids levels and (right) conjugated bile acids levels, which are stratified by fibrosis severity and obesity status. c Box plots represent the concentrations of the stool bile acids, which are stratified by fibrosis severity and obesity status; cholic acid (CA), ***P = 0.0007, *P = 0.0260, n = 57 for non-obese, and n = 111 for obese; chenodeoxycholic acid (CDCA), ***P < 0.0001, *P = 0.0164, n = 54 for non-obese, and n = 96 for obese; ursodeoxycholic acid (UDCA), *P = 0.0107, **P = 0.0012, n = 56 for non-obese, and n = 95 for obese; glycochenodeoxycholic acid (GCDCA), **P = 0.0023, n = 52 for non-obese, and n = 110 for obese; lithocholic acid (LCA), **P = 0.0075, *P = 0.0265, **P = 0.0045, n = 59 for non-obese, and n = 122; deoxycholic acid (DCA), *P = 0.0119, *P = 0.0128, n = 60 for non-obese, and n = 122 for obese; glycoursodeoxycholic acid (GUDCA), **P = 0.0064, *P = 0.0115, n = 47 for non-obese, and n = 99 for obese. d Box plots represent the most abundant fecal short-chain fatty acids (SCFAs) levels (acetate, propionate, and butyrate), which are stratified by fibrosis severity and obesity status; propionate, *P = 0.0114, *P = 0.0182, n = 51 for non-obese, and n = 100 for obese; butyrate, n = 43 for non-obese, and n = 98 for obese; acetate, *P = 0.0440, n = 42 for non-obese, and n = 89 for obese. The box plots indicate the median, 25th to 75th percentiles (boxes), and minimum to maximum values (whiskers). Outliers were removed by the ROUT method (Q = 1%) and data were analyzed using a nonparametric Kruskal–Wallis test with Dunn’s multiple comparison test. *P < 0.05, **P < 0.01, ***P < 0.001. Taurolithocholic acid (TLCA), taurodeoxycholic acid (TDCA), taurochenodeoxycholic acid (TUDCA), taurocholic acid (TCA), glycodeoxycholic acid (GDCA), glycocholic acid (GCA).
Fig. 4
Fig. 4. Network profiles between microbial taxa and stool metabolite components in non-obese and obese subjects.
Co-occurrence coefficients among family-level microbiome components and stool metabolites were calculated by SparCC, and networks (P < 0.05) are depicted using Cytoscape. a Non-obese and b obese. The solid line (orange) and dotted line (gray) indicate positive and negative correlations, respectively. The shape of the node denotes the components used in this study (ellipse: microbiome, diamond: stool bile acids, and round rectangle: SCFAs) and the color indicates the degree of correlation with fibrosis severity. The P-value for each coefficient was obtained by bootstrapping the dataset 500 times and applying SparCC to each of those 500 datasets. Source data are provided as a Source Data file.
Fig. 5
Fig. 5. Receiver-operating characteristic (ROC) curves for the diagnosis of significant fibrosis in all, non-obese, and obese subjects.
ROC curves using the combination of two bacteria (Veillonellaceae and Ruminococcaceae) and four stool metabolites (CA, CDCA, UDCA, and propionate) were plotted for the diagnosis of significant fibrosis in a all, b non-obese subjects, and c obese subjects, and the areas under the ROC curves (AUCs) were calculated. FIB-4, fibrosis 4 index.
Fig. 6
Fig. 6. Validation of gut-microbiome differences between non-obese and obese subjects using a Western NAFLD cohort.
a Abundance of Veillonellaceae and Ruminococcaceae stratified by obesity status and advanced fibrosis (*P = 0.0120, n = 107 for non-obese, and n = 61 for obese). b ROC curves using the combination of two selected bacteria (Veillonellaceae and Ruminococcaceae) were plotted for the diagnosis of advanced fibrosis in non-obese and obese subjects, and the areas under the ROC curve (AUCs) were calculated. The box plots indicate the median, 25th to 75th percentiles (boxes), and 10th to 90th percentiles (whiskers). Statistical analysis was performed using a two-sided Mann–Whitney test. *P < 0.05. ns, not significant.
Fig. 7
Fig. 7. Identification of fibrosis-related bacteria in non-obese subjects using metagenomic shotgun analysis.
Stool metagenome analysis of 38 non-obese subjects was conducted (F0, n = 25; F2–3, n = 13). a Abundances of fibrosis-related taxa are depicted for clarity. Taxa enriched in subjects with fibrosis stage 0 (top) and fibrosis stage of 2 or 3 (bottom). Statistical analysis was performed using a two-sided nonparametric Mann–Whitney test. The P values are as follows: (top) ***P = 0.0009, *P = 0.0113, *P = 0.0124, **P = 0.0024, *P = 0.0124, **P = 0.0051, **P = 0.0049, **P = 0.0070, *P = 0.0451, **P = 0.0041, **P = 0.0011, ***P < 0.0001, and **P = 0.0022; (bottom) *P = 0.0294, *P = 0.0346, *P = 0.0136, *P = 0.0163, *P = 0.0411, *P = 0.0164, **P = 0.0050, *P = 0.0112, and *P = 0.0336. b Multivariate associations between specific gut-microbiome components and fibrosis severity. Arcsine-root transformed abundances of bacteria were regressed against age, sex, and BMI. Only significant coefficients (P < 0.05) are depicted, and the color inside the box represents the enriched fibrosis group. c Heatmap showing the abundances of microbial genes related to bile acid metabolism pathway (left). The box plots indicate the median, 25th to 75th percentiles (boxes), and 10th to 90th percentiles (whiskers) (right) (*P = 0.0124 and *P = 0.0237). d Network profiles between microbial taxa and stool metabolite components. Coefficients among genus, species-level bacteria, and stool metabolite components were calculated by SparCC. Coefficients (P < 0.05) are depicted using Cytoscape. The P-value for each coefficient was obtained by bootstrapping the dataset 500 times and applying SparCC to each of those 500 datasets. The solid line (orange) and dotted line (gray) indicate positive and negative correlations, respectively. The shape of the node denotes the components used in this study (ellipse: microbiome, diamond: stool bile acids, and round rectangle: SCFAs) and the color indicates the degree of correlation with fibrosis severity. *P < 0.05, **P < 0.01, ***P < 0.001. Source data are provided as a Source data file.
Fig. 8
Fig. 8. Effect of fibrosis-associated bacteria on liver damage induced by an MCD diet.
Mice were acclimated for 1 week on a standard chow diet. Then, they were treated with streptomycin (1 g/L) in drinking water for colonization of four fibrosis-related bacteria. Following 5 weeks, the mice were given daily 200 μL of either bacteria (109 CFU/mouse in PBS) or sham in an MCD diet. a Scheme of the animal experiment. b Effects of the MCD diet and bacteria on serum ALT and AST levels (ALT, ***P = 0.0002 and ***P = 0.0003; AST, ***P = 0.0047 and *P = 0.0281) n = 8 for normal chow, MCD, R. faecis, R. bromii, and M. funifomis group) and n = 13 for V. parvula group. c Representative images of Ruminococcus faecis-treated liver tissues stained with H&E and Sirius red. Scale bar indicates 200 μm. d Comparison of histological NAFLD activity scores calculated on H&E stained liver tissues (***P < 0.0001 and ***P = 0.0006; n = 12 for all groups). e Comparison of collagen proportionate areas measured on Sirius red-stained liver tissues (***P = 0.0002 and ***P = 0.0002; n = 8 for all groups). f Relative fibrogenic mRNA expression of liver harvested from Ruminococcus faecis-treated mice (**P = 0.0016, **P = 0.0016, *P = 0.0293, **P = 0.0047, and *P = 0.0356; n = 5–6 for normal chow and MCD + Ruminococcus faecis, n = 8 for MCD). g Comparison of secondary bile acids levels measured in the cecum of Ruminococcus faecis-treated mice (***P = 0.0003, ***P = 0.0006, and *P = 0.0104; n = 7–8 for normal chow and MCD, n = 8 for MCD + Ruminococcus faecis). The bar graphs indicate the means with SDs. Statistical analysis was performed using a nonparametric Kruskal–Wallis test with Dunn’s multiple comparison test or a two-sided Mann–Whitney test. *P < 0.05, **P < 0.01, ***P < 0.001.

References

    1. Loomba R, Sanyal AJ. The global NAFLD epidemic. Nat. Rev. Gastroenterol. Hepatol. 2013;10:686–690. doi: 10.1038/nrgastro.2013.171. - DOI - PubMed
    1. Chalasani N, et al. The diagnosis and management of non-alcoholic fatty liver disease: practice guideline by the American Gastroenterological Association, American Association for the Study of Liver Diseases, and American College of Gastroenterology. Gastroenterology. 2012;142:1592–1609. doi: 10.1053/j.gastro.2012.04.001. - DOI - PubMed
    1. Leung JC, et al. Histological severity and clinical outcomes of nonalcoholic fatty liver disease in nonobese patients. Hepatology. 2017;65:54–64. doi: 10.1002/hep.28697. - DOI - PubMed
    1. Kim D, Kim WR. Nonobese fatty liver disease. Clin. Gastroenterol. Hepatol. 2017;15:474–485. doi: 10.1016/j.cgh.2016.08.028. - DOI - PubMed
    1. Koo BK, et al. Additive effects of PNPLA3 and TM6SF2 on the histological severity of non‐alcoholic fatty liver disease. J. Gastroenterol. Hepatol. 2018;33:1277–1285. doi: 10.1111/jgh.14056. - DOI - PubMed

Publication types

MeSH terms