. 2020 Oct 5;11(1):4977.
doi: 10.1038/s41467-020-18701-4.

Interleukin-6 trans-signaling is a candidate mechanism to drive progression of human DCCs during clinical latency

Affiliations

Interleukin-6 trans-signaling is a candidate mechanism to drive progression of human DCCs during clinical latency

Melanie Werner-Klein et al. Nat Commun. .

Abstract

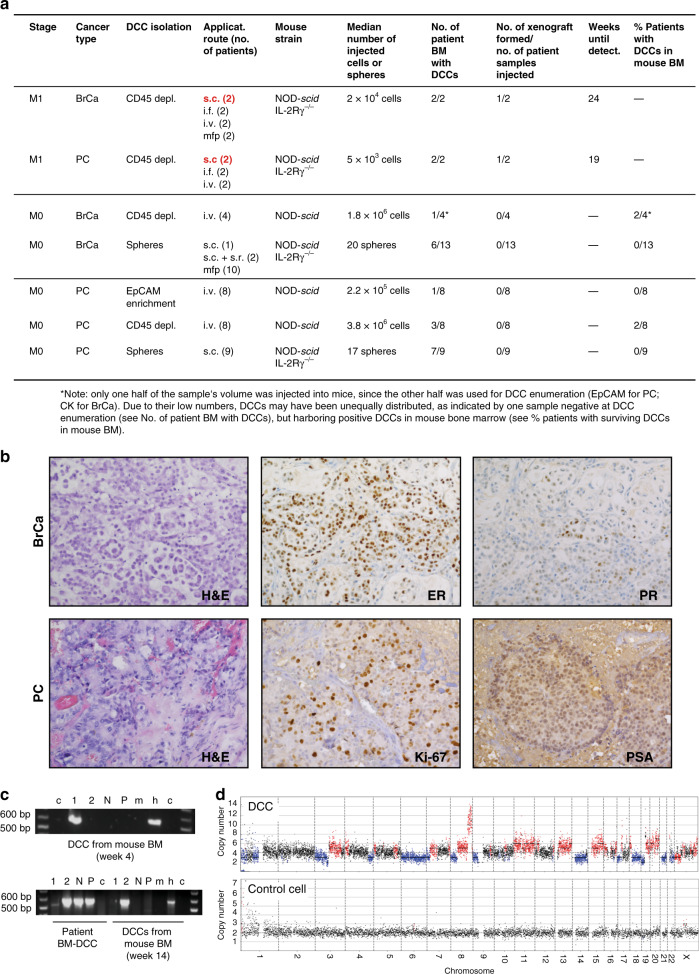
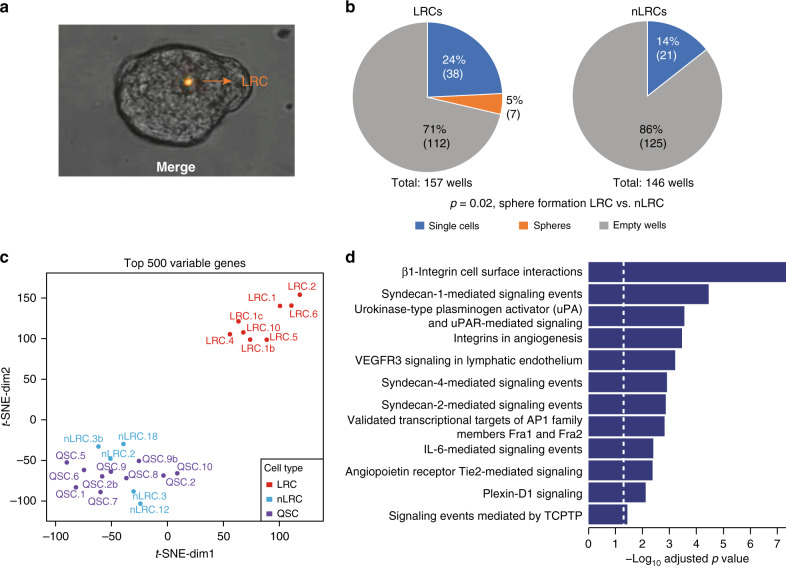
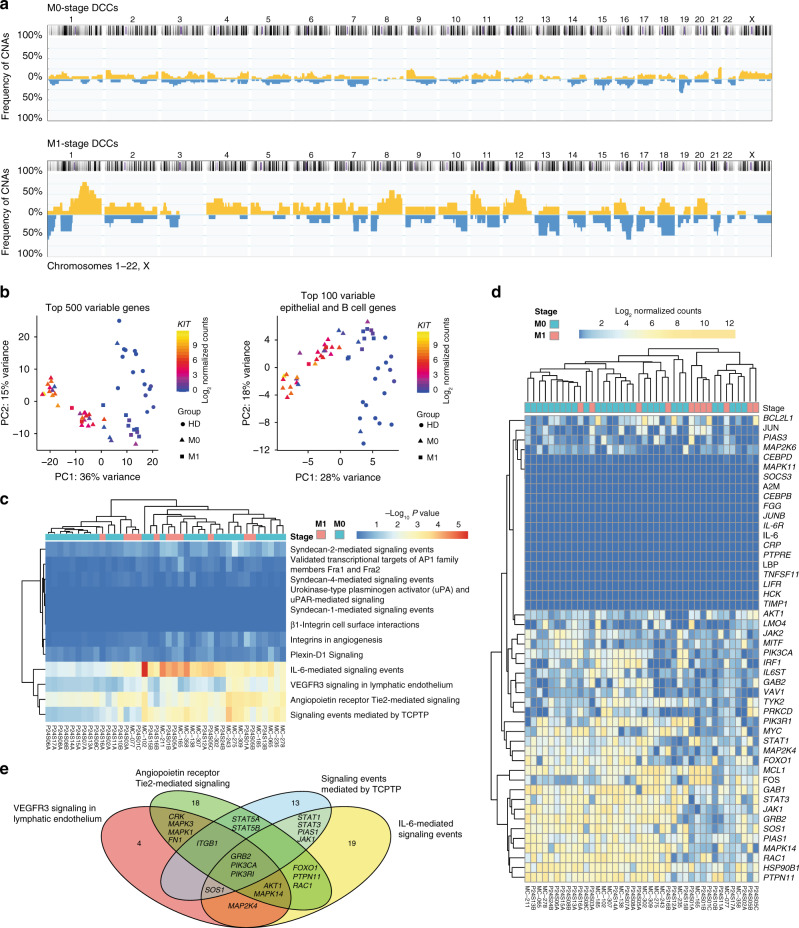
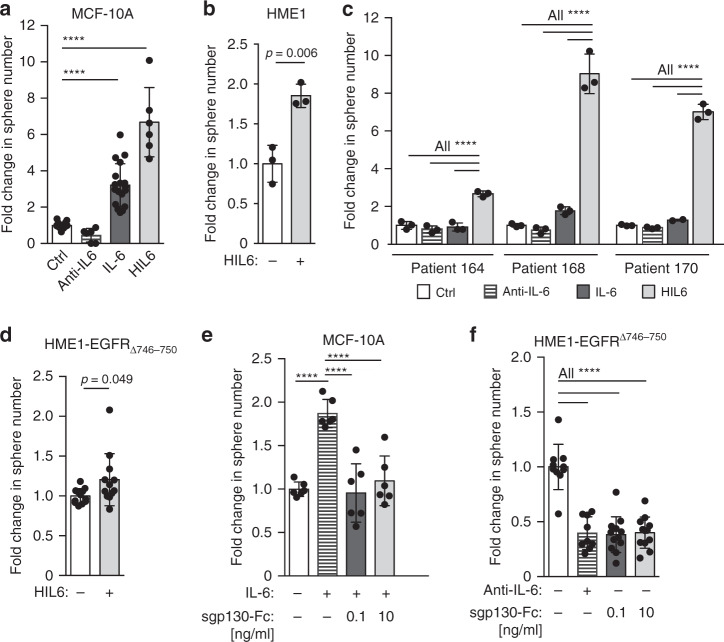
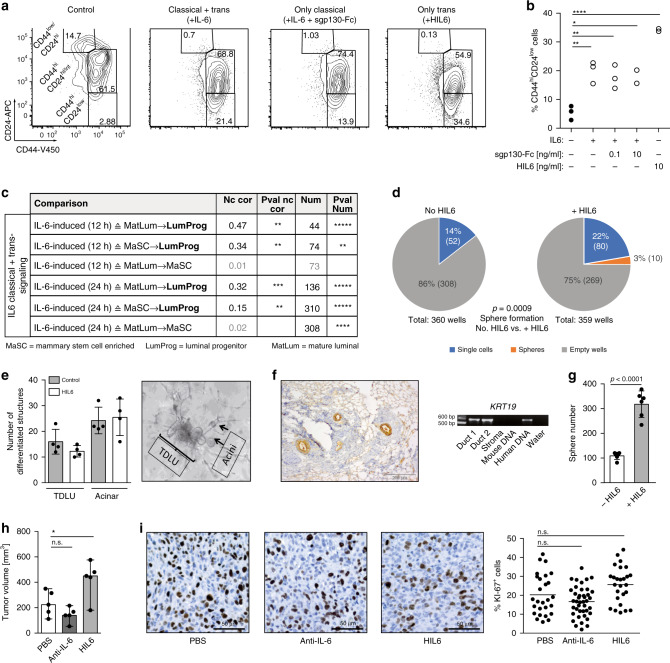
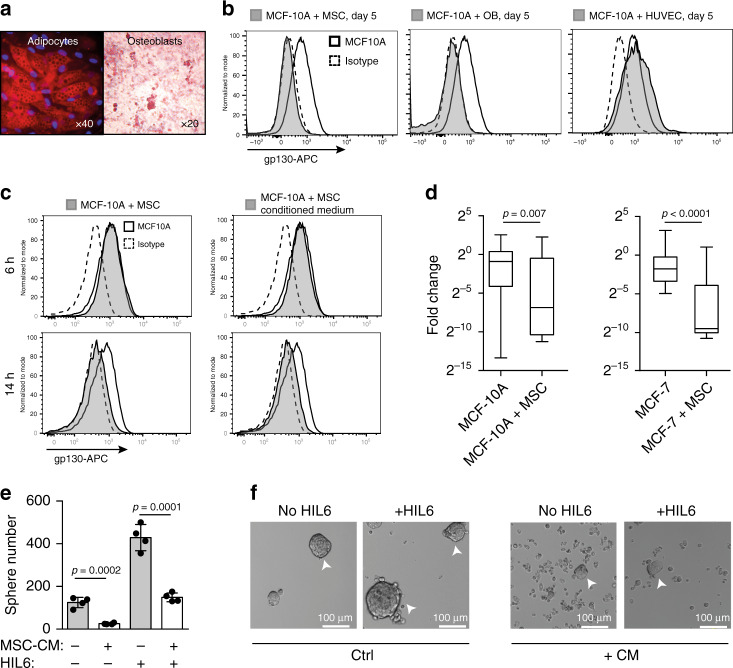
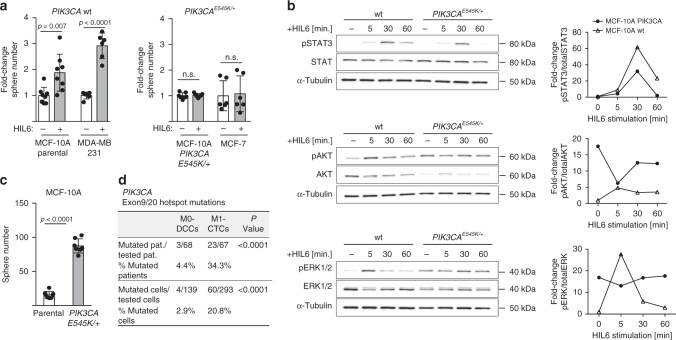
Although thousands of breast cancer cells disseminate and home to bone marrow until primary surgery, usually less than a handful will succeed in establishing manifest metastases months to years later. To identify signals that support survival or outgrowth in patients, we profile rare bone marrow-derived disseminated cancer cells (DCCs) long before manifestation of metastasis and identify IL6/PI3K-signaling as candidate pathway for DCC activation. Surprisingly, and similar to mammary epithelial cells, DCCs lack membranous IL6 receptor expression and mechanistic dissection reveals IL6 trans-signaling to regulate a stem-like state of mammary epithelial cells via gp130. Responsiveness to IL6 trans-signals is found to be niche-dependent as bone marrow stromal and endosteal cells down-regulate gp130 in premalignant mammary epithelial cells as opposed to vascular niche cells. PIK3CA activation renders cells independent from IL6 trans-signaling. Consistent with a bottleneck function of microenvironmental DCC control, we find PIK3CA mutations highly associated with late-stage metastatic cells while being extremely rare in early DCCs. Our data suggest that the initial steps of metastasis formation are often not cancer cell-autonomous, but also depend on microenvironmental signals.


Conflict of interest statement

The authors declare no competing interests.

Figures

Fig. 1
Fig. 1. Xenotransplantation of DCCs.
a Diagnostic bone marrow aspirates from breast (BrCa, n = 19) or prostate (PC, n = 27) cancer patients (M0- or M1-stage of disease) were either CD45-depleted, enriched for EpCAM, or cultured under sphere conditions. Resulting spheres, CD45-depleted, or EpCAM-enriched BM cells were injected intra-venously (i.v.), intra-femorally (i.f.), sub-cutaneously (s.c.), sub-renally (s.r.), or into the mammary fat pad (mfp) of NOD-scid or NOD-scidIL2Rγ-/- mice. Mice with sub-cutaneous or mammary fat pad injections were palpated weekly. All other mice were observed until signs of illness or were sacrificed after 9 months. Injection routes that led to xenograft formation are highlighted in red. b Immunohistochemistry for estrogen-receptor (ER), progesterone-receptor (PR), prostate-specific antigen (PSA), Ki-67, or H & E staining of M1-DCC-derived xenografts is shown. c Human EpCAM- or cytokeratin 8/18/19-expressing DCCs were detected in the BM of 4/42 mice transplanted with M0-stage patient samples. DCCs from two of the four mice were isolated and their human origin was verified by a PCR specific for human KRT19. Pure mouse or human DNA was used as control. 1, 2 = cytokeratin 8/18/19-positive DCCs; N = cytokeratin 8/18/19-negative BM-cell, P = pool of BM-cells of recipient mouse; m = mouse positive control; h = human positive control, c = non-template control. d Single cell CNA analysis of the EpCAM-expressing DCC isolated at 4 weeks after injection from NSG BM (c) and a human hematopoietic cell as control. Red or blue indicate gain or loss of chromosomal regions.
Fig. 2
Fig. 2. IL6 pathway is activated in mammary stem cells.
a Representative picture of a mammosphere (day 7) generated from PKH26-labeled HMECs. b PKH26-labeled HMEC-mammospheres from four patients were disaggregated, sorted by flowcytometry into PKH26+ LRCs and PKH26- nLRCs, plated as single cell per well, and tested for sphere-formation. Shown is the percentage and in parentheses the respective absolute number of empty wells, wells with single cells and spheres after two weeks of mammosphere-culture (number of spheres vs. no spheres for LRCs vs. nLRCs, p = 0.02, two-sided Fisher’s exact test). c, d LRCs (n = 8), nLRCs (n = 5) and QSCs (n = 10) from three patients were subjected to single cell transcriptome microarray analysis. c t-SNE plot of the top 500 most variable genes. d Pathway analysis using the 216 genes differentially expressed between LRCs and the pooled nLRCs plus QSCs. See Supplementary Table 1 for patient/sample-ID allocation.
Fig. 3
Fig. 3. IL6 pathway is activated in BM-DCCs of breast cancer patients.
a DCCs from BM of 21 non-metastasized (M0-stage, n = 30 DCCs) and five metastasized (M1-stage; n = 11 DCCs) breast cancer patients were analyzed for CNAs. The cumulative frequency of genomic aberrations is given in yellow and blue indicating genomic gains and losses, respectively. M0-stage (b, c n = 30; d, e n = 29 and M1-stage (n = 11) DCCs and EpCAM+ BM cells of seven healthy donors, i.e. patients without malignant disease (HD; n = 15 cells) were analyzed by single cell RNA sequencing. b Principal component analysis of the top 500 most variable genes or top 100 most variable epithelial and B cell genes. c DCCs were tested for enrichment in pathways identified to be enriched in LRCs over QSCs/nLRCs (see Fig. 2d). d The heatmap displays log2 normalized read counts of mRNA expression of IL6 signaling pathway genes as listed in the NCI-Nature PID expanded by the LIFR gene. e Venn diagram for the gene-members of the four pathways (d) that are expressed in at least half of bone marrow DCCs (except for the BMX (5/40) and CEBPD (19/40) genes, Supplementary Fig. 1d). Pathway-private genes are annotated by their number, shared genes are named explicitly (see also Supplementary Table 5). See Supplementary Table 1 for patient/sample-ID allocation.
Fig. 4
Fig. 4. IL6 trans-signaling regulates sphere-forming ability.
a MCF 10A cells were cultured as spheres in the absence (n = 18) or presence of IL6 (n = 18), an IL6-blocking antibody (n = 6) or hyper-IL6 (n = 6). b hTERT-HME1 were cultured as spheres in the absence (n = 3) or presence (n = 3) of hyper-IL6. c HMECs were cultured as spheres without or with IL6, with an IL6 blocking antibody or hyper-IL6. n = 3 patients, each patient analyzed in triplicate. d hTERT-HME1-EGFR∆746-750 cells were cultured as spheres in the absence or presence of HIL6 (each n = 12). e MCF 10A cells were cultured as spheres without (n = 6) or with IL6 (n = 6) and IL6 plus sgp130-Fc at indicated concentrations (each n = 6). f Sphere formation of hTERT-HME1-EGFR∆746-750 in the absence (n = 10) or presence of an anti-IL6 antibody (n = 9) or with sgp130-Fc at indicated concentrations (each n = 12). Cumulative data of three experiments. P values in a, c, f: one-way ANOVA with Dunnett’s multiple comparisons test (post hoc); b, d two-sided Student’s t-test; e one-way ANOVA with Tukey’s multiple comparisons test (post hoc); asterisks indicate significance between groups (****p < 0.0001). All error bars correspond to standard deviation (Mean ± SD). See Supplementary Table 1 for patient/sample-ID allocation.
Fig. 5
Fig. 5. IL6 trans-signaling endows non-stem cells with stem-like abilities.
a, b MCF 10A spheres were analyzed by flow cytometry for the expression of CD44 and CD24. The percentage of CD44hiCD24low expressing cells was determined. Data represent cumulative results of three independently performed experiments, each performed in triplicate. c Fold change correlation analysis comparing IL6-induced gene expression in MCF 10A cells at 12 and 24 h, respectively, with gene expression signatures of luminal progenitor (LumProg), mature luminal (MatLum), and mammary stem cell enriched cells (MaSC) according to the study of Lim et al.. Nc cor: non-centered correlation between fold-changes, Num: number of common differentially expressed genes; d LRCs and nLRCs were sorted by flow cytometry from PKH26-labeled HMEC-spheres, nLRCs were plated as single cell per well (n = 3 patients) single-cell deposit determined by manual microscopic evaluation and cultured under mammosphere-conditions with or without HIL6. Sphere-formation and survival of single cells was determined after 14 days (p values are provided within d). Each patient-culture was set-up as duplicate in either freshly prepared or conditioned mammosphere-medium. As no significantly different outcome (Fisher’s exact test, p = 0.6 and p = 1 fresh vs. conditioned medium for cultures w/o HIL6 and with HIL6, respectively) was detected, results are presented as pooled analyses. e In vitro generation of acinar and tubular (TDLU) structures of primary HMECs cultured with or without HIL6 (each n = 4). f Primary HMECs cultured with HIL6 and transplanted into NSG-mice. Staining for human cytokeratin 8/18/19 of the transplanted area eight weeks post-transplantation. PCR specific for human KRT19 of two microdissected cytokeratin 8/18/19-positive ducts and one cytokeratin 8/18/19-negative stromal area. Pure mouse or human DNA was used as control. g MDA-MB-231 cells were cultured as spheres in the absence (n = 6) or presence of HIL6 (n = 6). h Tumor volume of 20,000 MDA-MB-231 cells pre-treated for 3 h with PBS, an anti-IL6 antibody or HIL6 and transplanted into NSG-mice (n = 5). All mice were analyzed at the same day after tumor cell inoculation; n.s. = non significant. i TissueFAX cytometric quantification of tumors from panel (h) for the percentage of Ki-67-positive cells. n = 27, 41, or 26 regions (0.25 mm2 each) for PBS, anti-IL6 or HIL6. P values in panel b, h, i: one-way ANOVA with Dunnett’s multiple comparisons test (post hoc); c P values according to two-sided Student’s t-distribution for (transformed) Nc cor and hypergeometric testing for Num; d two-sided Fisher’s exact test; g two-sided Student’s t test; asterisks indicate significance between groups in multiple comparisons (*p < 0.05, **p < 0.01, ***p < 0.001, ****p < 0.0001, *****p < 0.00001). All error bars correspond to standard deviation (Mean ± SD). See Supplementary Table 1 for patient/sample-ID allocation. Source data for (c) are provided in the Supplementary Table 6.
Fig. 6
Fig. 6. gp130 downregulation by soluble factors of bone marrow stromal cells.
a Mesenchymal stem cells were tested for their ability to differentiate in vitro into adipocytes (Nil oil red O staining) and osteoblasts (Alizarin red S staining). b Surface gp130 expression of MCF 10A after five days of co-culture with primary mesenchymal stem cells (MSCs) from a breast cancer patient, primary osteoblasts (OBs) derived thereof or primary human umbilical vein endothelial cells (HUVECs). c Surface gp130 expression of MCF 10A after 6 and 14 h of co-culture with MSCs or MSC-conditioned medium. b, c Grey filled histograms indicate MCF 10A co-cultured with MSCs, OBs, HUVEC or MSC-conditioned medium. Histograms with a thick black line indicate MCF 10A cells cultured alone and dashed histograms isotype control staining for gp130. d gp130 gene expression levels determined by single cell qPCR of MCF 10A cultured for 5 days with (n = 23) or without (n = 37) MSCs and MCF- 7 cultured for 5 days with (n = 20) or without (n = 20) MSCs. Box and whisker plots show the MCF 10A (MCF-7) fold change cultured with MSCs relative to MCF 10A (MCF-7) cultured without MSCs with boxes marking the median, lower-quartile, and upper-quartile, and lines connecting the extremes. e, f MCF 10A cells were left untreated or pre-treated for 14 h with MSC-conditioned medium, washed and then tested for their ability to form spheres in the presence of endogenously produced IL6/sIL6RA or exogenously added HIL6. Sphere-formation was assessed after seven days, n = 4 for each group. P values according to two-sided Mann–Whitney test (d) or two-sided Student’s t-test (e). All error bars correspond to standard deviation (Mean ± SD).
Fig. 7
Fig. 7. PIK3CA pathway activation confers independency from IL6 signaling.
a Fold change in sphere numbers of pre-malignant (MCF 10A) and tumorigenic cell lines (MCF-7, MDA-MB-231) without (MCF 10A parental, n = 8; MDA-MB-231, n = 6) or with mutational activation of PIK3CA (MCF 10A PIK3CAE545K/+, n = 7; MCF-7, n = 6) cultured in the presence or absence of HIL6. Note that MCF 10A PIK3CAE545K/+ cells are isogenic to MCF 10A parental; n.s. = non-significant. b Western blot analyses showing phosphorylation of STAT3Tyr705, AKTSer475 and ERK1/2Thr202/Tyr204 in MCF 10A or MCF 10A PIK3CAE545K/+ cells cultured without or with HIL6 for the indicated time. For quantification, the signal of the phosphorylated protein and total protein was normalized to α-tubulin, then the ratio of phosphorylated to total protein was calculated. The graphs show the fold change in signal ratio over time relative to the control (unstimulated MCF 10A wt = 1). c Sphere numbers of the isogenic cells MCF 10A parental (n = 8) and MCF 10A PIK3CAE545K/+ (n = 7) cultured in the absence of HIL6. d Cytokeratin 8/18/19+ DCCs from BM of non-metastasized (M0-stage) HR-positive breast cancer patients and CD45-/EpCAM+/cytokeratin 8/18/19+ CTCs isolated from peripheral blood of metastasized (M1-stage) HR-positive breast cancer patients were sequenced for hotspot-mutations in PIK3CA (Exon 9: E545K, E542K; Exon 20: H1047R, H1047L, M1043I). P values in a, c two-sided Student’s test; d two-sided Fisher’s exact test. All error bars correspond to standard deviation (Mean ± SD).

References

    1. Engel J, et al. The process of metastasisation for breast cancer. Eur. J. Cancer. 2003;39:1794–1806. doi: 10.1016/S0959-8049(03)00422-2. - DOI - PubMed
    1. Klein CA. Parallel progression of primary tumours and metastases. Nat. Rev. Cancer. 2009;9:302–312. doi: 10.1038/nrc2627. - DOI - PubMed
    1. Klein CA. Framework models of tumor dormancy from patient-derived observations. Curr. Opin. Genet. Dev. 2011;21:42–49. doi: 10.1016/j.gde.2010.10.011. - DOI - PubMed
    1. Harper KL, et al. Mechanism of early dissemination and metastasis in Her2(+) mammary cancer. Nature. 2016;540:588–592. doi: 10.1038/nature20609. - DOI - PMC - PubMed
    1. Hosseini H, et al. Early dissemination seeds metastasis in breast cancer. Nature. 2016;540:552–558. doi: 10.1038/nature20785. - DOI - PMC - PubMed

Publication types

MeSH terms